DOI:
10.1039/C5RA17322A
(Paper)
RSC Adv., 2015,
5, 89839-89847
Hydrothermal and activated synthesis of adsorbent montmorillonite supported porous carbon nanospheres for removal of methylene blue from waste water
Received
27th August 2015
, Accepted 15th October 2015
First published on 15th October 2015
Abstract
Novel adsorbent, montmorillonite supported porous carbon nanospheres (MMT-PCN) were conveniently synthesized by a hydrothermal carbonization and chemical activation treatment with ZnCl2. The as-prepared MMT-PCN material was characterized by scanning electron microscopy (SEM), X-ray diffraction (XRD), Fourier transform infrared spectroscopy (FTIR), and N2 adsorption technology. The results indicated that the material possessed superior porosity with high surface area and large pore volume, which was utilized to remove methylene blue (MB) from an aqueous solution. The batch adsorption results implied that this novel MMT-PCN adsorbent exhibited greater performance (686.94 mg g−1) for the removal of MB than other adsorbents. Adsorption kinetics of MB onto the composite followed the pseudo-second-order kinetic model and the adsorption isotherm data were fitted well to the Langmuir isotherm. Thermodynamic parameters, such as ΔG°, ΔH° and ΔS° were also determined and evaluated. In addition, the MMT-PCN composite exhibited satisfactory reusability properties after five consecutive cycles.
1. Introduction
Nowadays, dyes are widely used in textiles, printing, dye manufacturing, and food plants.1–3 The extensive utilization of dyes in different kinds of industries often lead to pollution problems by the discharge of dyes into environmental water bodies.4 Dye effluents contain complex compounds, toxic synthetic substances and even the presence of trace amounts of organic dyes could induce a lot of significant problems, such as toxicity and reducing light penetration of the effluent.5,6 Methylene blue (MB), a cationic dye, is a representative compound of the water-soluble dyes with high chromaticity, which is usually utilized extensively for dying cotton, wool and silk. However, the excess MB discharged along with the wastewater could cause metabolic disorders. The harmful effects, including carcinogenicity and mutagenicity have been well confirmed, becoming a threat to aquatic life.7,8 Therefore, extensive attentions have been focused on the removal of MB from wastewaters.
To date, various methods and strategies have been reported for the treatment of dye wastewater, such as biological treatment, chemical oxidation, flocculation and sedimentation, adsorption, and photocatalytic degradation.9–12 However, most of above traditional methods are not widely utilized because dyes are chemically and photolytically stable and the complex aromatic structures of these substances may hinder their natural biodegradation processes.13 Thus, the adsorption is considered to be the most convenient and effective method for the removal of dye from waste water.14 Among plenty of adsorbents, active carbon (AC) are one of the most extensively investigated materials owing to their porous texture, as well as their non-toxicity, chemical inertness, and strong interaction.15–17 However, most pores in AC are micropores (<2.0 nm), which obstruct the transfer of bulky dye molecules into the inner surface of the micropores limiting the efficient utility of large surface area of AC.18 Other adsorbents, including zeolite, flyash, chitosan and by-products from juice processing have been reported to remove dyes from wastewater, however, most of above mentioned adsorbents are severely limited due to their high cost, high difficulties in the preparation process.19–22 From this point of view, it is highly desirable to prepared low-cost, porous carbon materials with large external surface area for the efficient adsorption of bulky dyes from polluted water.
In this study, it firstly developed a facile and green process for composing a low-cost montmorillonite supported porous carbon nanospheres adsorbent (MMT-PCN) by the hydrothermal carbonization (HTC) and activation technology.23 Na+-montmorillonite (Na+-MMT), an aluminum silicate layer mineral material, is extensively investigated in the field of environmental remediation in recent years due to the layered structures, large surface areas, ready availability and a high cation exchange capacity.24 Glucose, a cost-effective compound compared to polymeric materials, is usually selected as a carbon former in the nanocomposite material, especially for the mass production of nanoporous carbon. Carbon nanospheres (CNS) from glucose by HTC possess abundant oxygen-containing and hydrogen-containing functional groups and the presence of surface functional groups played an important role in the adsorption capacity and removal mechanism of the adsorbates.25 In this work, two cost-efficient and environmental friendly materials which include MMT (a good antidiarrheal medicine) and glucose (an edible nutriment) were used to reduce costs. Ammonium iron(II) sulfate hexahydrate (FeSO4(NH4)2SO4·6H2O) was introduced into the reaction serving as a catalyst, which not only catalyzed the process of glucose carbonization but also apparently improved the deposition rate of carbon nanosphere onto Na+-MMT.26,27 What is more, CNS were converted into porous carbon nanoparticles (PCN) with extremely large surface area and pore structure (from micropore to mesopore) during the process of chemical activation with ZnCl2. These novel PCNs materials exhibited excellent performance for the adsorption of bulky organic dyes in comparison with commercial AC and ordered mesoporous carbon. And then, this MMT-PCN adsorbent was applied for MB removal from an aqueous solution to evaluate their feasibility as a novel adsorbent in environmental remediation. The detailed adsorption properties of the novel adsorbent, including the contact time, solution pH, temperature, isotherms, kinetics and thermodynamics on adsorption were investigated. In addition, the reusable property of the as-synthesized material was also studied.
2. Experimental
2.1. Chemicals and materials
The Na+-MMT was purchased from Feng hong Colloidal Co. Ltd. (Zhe jiang Province, China). Cellulose, HCl (0.5 M), FeSO4(NH4)2SO4·6H2O, ZnCl2 and MB (the structure of MB was shown in Fig. 1) were of analytical grade and were bought from Sinopharm Group Co., Ltd (Shanghai, China). All other chemicals were of analytical grade and received form Sinopharm Chemical Reagent Co., Ltd. (Beijing, China). Deionized water was used in the experiment.
 |
| | Fig. 1 The chemical structure of MB. | |
2.2. Apparatus
Fourier transform infrared spectroscopy (FTIR) spectra of a sample in KBr pellet were recorded on Nicolet Avatar 370 DTGS (Nicolet, USA). X-ray diffraction (XRD) powder patterns were taken on a D/max-γB diffractometer using Cu Kα radiation. Scanning electron microscopy (SEM) was performed with a Philips XL30 FEG FE-SEM instrument at an accelerating voltage of 25 kV. Transmission electron microscopy (TEM, Tecnai G2F30, FEI, USA) combined with an energy-dispersive X-ray spectrometer. N2 adsorption–desorption isotherms was carried out at −196 °C using a micromeritics ASAP 2020 analyzer. Before adsorption, the samples were out-gassed at 120 °C for 12 h. The specific surface area (SBET) was evaluated using the Brunauer–Emmett–Teller (BET) method, and the mesopore volume and micropore volume were calculated according to the Barrett–Joyner–Halenda (BJH) formula and t-plot method, respectively. The Shimadzu UV-3100 spectrophotometer was used to detect the MB concentrations at 664 nm.
2.3. Preparation of MMT-PCN materials
The MMT-PCN was prepared for the first time. In order to obtain the composite, MMT-CN was synthesized firstly. In brief, glucose (5.0 g) and FeSO4(NH4)2SO4·6H2O (2.4 g) were dissolved in 40 mL deionized water. Na+-MMT (1.5 g) was then added and the mixture was stirred for 2 h at room temperature (RT). The final suspension was transferred to a Teflon-lined stainless-steel autoclave (100 mL in total inner volume), sealed, and maintained at 180 °C for 24 h. The black product was centrifuged, washed with deionize water several times, and then dried in an oven at 80 °C for 8 h.28
The dried MMT-CN materials were impregnated in ZnCl2 (0.25 mol L−1) solution. The solution was dried at 120 °C for 12 h to obtain ZnCl2-impregnated MMT-CN materials, and then the materials were activated in N2 atmosphere at 400 °C for 2 h. After cooling down, the activated samples were thoroughly washed with HCl solution (0.5 M) and deionize water. Finally, the materials were dried under vacuum at 80 °C for 10 h to obtain MMT-PCN materials.
2.4. The adsorption experiments of MB
Batch equilibrium adsorption isotherm studies were performed by adding 50 mg of new adsorbent into 40 mL of the solutions with different concentration in the range of 300 to 1000 mg L−1. All of the solutions were placed in shaking thermostat (N-BIOTEK, NB-300) with a mechanical shaker at the speed of 240 rpm. After centrifugation, the residual dye solution was analyzed using UV-vis spectrophotometer at 665 nm. Using the obtained experimental results value the adsorption capacity (eqn (1)) and the removal percentage (η) have been calculated (eqn (2)).| |
 | (1) |
| |
 | (2) |
Where C0 (mg L−1) and Ce (mg L−1) are the initial and equilibrium concentrations of MB, m (g) is the mass of composite, V (L) is the volume of solution, and qe (mg g−1) is the adsorbed amounts.
3. Results and discussion
3.1. Characterization of MMT and MMT-PCN
SEM is a primary tool for characterizing the surface, shape and size properties of the adsorbent. As can be seen from Fig. 2A, the Na+-MMT appeared as a flat shape, layer structure and a smooth surface, which was well consistent with descriptions in the previous study.29 As was shown clearly in Fig. 2B, there were a large number of granular nanospheres after Na+-MMT was treated by HTC, which were not only loaded on the surface but also well-inserted into the layer structure of Na+-MMT, resulting in an increase in the clay basal spacing. In addition, it also can be seen that the main structure of Na+-MMT was maintained even after the combination with nanospheres, demonstrating that the Na+-MMT structure still existed in MMT-PCN product.
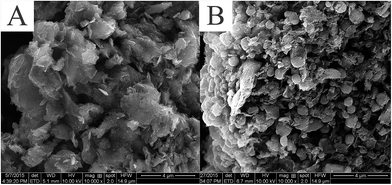 |
| | Fig. 2 SEM images of MMT (A) and MMT-PCN (B). | |
TEM was carried out to gain detailed information on the morphology and microstructure of the as-prepared samples. Fig. 3A displayed a typical TEM image of the MMT with layer structure. The TEM image (Fig. 3B) of MMT-PCN showed that porous carbon nanospheres were deposited in the interior and exterior of the MMT-PCN which is consistent with the SEM results. In addition, as shown in Fig. 3C–G, the energy dispersive X-ray spectrometry (EDS) mapping indicated that the C, O, Si, Al and Na elements were distributed throughout the MMT-PCN samples.
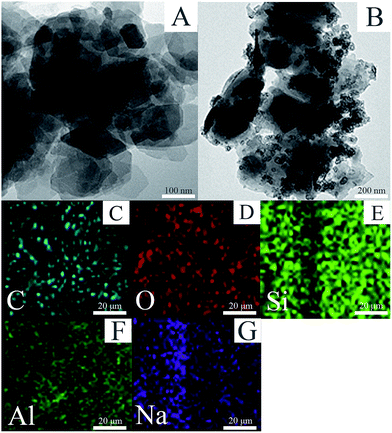 |
| | Fig. 3 TEM images of MMT (A), MMT-PCN (B), and the elemental mapping of C, O, Si, Al, Na acquired from (C–G). | |
XRD of the Na+-MMT and MMT-PCN composite were shown in Fig. 4A. It can be observed that the diffraction peaks characterized for the following crystalline phases (curve a): Na–Al–Si–O–OH–H2O and AlSiO6(OH)2. The peak 2θ = 7.36° represented a typical pattern of Na+-MMT and the value of d(001) is 1.20 nm.30 In contrast, combined with a series of processes, the results of the characterizations clearly indicated that the characteristic (001) peak of the as-prepared MMT-PCN sample (curve b) were obviously reduced to nearly flat and also shifted to a lower diffraction angle (the value of 2θ decreased from 7.36 to 6.49). Meanwhile, the interlayer spacing became larger (from 1.20 to 1.36 nm) from Bragg equation, which corresponded to an increase in the clay basal spacing.31 Furthermore, by contrast with the Na+-MMT one can find some changes but most of the main diffraction peaks maintained the same, indicating that the crystal structure of MMT did not suffer too much damage. This analysis of the illustrations is well consistent with the SEM results, preliminarily showing that the MMT-PCN has been prepared successfully.
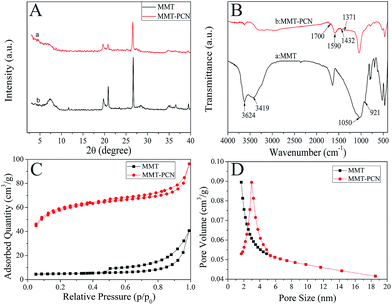 |
| | Fig. 4 The XRD (A), FTIR (B), N2 adsorption/desorption isotherms (C) and BJH pore size distribution (D) of MMT and MMT-PCN. | |
FTIR is used to characterize the chemical structure and functional groups. Results of the FTIR spectra of Na+-MMT and MMT-PCN composite are visualized in Fig. 4B. The spectra of Na+-MMT (curve a) exhibited that bands in the 3419–3624 cm−1 region were ascribed to –OH stretching vibration, while Si–O and Al–O stretching vibration band occurs at around 1050 and 921 cm−1. Bands in the 400–600 cm−1 region were attributed to Si–O and Al–O bending vibration.32 After Na+-MMT was treated with HTC technique, several new bands, including the 1700 and 1432 cm−1 bands of carboxyl groups (–COOH), the 1590 cm−1 band of a ketone and the 1371 cm−1 band of –C–OH, emerged in the FTIR spectrum of the MMT-PCN (curve b) nanocomposite.28 These analyses rightly indicated that the Na+-MMT was just modified by the functional carbonaceous species produced from the carbonization of glucose.
The N2 adsorption–desorption isotherms and pore size distribution of MMT and MMT-PCN are displayed in Fig. 4C and D. The adsorption isotherm of MMT was type I at low pressures (microporous solids) according to the IUPAC classification. Nevertheless, the isotherm of MMT-PCN displayed a combination of type I and IV shape with pronounced H4-type hysteresis loop,33 which suggests that more mesopores appeared after treatment of ZnCl2. Both adsorption–desorption profiles and pore size distributions suggested the increase of adsorption capability of MMT-PCN over the MMT. Additionally, the BJH pore size distribution plots, shown in Fig. 5B and its inset, was determined from the adsorption branch of the N2 isotherms, presenting a major pore diameter of 3 nm for MMT-PCN nanocomposite and only 1.8 nm for MMT, respectively. The important structural parameters were derived from the isotherms and tabulated in Table 1. As expected, the MMT-PCN nanocomposite displayed a specific surface area (SSA) of 589.30 m2 g−1, which was nearly 38 times that of the MMT sample (15.62 m2 g−1). The results revealed that the basic space of the clay layer was covered, filled by the porous carbonaceous nanoparticles during the HTC, which resulted in the enhanced SSA and a significant change in the porosity, showing that the porous carbon nanospheres were really integral parts of the MMT-PCN nanocomposite.
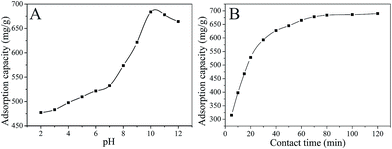 |
| | Fig. 5 Influence of the solution pH (A) (C0 = 1000 mg L−1; T = 298 K), and contact time (B) (C0 = 1000 mg L−1; T = 298 K; pH = 10) of MB adsorption on MMT-PCN. | |
Table 1 Textural properties of MMT and MMT-PCN
| Sample |
SBET (m2 g−1) |
Pore volume (cm3 g−1) |
Average pore diameter (nm) |
| MMT |
15.62 |
0.038 |
4.055 |
| MMT-PCN |
589.30 |
0.330 |
2.301 |
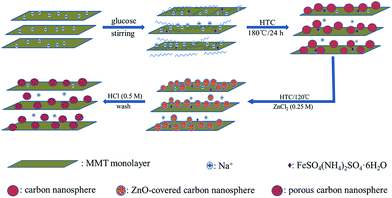
Based on the above, the whole preparation mechanism and the schematic structure of the MMT-PCN nanocomposite were tentatively speculated as showed in Scheme 1. When the mixture solution of MMT and glucose was sonicated and stirred before HTC treatment, the MMT were homogeneously dispersed in water and the glucose molecules absorbed on the dispersed MMT surface and layers due to a match of polarity and structure groups. At an early HTC reaction stage, the glucose adsorbed on MMT began to dehydrate into a furan-like molecule as the first step and subsequent polymerization and formation of a carbon core as a second step.34 The carbon core could continue to absorb glucose on the surface and enlarge gradually by going with carbonization due to the catalysis of the FeSO4(NH4)2SO4·6H2O for the carbonization process of glucose.35 When heat the material with immersed ZnCl2, ZnCl2 is transferred to ZnO during the activating process. Then the ZnO nanoparticles in carbon nanoparticles are once removed by acid washing, and finally these remained voids contribute additional porosity in internal structure.28
 |
| | Scheme 1 The preparation mechanism and the schematic structure of the MMT-PCN. | |
3.2. Adsorption studies
3.2.1. Effect of pH. The pH of the dye solution has a significant effect on the adsorption process, particularly on the adsorption capacity. The effect of pH on adsorption amount of MB was studied using an initial dye concentration of 1000 mg L−1 and 40 mg MMT-PCN at the RT with the pH varying from 2 to 12, while keeping the contact time, rotating speed, initial concentration and adsorbent as constant. As shown in Fig. 5A, the adsorption capacity increases slowly with the pH changing from 2 to 7 and then increases dramatically reaching a maximum at pH = 10, beyond which a slight decline occurs. These phenomena can be explained as follows: MB, a cationic dye, is positively charged in solution and H+ will compete with MB before pH = 7 when the MMT-PCN adsorpt MB by cation exchange.36 After pH = 7, MB is adsorbed except by cation exchange and also by the carboxyl adsorption of porous carbon nanosphere. When the pH value is greater than 10, some alkali metal ions will precipitate and block partial channels of the MMT-PCN. Hence further experiments were carried out with the pH = 10 only.
3.2.2. Effect of contact time. The effect of contact time on removal efficiency of MB was studied at pH 10, 298 K with 40 mg adsorbent and 40 mL MB solution (1000 mg L−1). It is observed from Fig. 5B, the adsorption processes are rapid during the first 30 min of contact time and then the adsorption capacity increases slowly reaching equilibrium within 80 min. When the contact time is 80 minutes, the adsorption amount of the MB is 686.94 mg g−1, however, when the contact time was longer than 80 min no obvious increase in adsorption amount was obtained. Therefore, 80 min was selected as the optimal contact time and used in the further study.
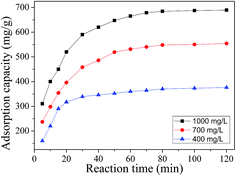
3.2.3. Effect of initial dye concentration. The effect of the initial dye concentration seriously depends on the relation between the dye concentration and the active centre available on an adsorbent surface. The effect of the dye concentration have been investigated at pH 10, 298 K in three concentration levels (400![[thin space (1/6-em)]](https://www.rsc.org/images/entities/char_2009.gif) 700, 1000 mg L−1) with 40 mg adsorbent. The amount of adsorbed dye increased from 370 to 684 mg g−1 with the increase in the initial dye concentration from 400 to 1000 mg L−1. As depicted in Fig. 6, the results indicated that the dye removal is concentration dependent. The adsorption capacity of MB increases with increasing the MB concentration. This may be attributed to the extent of a driving force of concentration gradients with the increase in the MB concentration.
700, 1000 mg L−1) with 40 mg adsorbent. The amount of adsorbed dye increased from 370 to 684 mg g−1 with the increase in the initial dye concentration from 400 to 1000 mg L−1. As depicted in Fig. 6, the results indicated that the dye removal is concentration dependent. The adsorption capacity of MB increases with increasing the MB concentration. This may be attributed to the extent of a driving force of concentration gradients with the increase in the MB concentration.
 |
| | Fig. 6 Influence of initial dye concentration. | |
3.2.4. Adsorption kinetics. To investigate the adsorption mechanism of MB onto the MMT-PCN, three kinetic models, pseudo-first-order kinetic model known as the Lagergren kinetic model, pseudo-second-order kinetic model, and intraparticle diffusion model were applied to find the best fitted model for the experimental data. For each experimental run, 50 mg absorbent and 40 mL of MB solution (1000 mg L−1) were transferred in flask at pH = 10 and three different temperatures (298 K, 313 K, 333 K). The pseudo-first-order equation can be expressed as follows eqn (3).| |
 | (3) |
Where k1 is the pseudo-first-order rate constant (min−1), qe (mg g−1) and qt (mg g−1) are the amounts of dye adsorbed at equilibrium and at time t (min).The pseudo-second-order model is given by the eqn (4).
| |
 | (4) |
Where
k2 (g mg
−1 min
−1) is the rate constant of the pseudo-second order adsorption.
The intraparticle diffusion models is given by the eqn (5).
Where
ki is the intraparticle diffusion rate constant (mg g
−1 min
−0.5) and
l is the effect of boundary layer thickness.
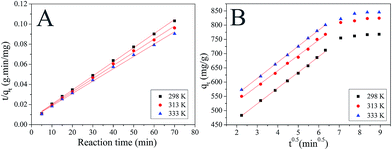
The correlation coefficients were used to determine the best fitting kinetic model. Kinetic constants obtained for the fitted models are presented in Table 2. The correlation coefficients (R2) for the pseudo-first-order kinetic model are relatively low suggesting the adsorption of MB on MMT-PCN can't be applied a first-order model. For the pseudo-second-order kinetic model, the values of R2 is over 0.99, which indicates that MB adsorption process is described by the pseudo-second-order model (Fig. 7A). As the temperature increases, the k2 decreases indicating that the necessary time for reaching the equilibrium increases with increasing temperature, and that the adsorption of MB on MMT-PCN is an endothermic process.
Table 2 Kinetics parameters of adsorption of MB by MMT-PCN
| T (K) |
First order kinetic |
Second order kinetic |
Intraparticle diffusion |
| k1 (min−1) |
R2 |
k2 (min−1) |
R2 |
ki (mg g−1 min−0.5) |
l |
R2 |
| 298 |
0.05103 |
0.95292 |
1.5267 |
0.99859 |
55.195 |
358.332 |
0.99846 |
| 313 |
0.05057 |
0.91331 |
1.4170 |
0.99740 |
53.866 |
424.48 |
0.99868 |
| 333 |
0.04458 |
0.94640 |
1.3160 |
0.99707 |
56.394 |
444.195 |
0.99947 |
 |
| | Fig. 7 Pseudo-second order kinetic model (A) fitting for the adsorption of MB dye on MMT-PCN and the intraparticle diffusion (B) of MB by MMT-PCN (C0 = 1000 mg L−1; t = 80 min; pH = 10). | |
The intraparticle diffusion model was used to explain the diffusion mechanism.37 The dye adsorption process involves several steps: dye diffusion through solution to the outer surface of the adsorbent (film diffusion), dye adsorption on the outer surface of the adsorbent, dye diffusion from the surface into the adsorbent interior (intraparticle diffusion) and, dye adsorption onto the active centres in the interior surface of the adsorbent. From the plot of qt versus t0.5, the values of intraparticle diffusion rate constant (ki) and the effect of boundary layer thickness (l) were calculated (Table 2). As can be seen from Fig. 7B, the plots are not linear over the whole time range which means that the intraparticle diffusion is not the rate determining step of the adsorption mechanism of MB onto MMT-PCN. The boundary layer diffusion was also significant.38 Maximum is the intercept length (l), adsorption is more boundary layer controlled.
3.2.5. Adsorption isotherms. The equilibrium adsorption isotherm is fundamental in describing the interactive behavior between solutes and adsorbent, and is important for the design of adsorption system. For a better understanding of the adsorption process four adsorption models Freundlich, Langmuir, Temkin, and Dubinin–Radushkevich have been used to find the best isotherm for the experimental data obtained at equilibrium. The adsorption process was carried out at different temperatures from 298 K to 333 K with initial concentration of MB varying from 300 to 1000 mg L−1. To ensure full equilibration, a shaking time of 120 min was used for all concentrations of MB in this study.The Langmuir isotherm theory assumes monolayer coverage of adsorbate over a homogenous adsorbent surface. A basic assumption is that adsorption takes place at specific homogeneous sites within the adsorbent. Once a dye molecule occupies a site, no further adsorption can take place at that site.39 Langmuir equation can be represented in the follow eqn (6).
| |
 | (6) |
Where
KL (L mg
−1) is the Langmuir constant related to the equilibrium of adsorption,
Ce (mg L
−1) is the equilibrium concentration and
Q (mg g
−1) is the maximum amount of MB for complete monolayer coverage.
The separation factor RL, a dimensionless constant, are used to express the essential characteristic of Langmuir isotherm by the eqn (7).38
| |
 | (7) |
Where
C0 is the initial concentration of the dye (mg L
−1). The value of this coefficient indicates whether the isotherm is or not favourable: for 0 <
RL < 1 the model is favourable; for
RL > 1 the model is unfavorable and for value
RL = 0 the model is irreversible.
Compared to the Langmuir isotherm, the Freundlich isotherm is an empirical equation assuming that the adsorption process takes place on heterogeneous surfaces and adsorption capacity is related to the concentration of MB dye at equilibrium.40 The logarithmic form of the Freundlich isotherm is shown in the follow eqn (8).
| |
 | (8) |
Where
KF (L g
−1) and
n are Freundlich constants related to the capacity and intensity of adsorption, respectively.
The Tempkin isotherm model considered the effects of some indirect adsorbate–adsorbate interactions on adsorption isotherms and suggested that because of these interactions the heat of adsorption of all the molecules in the layer would decrease linearly with coverage. The Temkin isotherm is expressed as eqn (9)
| |
 | (9) |
where:
KT is the Temkin isotherm equilibrium binding constant (L g
−1),
b is the Temkin isotherm constant related to the heat of adsorption (J mol
−1).
Dubinin–Radushkevich (D–R) model is also a very typical isothermal adsorption model. This model is expressed by the eqn (10) and (11).
| |
ln![[thin space (1/6-em)]](https://www.rsc.org/images/entities/char_2009.gif) qe = ln qe = ln![[thin space (1/6-em)]](https://www.rsc.org/images/entities/char_2009.gif) qd − βε2 qd − βε2
| (10) |
| |
 | (11) |
Where:
qd is the Dubinin–Radushkevich isotherm constant (g g
−1),
β is the Dubinin–Radushkevich isotherm constant related to the adsorption free energy and
ε is Polanyi potential energy.
The analysis of the experimental data and determination of isotherms parameters were performed using the non-linear regression analysis from ORIGIN 8.0 software package. The squared multiple regression coefficient (R2), and the chi-square analysis (x2) are the principal statistical criteria.
Chi-square test was used in order to confirm the best fit isotherm for the adsorption system combined with the values of the correlation coefficient. The chi square can be determined by eqn (12).
| |
 | (12) |
Where:
qe is the equilibrium capacity (mg g
−1) obtained from experimental data, and
qe,m is the equilibrium capacity obtained by calculating from the model (mg g
−1).
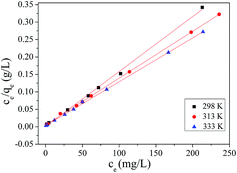
The data obtained for the models are presented in Table 3. Comparing the correlation coefficients of the analyzed isotherms, the high values for the correlation coefficient indicated that the experimental data are well correlated by the Langmuir model and the Q values are consistent with the experimental data. The comparison between experimental data and Langmuir adsorption isotherm for MB adsorption on MMT-PCN at 298, 313 and 333 K is presented in Fig. 8. The obtained values for RL parameter quite close to zero, indicating that the MB adsorption process on MMT-PCN is favorable, and it is a relatively irreversible reaction.38 Similar results were reported for the adsorption of MB on montmorillonite clay modified with iron oxide.41
Table 3 Isotherm parameters of adsorption of MB by MMT-PCN
| Parameters |
Langmuir |
Freundlich |
Temkin |
Dubinin–Radushkevich |
| 298 K |
313 K |
333 K |
298 K |
313 K |
333 K |
298 K |
313 K |
333 K |
298 K |
313 K |
333 K |
| KL (L L−1) |
0.230 |
0.258 |
0.389 |
— |
— |
— |
— |
— |
— |
— |
— |
— |
| Q (mg g−1) |
684.9 |
746.2 |
793.6 |
— |
— |
— |
— |
— |
— |
— |
— |
— |
| RL |
0.002–0.507 |
0.001–0.195 |
0.004–0.114 |
— |
— |
— |
— |
— |
— |
— |
— |
— |
| KF (L mg−1) |
— |
— |
— |
194.01 |
209.61 |
230.88 |
— |
— |
— |
— |
— |
— |
| n |
— |
— |
— |
4.679 |
4.234 |
4.210 |
— |
— |
— |
— |
— |
— |
| KT (L g−1) |
— |
— |
— |
— |
— |
— |
5.858 |
4.722 |
7.198 |
— |
— |
— |
| b (J mol−1) |
— |
— |
— |
— |
— |
— |
29.709 |
25.275 |
26.681 |
— |
— |
— |
| qd (g g−1) |
— |
— |
— |
— |
— |
— |
— |
— |
— |
0.69 |
0.735 |
0.777 |
| β*106 |
— |
— |
— |
— |
— |
— |
— |
— |
— |
0.045 |
0.042 |
0.034 |
| R2 |
0.998 |
0.999 |
0.999 |
0.965 |
0.960 |
0.977 |
0.942 |
0.914 |
0.940 |
0.935 |
0.921 |
0.945 |
| x2 |
1.262 |
0.598 |
1.61 |
29.62 |
16.43 |
27.99 |
22.55 |
50.92 |
44.08 |
34.625 |
55.526 |
38.464 |
 |
| | Fig. 8 Correlations between experimental data and Langmuir adsorption isotherm for MB biosorption on MMT-PCN (C0 from 300 to 1000 mg L−1; pH = 10; t = 80 min). | |
3.2.7. Adsorption mechanism. The maximum adsorption capacity (686.94 mg g−1) of MB onto the MMT-PCN is far higher than that of unactivated MMT-CN (456.39 mg g−1) and Na+-MMT (289.10 mg g−1) at the same adsorption conditions. The high adsorption capacity of MB onto the MMT-PCN could be explained as follows. Firstly, activated MMT-PCN materials contain abundant functional groups including C![[double bond, length as m-dash]](https://www.rsc.org/images/entities/char_e001.gif) O, –OH and C
O, –OH and C![[double bond, length as m-dash]](https://www.rsc.org/images/entities/char_e001.gif) C on its surface. It was previously reported that acidic groups such as carboxyl, lactonic, hydroxyl and carbonyl groups favor MB adsorption.45 Compared to untreated MMT, it presents a more extensive pore structure and higher BET surface area (589.30 m2 g−1). These factors are beneficial for the enhancement of adsorption capacity of MB. Second, MB, a cationic dye containing quaternary ammonium salt ([C16H18N3S]+, Cl−), is positively charged, which just met the ion-exchange adsorption.19 Also the MMT-PCN adsorbent is negatively charged (Fig. 9) and when the pH = 10, the absolute values of zeta potential is maximum. Third, the molecular dimension of MB is 1.63 nm × 0.56 nm × 0.54 nm33 and it can easily be adsorbed on the external surface and pores that are larger than its molecular size. Thus, the excellent adsorption capacity of MB onto the activated MMT-PCN is made possible due to its polarity and size.
C on its surface. It was previously reported that acidic groups such as carboxyl, lactonic, hydroxyl and carbonyl groups favor MB adsorption.45 Compared to untreated MMT, it presents a more extensive pore structure and higher BET surface area (589.30 m2 g−1). These factors are beneficial for the enhancement of adsorption capacity of MB. Second, MB, a cationic dye containing quaternary ammonium salt ([C16H18N3S]+, Cl−), is positively charged, which just met the ion-exchange adsorption.19 Also the MMT-PCN adsorbent is negatively charged (Fig. 9) and when the pH = 10, the absolute values of zeta potential is maximum. Third, the molecular dimension of MB is 1.63 nm × 0.56 nm × 0.54 nm33 and it can easily be adsorbed on the external surface and pores that are larger than its molecular size. Thus, the excellent adsorption capacity of MB onto the activated MMT-PCN is made possible due to its polarity and size.
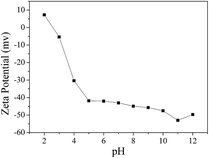 |
| | Fig. 9 Zeta potential of MMT-PCN. | |
3.3. Comparison of various adsorbents
Table 5 shows the comparison of the removal rate of the composite obtained in this work with different adsorbents previously used for removal of dyes. From Table 5, it is observed that the removal rate of MB onto MMT-PCN is relatively high compared to the adsorbents listed, indicating that MMT-PCN has great potential application in MB removal from aqueous solution. MMT-PCN takes advantage of many other adsorbents due to the low-cost of Na+-MMT (about $350 per ton) and glucose. Thus, the MMT-PCN is a promising material for the MB removal from aqueous solutions, as well as other cationic dyes.
Table 5 Comparison of the adsorption capacity (qe) of MB onto various adsorbents
| Adsorbents |
Remove rate (%) |
References |
| Palygorskite |
48.39 |
46 |
| MtMIO |
69.11 |
47 |
| Powdered activated carbon |
91 |
48 |
| Spent activated clay |
71.55 |
49 |
| Diatomite |
49.5 |
50 |
| Mt-SB12 |
86.92 |
51 |
| Porous MnO2 microspheres |
20.74 |
52 |
| Montmorillonite |
48.18 |
53 |
| MMT-PCN |
68.69 |
This work |
3.4. The reusability of MMT-PCN
The adsorbent reusability is extremely vital to estimate, which contributes to reduce the cost of practical applications process. Currently, most adsorbents show poor recyclability because of the difficulty for adsorbates desorbing from the surface of adsorbents. The colour of MMT-PCN is blue after adsorption experiments. In order to evaluate its reusability, the MMT-PCN adsorbents were vibrated by ultrasonic for 3 h and then were separated by centrifugation and washed repeatedly with ethanol and deionized water. During the washing process, the color of the samples gradually fades away until the blue disappear. Then the washed adsorbent was dried at 80 °C and used for the next experiment. The samples looks more loose than first synthesized in appearance.
Fig. 10 shows the reusability of MMT-PCN through five consecutive cycles with initial concentration (1000 mg L−1) of MB. As shown in the Fig. 10, after several consecutive cycles the adsorption capacity reduced in some degree compared with the samples synthesized for the first time. This change can be explained as follows: first, the structure of some MMT-PCN samples may be destroyed slightly during the process of desorption, which hinder the methylene blue molecules adsorption again. Second, MB molecules in the interlayer cannot be free completely by desorption. Lastly, free adsorption sites on the surface can not be occupied by other dye molecules due to the effect of repulsive force of the surface residual dye molecules. Although after several cycles, the adsorption capacity reduced, the sample showed a fairly ideal adsorption ability compared with the Na+-MMT, revealing its good recycling ability. Therefore, MMT-PCN materials are hopeful to be applied as a promising adsorbent for treatment of wastewater containing organic dyes.
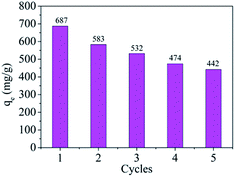 |
| | Fig. 10 The reusability of MMT-PCN on MB adsorption (C0 = 1000 mg L−1; T = 298 K; pH = 10; T = 80 min). | |
4. Conclusions
In this study, MMT-PCN was synthesised successfully by hydrothermal carbonization technique and chemical activation treatment with ZnCl2. The characterizations of MMT-PCN revealed that the MMT-PCN adsorbent possesses high surface area and large pore volume. Meanwhile, the removal of MB from waste water through adsorption onto MMT-PCN was studied to investigate the equilibrium, kinetics and thermodynamics of adsorption. The batch adsorption tests indicated that the MB adsorption onto MMT-PCN occurred through an endothermic and spontaneous process, which was described by the Langmuir model, indicating the formation of a monolayer of the dye. The adsorption of MB onto MMT-PCN was rapid and the kinetics was better described by the pseudo-second. In addition, the MMT-PCN adsorbent possessed excellent reusability. Consequently, these results indicate that the MMT-PCN shows promise for application in the removal of cationic dyes from industrial effluents.
References
- A. A. Jalil, S. Triwahyono, A. Hakimah Karim, N. K. Nordin, U. A. Asli, M. H. Hassim and D. Prasetyoko, RSC Adv., 2015, 281, 49–55 Search PubMed.
- C. Pablo, M. Fabiola, J. Carlos, L. Justo and R. Manuel, Environ. Sci. Technol., 2006, 40, 6418–6424 CrossRef.
- H. Pang, W. Q. Wang, Z. Z. Yan, H. Zhang, X. X. Li, J. Chen, J. S. Zhang and B. Zhang, RSC Adv., 2012, 2, 9614–9618 RSC.
- A. Yamuna, A. Mandalam, A. Karthigaiselvi, M. Balasubramanian, B. Thiruparasakthi, S. Ravichandran and S. Mayavan, RSC Adv., 2015, 5, 69394–69399 RSC.
- Y. H. Li, Q. J. Du, T. H. Liu, J. K. Sun, Y. H. Wang, S. L. Wu, Z. H. Wang, Y. Z. Xia and L. H. Xia, Carbohydr. Polym., 2013, 1, 501–507 CrossRef PubMed.
- T. Cai, Z. Yang, H. Li, H. Yang, A. Li and R. Cheng, Cellulose, 2013, 20, 2605–2614 CrossRef CAS.
- M. Auta and B. H. Hameed, Chem. Eng. J., 2014, 39, 352–361 CrossRef PubMed.
- Y. X. Huang, E. Ma and G. J. Zhao, RSC Adv., 2015, 5, 70287–70296 RSC.
- S. G. Muntean, O. P. S. Coseri, G. M. Simu, M. E. Grad and G. E. Ilia, J. Appl. Polym. Sci., 2013, 127, 4409 CrossRef CAS PubMed.
- C. J. Zhou, J. J. Luo, Q. Q. Chen, Y. Z. Jiang, X. P. Dong and F. M. Cui, Chem. Commun., 2015, 51, 10847–10849 RSC.
- F. Y. Yi, W. Zhu, S. Dang, J. P. Li, D. Wu, Y. H. Li and Z. M. Sun, Chem. Commun., 2015, 51, 3336–3339 RSC.
- X. Zhong, Z. Dai, F. Qin, J. Li, H. Yang, Z. Lu, Y. Liang and R. Chen, RSC Adv., 2015, 5, 69312–69318 RSC.
- D. Mahanta, G. Madras, S. Radhakrishnan and S. Patil, J. Phys. Chem. B, 2008, 112, 10153–10157 CrossRef CAS PubMed.
- V. K. Gupta and I. Ali, Environ. Sci. Technol., 2008, 42, 766–770 CrossRef CAS.
- J. N. Sahu, J. Acharya and B. C. Meikap, J. Hazard. Mater., 2009, 17, 818–825 CrossRef PubMed.
- K. J. Cronje, K. Chetty, M. Carsky, J. N. Sahu and B. C. Meikap, Desalination, 2011, 275, 276–284 CrossRef CAS PubMed.
- J. Acharya, J. N. Sahu, B. K. Sahoo, C. R. Mohanty and B. C. Meikap, Chem. Eng. J., 2009, 150, 25–39 CrossRef CAS PubMed.
- G. M. Walker and L. R. Weatherley, Chem. Eng. J., 2001, 83, 201–206 CrossRef CAS.
- M. Rafatullah, O. Sulaiman, R. Hashim and A. Ahmad, J. Hazard. Mater., 2010, 177, 70–80 CrossRef CAS PubMed.
- P. Pengthamkeerati, T. Satapanajaru and O. Singchan, J. Hazard. Mater., 2008, 153, 1149–1156 CrossRef CAS PubMed.
- E. Hoseinzadeh, M. Samarghandi, G. McKay, N. Rahimi and J. Jafari, Desalin. Water Treat., 2014, 52, 25–27 Search PubMed.
- S. G. Ghugal, S. S. Umare and R. Sasikala, RSC Adv., 2015, 5, 63393–63400 RSC.
- D. B. Nicole, S. R. Kyoung, M. Jingdong, R. V. F. Joseph, A. C. Mark and B. Sunyoung, Environ. Sci. Technol., 2011, 45, 5696–5703 CrossRef PubMed.
- P. X. Wu, Z. W. Liao, H. F. Zhang and J. G. Guo, Environ. Int., 2010, 26, 401–407 CrossRef.
- S. K. Behera, S. Y. Oh and H. K. Park, J. Hazard. Mater., 2010, 179, 684–691 CrossRef CAS PubMed.
- X. J. Cui, M. Antonietti and S. H. Yu, Small, 2006, 2, 756–759 CrossRef CAS PubMed.
- X. P. Wu, W. Y. Zhu, X. L. Zhang and T. H. Chen, Appl. Clay Sci., 2011, 52, 400–406 CrossRef CAS PubMed.
- T. Li, J. F. Shen, S. T. Huang, N. Li and M. X. Ye, Appl. Clay Sci., 2014, 93, 48–55 CrossRef PubMed.
- T. S. Wu, K. X. Wang, G. D. Li, S. Y. Sun, J. Sun and J. S. Chen, ACS Appl. Mater. Interfaces, 2010, 2, 544–550 CAS.
- M. X. Zhu, K. Y. Ding, S. H. Xu and X. Jiang, J. Hazard. Mater., 2009, 165, 645–651 CrossRef CAS PubMed.
- R. Zhang, C. L. Chen, J. Li and X. K. Wang, Appl. Surf. Sci., 2015, 349, 129–137 CrossRef CAS PubMed.
- L. Zhou, H. Chen, X. Jiang, F. Lu, Y. Zhou, W. Yin and X. Ji, J. Colloid Interface Sci., 2009, 332, 16–21 CrossRef CAS PubMed.
- X. L. Zhang, L. P. Cheng, X. P. Wu, Y. Z. Tang and Y. C. Wu, J. Environ. Sci., 2015, 33, 97–105 CrossRef PubMed.
- R. D. Cakan, N. K. Baccile, M. Antonietti and M. M. Titirici, Chem. Mater., 2009, 21, 484–490 CrossRef.
- H. S. Qian, S. H. Yu, L. B. Luo, J. Y. Gong and L. F. Fei, Chem. Mater., 2006, 18, 2102–2108 CrossRef CAS.
- P. Sharma, et al., J. Chem. Eng. Data, 2013, 58, 3477–3488 CrossRef CAS.
- S. G. Muntean, M. E. Radulescu-Grad and P. S. Arloaga, RSC Adv., 2014, 4, 27354–27362 RSC.
- O. M. Paska, C. Pacurariu and S. G. Muntean, RSC Adv., 2014, 4, 62621–62630 RSC.
- W. D. Craig, M. Dominic and T. Di, Environ. Sci. Technol., 2015, 49, 7810–7817 CrossRef PubMed.
- M. N. Shafqat and G. M. Pierzynski, Environ. Sci. Technol., 2014, 99, 72–80 CAS.
- L. Cottet, C. A. P. Almeida, N. Naidek, M. F. Viante, M. C. Lopes and N. A. Debacher, Appl. Clay Sci., 2014, 95, 25–31 CrossRef CAS PubMed.
- H. Chen, J. Zhao, J. Wu and G. Dai, J. Hazard. Mater., 2011, 192, 246–254 CAS.
- L. Ai, Y. Zhou and J. Jiang, Desalination, 2011, 266, 72–77 CrossRef CAS PubMed.
- L. Ai, L. Ming and L. Long, J. Chem. Eng. Data, 2011, 56, 3475–3483 CrossRef CAS.
- S. Altenor, B. Carene, E. Emmanuel, J. Lambert and J. J. Ehrhardt, J. Hazard. Mater., 2009, 165, 1029–1039 CrossRef CAS PubMed.
- H. Chen, J. Zhano, A. Zhong and B. Jin, Chem. Eng. J., 2011, 174, 143–150 CrossRef CAS PubMed.
- L. Cottet, C. A. P. Almeida, N. Naidek, M. F. Viante, M. C. Lopes and N. A. Debacher, Appl. Clay Sci., 2014, 95, 25–31 CrossRef CAS PubMed.
- J. Yener, T. Kopac, G. Dogu and T. Dogu, Chem. Eng. J., 2008, 144, 400–406 CrossRef CAS PubMed.
- C. H. Weng and Y. F. Pan, J. Hazard. Mater., 2007, 144, 355–362 CrossRef CAS PubMed.
- M. A. AlGhouti, M. A. M. Khraisheh, S. J. Allen and M. N. Ahmad, J. Environ. Manage., 2003, 69, 229–238 CrossRef CAS PubMed.
- H. W. Fan, L. M. Zhou, X. H. Jiang, Q. Huang and W. C. Lang, Appl. Clay Sci., 2014, 95, 150–158 CrossRef CAS PubMed.
- R. X. Chen, J. G. Yu and W. Xiao, J. Mater. Chem. A, 2013, 38, 11682–11690 Search PubMed.
- C. A. P. Almeida, N. A. Debacher, A. J. Downs, L. Cottet and C. A. D. Mello, J. Colloid Interface Sci., 2009, 332, 46–53 CrossRef CAS PubMed.
|
| This journal is © The Royal Society of Chemistry 2015 |
Click here to see how this site uses Cookies. View our privacy policy here. 


![[thin space (1/6-em)]](https://www.rsc.org/images/entities/char_2009.gif) 700, 1000 mg L−1) with 40 mg adsorbent. The amount of adsorbed dye increased from 370 to 684 mg g−1 with the increase in the initial dye concentration from 400 to 1000 mg L−1. As depicted in Fig. 6, the results indicated that the dye removal is concentration dependent. The adsorption capacity of MB increases with increasing the MB concentration. This may be attributed to the extent of a driving force of concentration gradients with the increase in the MB concentration.
700, 1000 mg L−1) with 40 mg adsorbent. The amount of adsorbed dye increased from 370 to 684 mg g−1 with the increase in the initial dye concentration from 400 to 1000 mg L−1. As depicted in Fig. 6, the results indicated that the dye removal is concentration dependent. The adsorption capacity of MB increases with increasing the MB concentration. This may be attributed to the extent of a driving force of concentration gradients with the increase in the MB concentration.


![[thin space (1/6-em)]](https://www.rsc.org/images/entities/char_2009.gif) qe = ln
qe = ln![[thin space (1/6-em)]](https://www.rsc.org/images/entities/char_2009.gif) qd − βε2
qd − βε2


![[thin space (1/6-em)]](https://www.rsc.org/images/entities/char_2009.gif) ln
ln![[thin space (1/6-em)]](https://www.rsc.org/images/entities/char_2009.gif) Kd
Kd
![[double bond, length as m-dash]](https://www.rsc.org/images/entities/char_e001.gif) O, –OH and C
O, –OH and C![[double bond, length as m-dash]](https://www.rsc.org/images/entities/char_e001.gif) C on its surface. It was previously reported that acidic groups such as carboxyl, lactonic, hydroxyl and carbonyl groups favor MB adsorption.45 Compared to untreated MMT, it presents a more extensive pore structure and higher BET surface area (589.30 m2 g−1). These factors are beneficial for the enhancement of adsorption capacity of MB. Second, MB, a cationic dye containing quaternary ammonium salt ([C16H18N3S]+, Cl−), is positively charged, which just met the ion-exchange adsorption.19 Also the MMT-PCN adsorbent is negatively charged (Fig. 9) and when the pH = 10, the absolute values of zeta potential is maximum. Third, the molecular dimension of MB is 1.63 nm × 0.56 nm × 0.54 nm33 and it can easily be adsorbed on the external surface and pores that are larger than its molecular size. Thus, the excellent adsorption capacity of MB onto the activated MMT-PCN is made possible due to its polarity and size.
C on its surface. It was previously reported that acidic groups such as carboxyl, lactonic, hydroxyl and carbonyl groups favor MB adsorption.45 Compared to untreated MMT, it presents a more extensive pore structure and higher BET surface area (589.30 m2 g−1). These factors are beneficial for the enhancement of adsorption capacity of MB. Second, MB, a cationic dye containing quaternary ammonium salt ([C16H18N3S]+, Cl−), is positively charged, which just met the ion-exchange adsorption.19 Also the MMT-PCN adsorbent is negatively charged (Fig. 9) and when the pH = 10, the absolute values of zeta potential is maximum. Third, the molecular dimension of MB is 1.63 nm × 0.56 nm × 0.54 nm33 and it can easily be adsorbed on the external surface and pores that are larger than its molecular size. Thus, the excellent adsorption capacity of MB onto the activated MMT-PCN is made possible due to its polarity and size.


