Significantly enhanced dielectric properties and energy storage density for high-k cyanate ester nanocomposites through building good dispersion of pristine carbon nanotubes in a matrix based on in situ non-covalent interaction with phenolphthalein poly(ether sulfone)†
Lin Zhao,
Li Yuan,
Guozheng Liang* and
Aijuan Gu*
Jiangsu Key Laboratory of Advanced Functional Polymer Design and Application, Department of Materials Science and Engineering, College of Chemistry, Chemical Engineering and Materials Science, Soochow University, Suzhou, China. E-mail: ajgu@suda.edu.cn; lgzheng@suda.edu.cn; Fax: +86 51265880089; Tel: +86 51265880967
First published on 19th October 2015
Abstract
How to disperse pristine carbon nanotubes with non-covalent interaction for fabricating high-k polymer nanocomposites with low dielectric loss and high energy storage density (We) is still a big but interesting challenge. Herein, a fully compatible and transparent polymer blend consisting of phenolphthalein poly(ether sulfone) (cPES) and cyanate ester (CE) was specially designed as the resin matrix, and then new conductor/polymer composites based on multi-walled carbon nanotubes (MWCNTs) and CE/cPES were facilely prepared through melting blending. The structure, dielectric properties and We values of MWCNT/CE and MWCNT/CE/cPES composites were systematically studied. Compared with MWCNT/CE composites, MWCNT/CE/cPES composites have a much lower percolation threshold that is as low as 0.89 wt%, only about 0.25 times of that of MWCNT/CE composites; besides, MWCNT/CE/cPES composites possess greatly improved dielectric constants, much larger breakdown strength and We as well as greatly decreased dielectric loss. The origin of these desirable properties was discussed through investigating the structure and building equivalent circuits. Results show that an in situ non-covalent interaction is formed between MWCNTs and cPES during the melting blending process, while cPES is compatible with CE resin, so MWCNTs have excellent dispersion in the CE/cPES matrix, endowing MWCNT/CE/cPES composites with unique structure and desirable dielectric properties.
1. Introduction
Owing to their outstanding properties of uniform electric field1,2 and other attractive advantages such as light weight, high specific strength and easy processing,3–5 etc., high-k conductor/polymer nanocomposites (hi-k CPNC) have been a class of rapidly developing functional materials, showing great potential in many cutting-edge fields including microelectronics,6 electrical engineering,7 biotechnology,8,9 aeronautics and astronautics,10,11 and so on.Many studies have confirmed that the appearance of a high dielectric constant in conductor/polymer nanocomposites results from the insulator–conductor transition, known as the percolation effect;12 however, simultaneously, a sudden increase of dielectric loss also occurs,13–15 and this will not only cause the dissipation of energy, but also shorten the service life and operational reliability of a material.16
On the other hand, breakdown strength and energy storage density are two important indexes to assess the practical performance of high-k materials in applications. It has been found that the addition of conductors into a polymer tends to reduce the breakdown strength along with a jump in permittivity.17,18 Therefore, besides the large dielectric loss, low breakdown strength is another side effect for hi-k CPNC, and these two disadvantages have been bottlenecks hindering the application of hi-k CPNC.
To date, lots of research has been carried out to overcome the above bottlenecks with hi-k CPNC. Results show that improving the dispersion of inorganic nano-conductors in the matrix and/or forming a coating on conductors to avoid any contact between conductors are two effective methods of reducing dielectric loss.19–21 Two strategies, divided into covalent and non-covalent modifications, have been used to improve the dispersion of nano-conductors in the polymer matrix.22 Of these, the non-covalent modification shows obvious merit in fabricating hi-k CPNC23 because it is generally achieved by forming a coating through the π–π stacking or van der Waals force24 without degrading the structure and excellent electric properties of the conductors.
However, there are some basic issues and drawbacks that need to be addressed. (1) The presence of the coating causes some difficulty in forming a conductive path between conductors, and thus increases the percolation threshold (fc);21 this tends to increase the processing difficulty and reduce the mechanical performance of the composites. (2) It is worth noting that almost all non-covalent coatings of conductors reported up to date are polymers with π bonds, such as polyaniline, polypyrrole and so on, but these polymers usually have poorer thermal resistance than the polymer matrix for hi-k CPNC. For example, the initial decomposition temperature (Tdi) and the glass transition temperature (Tg) of polyaniline are only about 282 °C![[thin space (1/6-em)]](https://www.rsc.org/images/entities/char_2009.gif) 25 and 204 °C,26 respectively. (3) Although the non-covalent strategy does not involve a chemical reaction of the conductors, solvent is generally needed during the coating formation;27 moreover, to improve the dispersion of conductors in the resin matrix, it is necessary to graft active groups on to the coating materials;28 in other words, actually, it seems very difficult to completely avoid chemical reactions in the non-covalent strategy. Therefore, how to disperse pristine nano-conductors through true non-covalent interactions for fabricating hi-k CPNC with low dielectric loss and high energy storage density is still an interesting but big challenge.
25 and 204 °C,26 respectively. (3) Although the non-covalent strategy does not involve a chemical reaction of the conductors, solvent is generally needed during the coating formation;27 moreover, to improve the dispersion of conductors in the resin matrix, it is necessary to graft active groups on to the coating materials;28 in other words, actually, it seems very difficult to completely avoid chemical reactions in the non-covalent strategy. Therefore, how to disperse pristine nano-conductors through true non-covalent interactions for fabricating hi-k CPNC with low dielectric loss and high energy storage density is still an interesting but big challenge.
The aim of our project reported herein is to make progress on this challenge. Multi-walled carbon nanotubes (MWCNTs), a representative carbon-based nanomaterial, were selected as the nano-conductors owing to their outstanding electric and other integrated properties.29 A completely compatible and transparent polymer blend consisting of phenolphthalein poly(ether sulfone) (cPES) and cyanate ester (CE) (w/w = 10/90) was specially designed to be the resin matrix. Then new hi-k CPNCs, MWCNT/CE/cPES composites with different loadings of MWCNTs, were prepared. In addition, the dielectric properties, breakdown strengths and energy storage densities of the MWCNT/CE/cPES composites were systematically investigated. Based on this research, a new method is created to develop high performance hi-k CPNC by simply and effectively controlling the dispersion of pristine MWCNTs in the matrix through a completely non-covalent interaction, and the origin behind this is discussed in depth.
2. Experimental
2.1 Materials
The CE used herein was 2,2′-bis(4-cyanatophenyl) propane, which was purchased from Yangzhou Techchia New Material Ltd, China. cPES with a molecular weight of 26![[thin space (1/6-em)]](https://www.rsc.org/images/entities/char_2009.gif) 000 and a reduced viscosity (ηsp/c) of 0.5 was supplied by Xuzhou Engineering Plastics Co., Xuzhou, China. MWCNTs with a purity of more than 95% (the average outer diameter = 8–15 nm, length < 50 μm) were bought from Chengdu Organic Chemicals Co. Ltd., Chinese Academy of Sciences, China. N,N-Dimethylformamide (DMF) was a commercial product and used as received.
000 and a reduced viscosity (ηsp/c) of 0.5 was supplied by Xuzhou Engineering Plastics Co., Xuzhou, China. MWCNTs with a purity of more than 95% (the average outer diameter = 8–15 nm, length < 50 μm) were bought from Chengdu Organic Chemicals Co. Ltd., Chinese Academy of Sciences, China. N,N-Dimethylformamide (DMF) was a commercial product and used as received.
2.2 Preparation of cPES/MWCNT hybrid
cPES or MWCNTs were dissolved in an appropriate amount of DMF with vigorous stirring under sonication for 10 min to obtain a homogeneous dispersion. Then the two solutions were mixed with vigorous stirring under sonication for 20 min to get a mixture. The mixture was poured into excess methanol to get a precipitate, followed by washing and filtration three times to give a crude product. The crude product was dried in a vacuum oven at 50 °C for 6 h to obtain a hybrid, coded as cPES/MWCNT.2.3 Preparation of MWCNT/CE/cPES composites
Appropriate amounts of CE and MWCNTs were blended at 85 °C for 20 min with thorough stirring under sonication to get a mixture, which was then heated to 150 °C and maintained at that temperature with vigorous stirring for 1.5 h. After that cPES of which the quantity was 10 wt% of CE was added into the mixture and maintained at 150 °C with stirring for additional 30 min to give a MWCNT/CE/cPES prepolymer. The prepolymer was poured into a preheated mold and degassed under vacuum at 150 °C for 1 h, followed by putting into an oven for curing and postcuring using the procedures 150 °C/2 h + 180 °C/2 h + 200 °C/2 h + 220 °C/2 h, and 240 °C/4 h, successively. The cured composites were coded as xMWCNT/CE/cPES, where x was the mass percentage of MWCNTs in the whole composite, taking values of 0.1, 0.2, 0.3, 0.4, 0.5, 0.6, 0.7, 0.8 and 0.9.2.4 Preparation of MWCNT/CE composites
CE and MWCNTs were blended at 85 °C for 20 min with thorough stirring under sonication to get a mixture. The mixture was then heated to 150 °C and maintained at that temperature with vigorous stirring for 2 h to obtain a MWCNT/CE prepolymer. After that the prepolymer was treated using the same procedure for preparing MWCNT/CE/cPES composites. The resultant composite was coded as xMWCNT/CE, where x was the mass percentage of MWCNTs in the whole composite.2.5 Characterization
Raman spectra were obtained using an Almega Dispersive Raman (HR800, Horiba Jobin Yvon, Japan) with an He–Ne laser (633 nm) at room temperature. The slit width was 100 μm and the confocal hole was 400 μm.The X-ray diffraction (XRD) patterns were acquired using a Rigaku D/Max diffractometer with Cu-Ka radiation (λ = 0.154 nm) (Rigaku Co. Ltd., Tokyo, Japan), and the diffraction angle (2θ) ranged from 5° to 80°. The scanning rate was 2° min−1.
A Ruili 1100 spectrophotometer (Cary 50, America) was used to record the UV-vis spectra (200–800 nm) of the samples to obtain their absorbance.
Fourier transform infrared (FTIR) spectra were recorded on a Nicolet-5700 spectrometer (USA) in the region of 4000–400 cm−1 with a resolution of 2 cm−1 using the transmission mode. Each sample was blended and pressed into a KBr pellet.
Fluorescence spectra of the solid powders were recorded on a Hitachi F-2500 spectrometer (Japan). The excitation wavelength was selected as 374 nm.
A scanning electron microscope (Hitachi S-4700, Japan) was employed to observe the morphologies of cPES, MWCNTs, cPES/MWCNT hybrids and the fractured surfaces of MWCNT/CE and MWCNT/CE/cPES composites.
Dynamic mechanical analysis (DMA) was performed in a single-cantilever blending mode using TA DMA Q800 (USA) apparatus from 30 to 350 °C at a heating rate of 5 °C min−1 and a frequency of 1 Hz. The dimensions of each sample were (35 ± 0.02) × (13 ± 0.02) × (3 ± 0.02) mm3.
Electric and dielectric properties were measured on a broadband dielectrics spectrometer (Novocontrol Concept 80, Hundsangen, Germany) at room temperature over the frequency from 1 to 106 Hz. The dimensions of each sample were (25 ± 0.02) × (25 ± 0.02) × (3 ± 0.02) mm3.
The breakdown strengths of CE resin, MWCNT/CE and MWCNT/CE/cPES composites were measured using a breakdown strength tester (HT-50c, Guilin Electric Research Institute, China) in a voltage ramp rate of 1000 V s−1. The dimensions of each sample were (100 ± 0.02) × (100 ± 0.02) × (1 ± 0.02) mm3.
3. Results and discussion
3.1 The interaction between cPES and MWCNTs
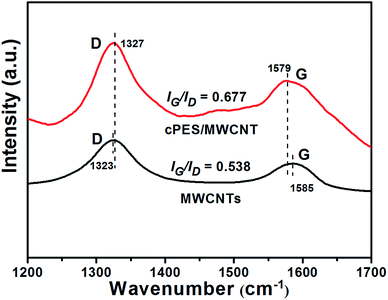
As electron-rich molecules, MWCNTs are well known to have delocalized π-electron clouds, and thus form a big π-conjugated system.30 Therefore, when electron-rich molecules meet MWCNTs, the former would form a coating on the surface of the MWCNTs through π–π interaction. As the cPES molecule has many benzene rings and unsaturated double bonds, so cPES is expected to have a strong π–π interaction with MWCNTs.Many techniques have been used to detect the π–π interaction between two materials, including Raman,31 SEM,32 XRD,33 FTIR,34 UV-vis35 and fluorescence spectra,36 and all of them have been used to characterize the interaction between cPES and MWCNTs. Fig. 1 shows the Raman spectra of MWCNTs and a cPES/MWCNT hybrid. The peaks at 1585 and 1323 cm−1 in the spectrum of the MWCNTs reflect the typical G-band and D-band,37 respectively. These peaks also appear in the spectrum of the cPES/MWCNT hybrid; however the G band peak has a shift of 6 cm−1 to lower wavenumber, demonstrating that there is a π–π interaction between cPES and MWCNTs, which is ascribed to the electron-rich molecule (electron-donor) of cPES. Meanwhile, the peak of D band has a shift to higher wavenumber, indicating that MWCNTs in cPES have better dispersion than MWCNTs themselves, or in other words, the presence of cPES overcomes the aggregation of MWCNTs. This conclusion will be directly proved by observing the SEM images of MWCNTs and cPES/MWCNT hybrid as shown in Fig. 2.
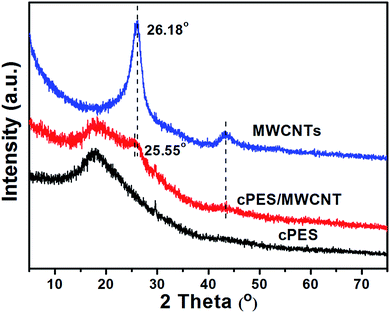
On the other hand, Fig. 1 shows that the cPES/MWCNT hybrid also exhibits a higher intensity ratio of the G-band to the D-band (IG/ID) than MWCNTs. The following two reasons are responsible for this result. First, there is no chemical reaction between cPES and MWCNTs, so the ID value of the hybridized MWCNTs does not change. Second, due to the π–π interaction between the great delocalized π-electron space of MWCNTs and the conjugated structure of cPES, IG will be strengthened, and thus the IG/ID value increases.38 This conclusion will be further confirmed by the XRD patterns of the MWCNTs and cPES/MWCNT hybrid, as shown in Fig. 3. The diffraction peaks corresponding to the (002) and (100) Bragg reflection planes of the MWCNTs appear in the patterns of both MWCNTs and cPES/MWCNT hybrid, but the hybridization with cPES weakens the intensities of both peaks, and shifts the peak assigned to the (002) Bragg reflection plane from 26.18° to 25.55°. These phenomena demonstrate that the hybridization with cPES not only improves the dispersion of MWCNTs,39 but also destroys the concentric cylindrical ordered structure of MWCNTs, that is, there is π–π interaction between cPES and MWCNTs.
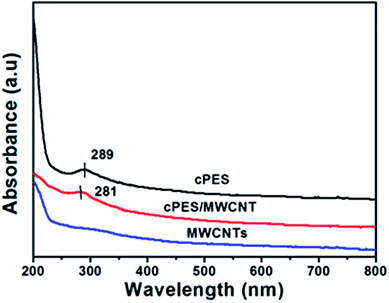
Fig. 4 gives the UV-vis spectra of the suspensions of cPES, MWCNTs, cPES/MWCNT hybrid in water. An apparent UV absorption peak appears at 289 nm in the spectrum of cPES, but this peak becomes weaker and shifts toward 281 nm in the spectrum of the cPES/MWCNT hybrid. A similar phenomenon was reported in the other MWCNT/polymer hybrid, and was considered to result from the π–π interaction between MWCNTs and the polymer.40
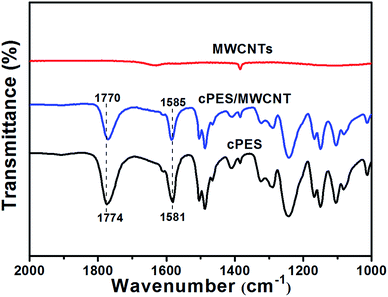
The shift belonging to the characteristic peak of cPES is also found in the FTIR spectra. As shown in Fig. 5, the peaks attributed to the stretching vibrations of the carbonyl group (1774 cm−1) and the benzene ring (1581 cm−1) in the FTIR spectrum of cPES shift toward 1770 cm−1 and 1585 cm−1, respectively, in the FTIR spectra of the cPES/MWCNT hybrid. Since the resolution of the FTIR spectrometer is 2 cm−1, a shift that is bigger than 2 cm−1 is considered to be meaningful.33 This shift of the stretching vibration peak is believed to arise from the delocalization of the carbonyl electrons and π electrons in the benzene ring to the π-clouds of MWCNTs;33,40 in other words, there is favorable π–π interaction between cPES and MWCNTs.
The fluorescence spectra are usually considered as more direct evidence for the existence of a π–π interaction between two materials.36 As shown in Fig. 6, the maximum emissions of cPES and cPES/MWCNT appear at 393 and 383 nm, respectively. Besides, the fluorescence intensity of the cPES/MWCNT hybrid decreases significantly, demonstrating that the fluorescence intensity of cPES can be effectively quenched by MWCNTs. A similar phenomenon was also reported in other materials containing MWCNTs and aromatic compounds,34,40 and has been generally attributed to the efficient energy transfer of excitation through the π–π interaction.40
The above six characterization techniques have fully proved that there exists a π–π interaction between cPES and MWCNTs.
3.2 The influence of cPES on the morphology of composites
The CE/cPES blend prepared herein has a uniform morphology with good transparency, and no phase separation in the matrix was observed as shown in Fig. 7a. The good compatibility between CE and cPES can be also confirmed by the single peak from the DMA test (Fig. 7b). | ||
| Fig. 7 Digital photo and SEM pictures (a), the loss factor–temperature plot from DMA test (b) of the CE/cPES blend. | ||
Fig. 8 gives the SEM images of the fracture surfaces of MWCNT/CE and MWCNT/CE/cPES composites. No phase separation of the matrix was observed in the MWCNT/CE/cPES composites. The great difference between MWCNT/CE and MWCNT/CE/cPES composites is the distribution of MWCNTs in their corresponding matrix. Specifically, MWCNT aggregates are found in the MWCNT/CE composites, and this phenomenon is enhanced as the content of MWCNTs (f) increases. This is expected due to the poor compatibility between the inorganic and organic phases. However, attractively, with the incorporation of cPES, no obvious MWCNT aggregation is observed, and instead, MWCNTs have very good dispersion in the matrix; the f value is even as high as 0.9 wt%. Obviously, this desirable change is attributed to the good compatibility between CE and cPES as well as the interaction between MWCNTs and cPES as proved in the first part of this paper.
Note that the MWCNT/CE/cPES composites were prepared through a two-step melting blending. In the first step, CE was blended with MWCNTs and then pre-polymerized for a certain length of time. The remarkably different polarity between the CE resin and MWCNTs and the inert nature of the surfaces of MWCNTs determine the aggregation state of MWCNTs in the CE resin (Fig. 9a). In the second step, cPES was added into the CE/MWCNT prepolymer (Fig. 9b); the large bundles of MWCNTs gradually become smaller ones and even single tubes due to the π–π interaction between cPES and MWCNTs (Fig. 9c) as proved above; meanwhile, cPES has very good compatibility with the CE resin (Fig. 7). As a result, the dissociated MWCNTs disperse homogeneously in the CE resin together with cPES (Fig. 9b).
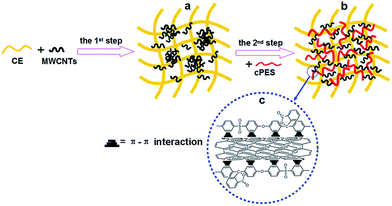 | ||
| Fig. 9 Scheme of the microstructure change during the preparation process of MWCNT/CE/cPES composites. | ||
3.3 The influence of cPES on electric and dielectric behaviors of composites
| σ ∝ (fc − f)−s for fc > f | (1) |
With a least-square fit of the AC conductivities (at 1 Hz) of the composites for repeated experiments as shown in the insert plot of Fig. 10c and d, the fc values of MWCNT/CE and MWCNT/CE/cPES composites are 3.59 wt% and 0.89 wt%, respectively. The latter is only 0.25 times of the former, illustrating that a percolation phenomenon appears with a much lower f in MWCNT/CE/cPES composites, showing a favorable manufacturability. This interesting result is ascribed to the remarkably improved dispersion of MWCNTs with the existence of cPES. Specifically, the dispersion of the intrinsic MWCNTs is greatly improved through the in situ π–π interaction between cPES and MWCNTs during the process of preparation; moreover, cPES is compatible with CE resin and acts as a compatibilizer in the whole system. As a result, MWCNTs have excellent dispersion in the resin matrix. Additionally, no extra insulating layer was coated on the surface of MWCNTs in advance, and thus the excellent electrical conductivity of MWCNTs is maintained, guaranteeing the low fc of MWCNT/CE/cPES composites.
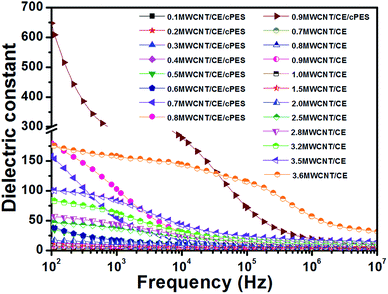 | ||
| Fig. 11 Dependence of dielectric constant on frequency of MWCNT/CE and MWCNT/CE/cPES composites at room temperature. | ||
In order to find out whether there are other reasons for the high dielectric constant, the frequency dependence of capacitance of the MWCNT/CE/cPES and MWCNT/CE composites were also recorded. As shown in Fig. 12, under the same frequency, MWCNT/CE/cPES composites have about two orders of magnitude higher capacitance than MWCNT/CE composites with the same f value, clearly suggesting that the former has more micro-capacitors. This is expected owing to the homogeneous dispersion of MWCNTs in MWCNT/CE/cPES composites, and obviously, more capacitors are expected to give a high dielectric constant.
 | ||
| Fig. 12 Dependence of capacitance on frequency of MWCNT/CE and MWCNT/CE/cPES composites at room temperature. | ||
Fig. 13 presents the dependence of dielectric loss on frequency at room temperature of MWCNT/CE and MWCNT/CE/cPES composites. Similar to the typical conductor/polymer composites, the dielectric loss gradually increases with the increase of f. Interestingly, the dielectric loss of MWCNT/CE/cPES composites still remains at a low level after the appearance of the percolation phenomenon. When f nears fc, the dielectric loss of 0.9MWCNT/CE/cPES composites at 100 Hz is 4.1, only 0.17 times that of the MWCNT/CE composites. The significantly deceased dielectric loss is also attributed to the special spatial structure in MWCNT/CE/cPES composites.
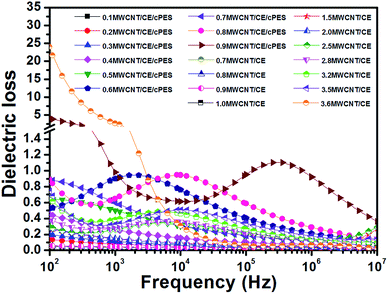 | ||
| Fig. 13 Dependence of dielectric loss on frequency of MWCNT/CE and MWCNT/CE/cPES composites at room temperature. | ||
Note that comparing the above results of MWCNT/CE/cPES composites with those of other similar materials in developing hi-k CPNC using other techniques summarized in Table S1 in the ESI,† it can be found that MWCNT/CE/cPES composites have advantages in simultaneously exhibiting a high dielectric constant, low dielectric loss and low fc.
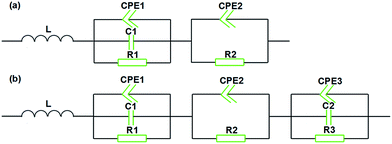
The equivalent circuit for MWCNT/CE composites (Fig. 14a) consists of parallel circuits in series; one of them contains a constant phase element (CPE1), a capacitance (C1) and a resistance (R1), and the other has a constant phase element (CPE2) and a resistance (R2). In addition, an inductance is also needed in series in the circuit because of the large length/diameter ratio and the coil structures of MWCNTs.42,43
In order to get the best fitting results, CPE is defined as:44
 | (2) |
 | (3) |
Comparatively, the equivalent circuit of MWCNT/CE/cPES composites (Fig. 14b) has an additional parallel circuit, containing a constant phase element (CPE3), a capacitance (C2) and a resistance (R3), and this is attributed to the enhanced dispersion of MWCNTs in the resin matrix induced by the addition of cPES.
Fig. S1† shows the impedance spectra and the simulated curves of MWCNT/CE and MWCNT/CE/cPES composites according to the equivalent circuits. It can be observed that the Nyquist diagram gradually changes from a straight line to a semicircle as the content of MWCNTs increases, indicating the formation of a conductive network and the transformation from insulator to conductor of the composites. Tables 1 and 2 give the corresponding parameters and calculation results of equivalent circuits for MWCNT/CE and MWCNT/CE/cPES composites, respectively. The total value of resistances (Rt) and that of capacitances (Ct) can be severally used to evaluate the electrical conductivity and dielectric constant of the composites. It is clearly seen that as the f value increases, the Rt value of either MWCNT/CE or MWCNT/CE/cPES composite shows a decreasing trend, suggesting an increase in conductivity. This result is in good agreement with the changing trend of the AC conductivity (Fig. 10) described above. Meanwhile, the Ct value of each MWCNT/CE composite is of the order of 10−11 F, and slightly increases with the increase in f. It is noted that the Ct value of the MWCNT/CE/cPES composite with 0.2 wt% is larger than the corresponding values of all binary composites and gradually increases to about 4 × 10⁻¹⁰ F, demonstrating that the quantity of micro-capacitors of the composites has been dramatically increased. This attractive result is in accordance with the measured values of the capacitance shown in Fig. 12, reflecting the reason for the enhancement of the dielectric constant in the ternary composites.
| f (wt%) | 1.0 | 1.5 | 2.0 | 2.5 | 2.8 | 3.2 | 3.5 | 3.6 |
|---|---|---|---|---|---|---|---|---|
| L (H) | 1.109 × 10⁻¹² | 3.265 × 10⁻²⁰ | 6.772 × 10⁻⁶ | 1 × 10⁻²⁰ | 1.596 × 10⁻¹⁴ | 7.249 × 10⁻⁹ | 4.708 × 10⁻⁷ | 1.811 × 10⁻¹⁵ |
| CP1 (F) | 2.326 × 10⁻¹¹ | 6.710 × 10⁻¹¹ | 7.360 × 10⁻¹¹ | 1.238 × 10⁻⁹ | 3.951 × 10⁻¹⁰ | 9.492 × 10⁻¹⁰ | 2.689 × 10⁻⁹ | 2.868 × 10⁻⁶ |
| n1 | 0.6308 | 0.5560 | 0.6671 | 0.5056 | 0.4077 | 0.6486 | 0.6088 | 0.2993 |
| C1 (F) | 1.304 × 10⁻¹¹ | 1.07 × 10⁻¹¹ | 1.723 × 10⁻¹¹ | 3.228 × 10⁻¹¹ | 3.04 × 10⁻¹¹ | 1.924 × 10⁻¹¹ | 1.163 × 10⁻¹¹ | 3.297 × 10⁻¹¹ |
| R1 (Ω) | 4.488 × 10²⁰ | 1.513 × 10⁹ | 5.538 × 10⁸ | 1.002 × 10⁸ | 1.197 × 10⁹ | 2.749 × 10⁶ | 5.751 × 10⁵ | 3504 |
| CP2 (F) | 2.489 × 10⁻¹¹ | 1.31 × 10⁻¹⁰ | 1.063 × 10⁻¹⁰ | 2.627 × 10⁻¹¹ | 6.359 × 10⁻¹¹ | 9.177 × 10⁻¹¹ | 9.572 × 10⁻¹¹ | 2.656 × 10⁻¹⁰ |
| n2 | 0.8727 | 0.8961 | 1 | 0.9053 | 0.8901 | 0.9459 | 0.9638 | 0.9387 |
| R2 | 4.314 × 10⁹ | 1.001 × 10¹⁶ | 8.802 × 10¹² | 9.286 × 10¹⁰ | 5.283 × 10⁷ | 2.141 × 10⁸ | 3.158 × 10⁷ | 4.147 × 10⁴ |
| Rt (Ω) | 4.49 × 10²⁰ | 1.00 × 10¹⁶ | 8.80 × 10¹² | 9.30 × 10¹⁰ | 1.25 × 10⁹ | 2.17 × 10⁸ | 3.22 × 10⁷ | 4.49 × 10⁴ |
| Ct (F) | 1.80 × 10⁻¹¹ | 2.08 × 10⁻¹¹ | 2.46 × 10⁻¹¹ | 2.51 × 10⁻¹¹ | 2.64 × 10⁻¹¹ | 3.16 × 10⁻¹¹ | 3.21 × 10⁻¹¹ | 5.36 × 10⁻¹¹ |
| f (wt%) | 0.1 | 0.2 | 0.3 | 0.4 | 0.5 | 0.6 | 0.7 | 0.8 | 0.9 |
|---|---|---|---|---|---|---|---|---|---|
| L (H) | 6.94 × 10⁻²⁰ | 7.314 × 10⁻¹⁴ | 6.704 × 10⁻¹⁶ | 7.289 × 10⁻²⁰ | 6.734 × 10⁻¹² | 4.247 × 10⁻¹⁶ | 1.26 × 10⁻²¹ | 1.018 × 10⁻²¹ | 3.425 × 10⁻⁹ |
| CP1 (F) | 3.627 × 10⁻¹³ | 1.001 × 10²⁰ | 0.05602 | 0.0004105 | 7.052 × 10⁻¹⁰ | 4.018 × 10⁻⁹ | 7.96 × 10⁻¹⁰ | 6.243 × 10⁻¹⁰ | 3.221 × 10⁻⁸ |
| n1 | 0.3601 | 0.008086 | 0.3188 | 1.026 × 10⁻⁵ | 0.5945 | 0.0627 | 0.6664 | 0.7014 | 0.3638 |
| C1 (F) | 5.628 × 10⁻¹¹ | 0.001582 | 3.307 × 10⁻⁷ | 7.16 × 10⁻¹¹ | 1.666 × 10⁻¹⁰ | 2.603 × 10⁻¹⁰ | 3.201 × 10⁻¹⁰ | 1.37 × 10⁻¹⁰ | 8.552 × 10⁻⁹ |
| R1 (Ω) | 1793 | 2.16 × 10⁴ | 9.179 × 10⁴ | 9.7 × 10⁶ | 3.395 × 10⁷ | 9.974 × 10²⁰ | 1.295 × 10⁻⁸ | 5.236 × 10⁸ | 2.664 × 10⁵ |
| CP2 (F) | 4.848 × 10⁻¹¹ | 6.659 × 10⁻¹¹ | 2.839 × 10⁻¹⁰ | 5.323 × 10⁻¹⁰ | 1.888 × 10⁻¹⁰ | 1.907 × 10⁹ | 6.939 × 10⁻¹⁰ | 5.66 × 10⁻¹⁰ | 8.931 × 10⁻¹⁰ |
| n2 | 0.8921 | 0.8937 | 0.9518 | 0.9753 | 0.8435 | 8.347 × 10⁻⁸ | 1 | 0.994 | 0.9471 |
| R2 (Ω) | 1 × 10²⁰ | 5.971 × 10⁹ | 3.829 × 10¹⁵ | 8.65 × 10⁸ | 9.293 × 10¹⁰ | 9.976 × 10²⁰ | 2286 | 2100 | 5574.7 |
| CP3 (F) | 0.5818 | 3.134 × 10⁻¹¹ | 7.917 × 10⁻¹¹ | 1.775 × 10⁻¹⁰ | 7.595 × 10⁻¹⁰ | 5.279 × 10⁻¹⁰ | 4.941 × 10⁻⁹ | 1.689 × 10⁻⁸ | 1.583 × 10⁻⁶ |
| n3 | 0.8013 | 0.6182 | 0.5993 | 0.6139 | 0.7904 | 0.6601 | 0.8263 | 0.4442 | 0.2964 |
| C2 (F) | 8.007 × 10⁻¹⁵ | 9.537 × 10⁻¹² | 1.212 × 10⁻¹¹ | 6.992 × 10⁻¹² | 2.341 × 10⁻⁵ | 2.515 × 10⁻¹⁰ | 7.018 × 10⁻¹² | 7.979 × 10⁻⁹ | 4.461 × 10⁻⁹ |
| R3 (Ω) | 151.4 | 8.59 × 10¹⁸ | 7.513 × 10⁹ | 8.662 × 10¹¹ | 0.01 | 2.193 × 10⁷ | 2.42 × 10⁸ | 8.141 × 10⁵ | 3.987 × 10⁴ |
| Rt (Ω) | 1 × 10²⁰ | 8.59 × 10¹⁸ | 3.83 × 10¹⁵ | 8.67 × 10¹¹ | 9.30 × 10¹⁰ | 1.93 × 10⁹ | 2.42 × 10⁸ | 5.24 × 10⁸ | 3.06 × 10⁵ |
| Ct (F) | 5.22 × 10⁻¹¹ | 5.97 × 10⁻¹¹ | 6.08 × 10⁻¹¹ | 6.20 × 10⁻¹¹ | 1.31 × 10⁻¹⁰ | 1.40 × 10⁻¹⁰ | 2.1 × 10⁻¹⁰ | 2.53 × 10⁻¹⁰ | 4.03 × 10⁻¹⁰ |
3.4 Breakdown strength and energy storage density
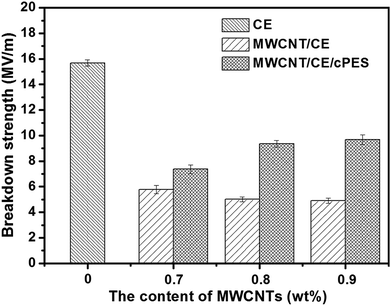
In the application of microelectronics, breakdown strength (Eb)46,47 and energy storage density (We)48 are two important indexes. Fig. 15 gives the breakdown strengths of MWCNT/CE and MWCNT/CE/cPES composites. The breakdown strength of CE resin is 15.68 MV m−1, while those of MWCNT/CE composites are much lower. For example, when the f value reaches 0.7 wt%, the Eb value of MWCNT/CE composites is decreased by 63%, compared with that of CE resin. A similar degree of reduction also appeared when 0.5 wt% carbon black (CB) was added into the linear triblock copolymer SEBS;49 moreover, the Eb value decreased by 62%. In fact, lots of reports have proved that the addition of conductors into a polymer will greatly decrease the breakdown strength,50 and this is attributed to the following three reasons. First, the insulating ability of a polymer will gradually be lost after the addition of conductor, tending to significantly decrease the Eb value.51 Second, the breakdown strength is greatly dependent on the defect density of the material,52 while the incorporation of inorganic fillers into the polymer tends to bring some defects inside the material, and thus decrease the maximum voltage strength that can be withstood by the material. Third, pristine MWCNTs have poor dispersion in CE resin (Fig. 8), and the existence of these uneven structures will produce inhomogeneous electric intensity inside the sample under the external electric field, and consequently, these samples are easily electrically broken down by a local discharge;52 as a result, these MWCNT/CE composites have much lower breakdown strengths than CE resin.Attractively, MWCNT/CE/cPES composites have obviously larger breakdown strengths than MWCNT/CE composites. For example, the Eb value of 0.9MWCNT/CE/cPES composites is 2 times of that of 0.9MWCNT/C composites, and decreases only by 38% compared with CE resin. In the literature,53 the addition of 0.25 wt% Ag particles into epoxy (EP) resin decreases the Eb value by 70.8%. Therefore it is reasonable to state that the degree of reduction of breakdown strength of MWCNT/CE/cPES composites is much smaller. This attractive result should be attributed to the homogeneous structure and less defects inside with the existence of cPES.
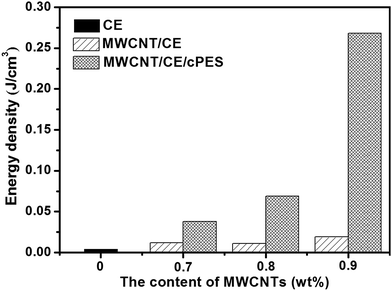
Fig. 16 exhibits the energy storage densities of CE resin, MWCNT/CE and MWCNT/CE/cPES composites. CE resin has very low energy storage density, while MWCNT/CE and MWCNT/CE/cPES composites have much larger ones. It is worth noting that MWCNT/CE/cPES composites have much larger We compared with MWCNT/CE composites, especially when the f value is 0.9 wt%, the We value of the former is 14 times of that of the latter. As we know, We is proportional to the dielectric constant and the square of Eb.54,55 The special spatial structure endows MWCNT/CE/cPES composites with remarkably increased dielectric constant and Eb compared with MWCNT/CE composites as discussed above, thus leading to much higher We. This attractive result demonstrates that conductor/polymer composites with high energy storage density can be fabricated through building a special spatial structure.
4. Conclusions
Designing a completely compatible CE/cPES blend as the matrix, a new kind of ternary composite, in which pristine MWCNTs have very good dispersion in the CE/cPES matrix, MWCNT/CE/cPES, is facilely prepared through in situ non-covalent interaction between MWCNTs and cPES. This special spatial structure endows the MWCNT/CE/cPES composites with significantly improved dielectric constant, Eb and We as well as much lower fc and dielectric loss. This research provides a new and simple way to fabricate high-k polymeric composites with significantly enhanced dielectric properties and energy storage density.Acknowledgements
We thank National Natural Science Foundation of China (51473107, 51173123), the Priority Academic Program Development of Jiangsu Higher Education Institutions (PAPD) for financially supporting this project.References
- A. Ameli, M. Nofar, C. B. Park, P. Pötschke and G. Rizvi, Carbon, 2014, 71, 206 CrossRef CAS
.
- W. Wu, X. Y. Huang, S. T. Li, P. K. Jiang and T. J. Toshikatsu, J. Phys. Chem. C, 2012, 116, 24887 CAS
.
- S. Pande, A. Chaudhary, D. Patel, B. P. Sinqh and R. B. Mathu, RSC Adv., 2014, 4, 13839 RSC
.
- Z. M. Dang, J. K. Yuan, S. H. Yao and R. J. Liao, Adv. Mater., 2013, 25, 6334 CrossRef CAS PubMed
.
- P. G. Ren, Y. Y. Di, Q. Zhang, L. Li, H. Pang and Z. M. Li, Macromol. Mater. Eng., 2012, 297, 437 CrossRef CAS
.
- R. S. Diggikar, D. J. Late and B. B. Kale, RSC Adv., 2014, 4, 22551 RSC
.
- N. Kulshrestha, A. Misra, N. Koratkar and D. S. Misra, ACS Appl. Mater. Interfaces, 2013, 5, 3424 CAS
.
- K. M. Au, Z. H. Lu, S. J. Matcherb and S. P. Armes, Biomaterials, 2013, 34, 8925 CrossRef CAS PubMed
.
- L. L. Sun, B. Li, Y. Zhao, G. Mitchell and W. H. Zhong, Nanotechnology, 2011, 21, 305702 CrossRef PubMed
.
- Y. Li, X. L. Pei, B. Shen, W. T. Zhai, L. H. Zhang and W. G. Zheng, RSC Adv., 2015, 5, 24342 RSC
.
- J. M. Thomassin, D. Vuluga, M. Alexandre, C. Jérôme, I. Molenberg, I. Huynen and C. Detrembleur, Polymer, 2012, 53, 169 CrossRef CAS
.
- L. Zhang, W. Wang, X. G. Wang, P. Bass and Z.-Y. Cheng, Appl. Phys. Lett., 2013, 103, 232903 CrossRef
.
- D. R. Wang, X. M. Zhang, J. W. Zha, J. Zhao, Z. M. Dang and G. H. Hu, Polymer, 2013, 54, 1916 CrossRef CAS
.
- M. Monti, I. Armentano, G. Faiella, V. Antonucci, J. M. Kenny, L. Torre and M. Giordano, Compos. Sci. Technol., 2014, 96, 38 CrossRef
.
- N. Y. Ning, X. Bai, D. Yang, L. Q. Zhang, Y. L. Lu, T. Nishi and M. Tian, RSC Adv., 2014, 4, 4543 RSC
.
- B. H. Wang, G. Z. Liang, Y. C. Jiao, A. J. Gu, L. M. Liu, L. Yuan and W. Zhang, Carbon, 2013, 54, 224 CrossRef CAS
.
- H. Stoyanov, D. C. Carthy, M. Kollosche and G. Kofod, Appl. Phys. Lett., 2009, 94, 232905 CrossRef
.
- W. X. Sun, J. E. de León, C. Ma, X. L. Tan and M. R. Kessler, Compos. Sci. Technol., 2012, 72, 1692 CrossRef CAS
.
- T. X. Wang, G. Z. Liang, L. Yuan and A. J. Gu, Carbon, 2014, 77, 920 CrossRef CAS
.
- C. Wu, X. Y. Huang, L. Y. Xie, X. F. Wu, J. H. Yu and P. K. Jiang, J. Mater. Chem., 2011, 21, 17729 RSC
.
- L. C. Gu, T. X. Wang, W. Zhang, G. Z. Liang, A. J. Gu and L. Yuan, RSC Adv., 2013, 3, 7071 RSC
.
- P. C. Ma, N. A. Siddiqui, G. Marom and J. K. Kim, Composites, Part A, 2010, 41, 1345 CrossRef
.
- Y. C. Li, J. G. Tang, L. J. Huang, Y. Wang, J. X. Liu, X. C. Ge, S. C. Tjong, R. Y. C. Li and L. A. Belfiore, Composites, Part A, 2015, 68, 1 CrossRef CAS
.
- D. Tuncel, Nanoscale, 2011, 3, 3545 RSC
.
- Z. X. Qiang, G. Z. Liang, A. J. Gu and L. Yuan, Mater. Lett., 2014, 115, 159 CrossRef CAS
.
- D. Lesueur, X. Colin, G. Camino and N. D. Albérola, Polym. Bull., 1997, 39, 755 CrossRef CAS
.
- H. B. Gu, S. Tadakamalla, X. Zhang, Y. D. Huang, Y. Jiang, H. A. Colorao, Z. P. Luo, S. Y. Wei and Z. H. Guo, J. Mater. Chem. C, 2013, 1, 729 RSC
.
- Z. X. Qiang, G. Z. Liang, A. J. Gu and L. Yuan, Ind. Eng. Chem. Res., 2014, 53, 4726 CrossRef CAS
.
- Y. C. Jiao, L. Yuan, G. Z. Liang and A. J. Gu, J. Phys. Chem. C, 2014, 118, 24091 CAS
.
- G. T. Yu, X. G. Zhao, M. Niu, X. R. Huang, H. Zhang and W. Chen, J. Mater. Chem. C, 2013, 1, 3833 RSC
.
- G. Lu, H. Li, C. Liusman, Z. Y. Yin, S. X. Wu and H. Zhang, Chem. Sci., 2011, 2, 1817 RSC
.
- X. Q. Zhang, Y. Y. Feng, S. D. Tang and W. Feng, Carbon, 2010, 48, 211 CrossRef CAS
.
- Z. X. Qiang, G. Z. Liang and A. J. Gu, J. Nanopart. Res., 2014, 16, 2391 CrossRef
.
- Z. Y. Zhang, L. Yuan, G. Z. Liang, A. J. Gu, Z. X. Qiang, C. W. Yang and X. X. Chen, J. Mater. Chem. A, 2014, 2, 4975 CAS
.
- G. D. Filpo, F. P. Nicoletta, L. Ciliberti, P. Formoso and G. Chidichimo, J. Power Sources, 2015, 274, 274 CrossRef
.
- B. Gogoi and N. S. Sarma, ACS Appl. Mater. Interfaces, 2015, 7, 11195 CAS
.
- C. Baudot and C. M. Tan, Carbon, 2011, 49, 2362 CrossRef CAS
.
- J. K. Yuan, S. H. Yao, Z. M. Dang, A. Sylvestre, M. Genestoux and J. B. Bai, J. Phys. Chem. C, 2011, 115, 5515 CAS
.
- H. Y. Ma, L. F. Tong, Z. B. Xu and Z. P. Fang, Nanotechnology, 2007, 18, 375602 CrossRef
.
- A. Mandal and A. K. Nandi, J. Phys. Chem. C, 2012, 116, 9360 CAS
.
- K. Scott, Rev. Mod. Phys., 1973, 45, 574 CrossRef
.
- X. H. Zhang, G. Z. Liang, J. F. Chang, A. J. Gu, L. Yuan and W. Zhang, Carbon, 2012, 50, 4995 CrossRef CAS
.
- J. F. Chang, G. Z. Liang, A. J. Gu, S. D. Cai and L. Yuan, Carbon, 2012, 50, 689 CrossRef CAS
.
- J. Bisquert, G. Garcia-Belmonte, P. Bueno, E. Longo and L. O. S. Bulhões, J. Electroanal. Chem., 1998, 452, 229 CrossRef CAS
.
- M. E. Orazem, I. Frateur, B. Tribollet, V. Vivier, S. Marcelin, N. Pébère, A. Bunge, E. A. White, D. P. Riemer and M. Musiani, J. Electrochem. Soc., 2013, 160, 215 CrossRef
.
- H. C. Wu and M. R. Kessler, ACS Appl. Mater. Interfaces, 2015, 7, 5915 CAS
.
- M. Donnay, S. Tzavalas and E. Logakis, Compos. Sci. Technol., 2015, 110, 1528 CrossRef
.
- H. Luo, D. Zhang, C. Jiang, X. Yuan, C. Chen and K. C. Zhou, ACS Appl. Mater. Interfaces, 2015, 7, 8061 CAS
.
- H. Stoyanov, D. M. Carthy, M. Kollosche and G. Kofod, Appl. Phys. Lett., 2009, 94, 232905 CrossRef
.
- J. W. Shang, Y. H. Zhang, L. Yu, B. Shen, F. Z. Lv and P. K. Chu, Mater. Chem. Phys., 2012, 134, 867 CrossRef CAS
.
- C. Yang, Y. H. Lin and C. W. Nan, Carbon, 2009, 47, 1096 CrossRef CAS
.
- L. Ren, J. Zhao, S. J. Wang, B. Z. Han and Z. M. Dang, Compos. Sci. Technol., 2015, 114, 57 CrossRef CAS
.
- L. Qi, B. I. Lee, S. H. Chen, W. D. Samuels and G. J. Exarhos, Adv. Mater., 2005, 17, 1777 CrossRef CAS
.
- C. Wu, X. Y. Huang, X. F. Wu, L. Y. Xie, K. Yang and P. K. Jiang, Nanoscale, 2013, 5, 3847 RSC
.
- J. W. Shang, Y. H. Zhang, L. Yu, X. L. Luan, B. Shen, Z. L. Zhang, F. Z. Lv and P. K. Chu, J. Mater. Chem. A, 2013, 1, 884 CAS
.
Footnote |
| † Electronic supplementary information (ESI) available: Nyquist plots and simulation results for MWCNT/CE and MWCNT/CE/cPES composites. See DOI: 10.1039/c5ra18684f |
| This journal is © The Royal Society of Chemistry 2015 |

