White clover based nitrogen-doped porous carbon for a high energy density supercapacitor electrode
Guofu Ma*a,
Zhiguo Zhanga,
Kanjun Sunb,
Hui Penga,
Qian Yanga,
Feitian Rana and
Ziqiang Lei*a
aKey Laboratory of Eco-Environment-Related Polymer Materials of Ministry of Education, Key Laboratory of Polymer Materials of Gansu Province, College of Chemistry and Chemical Engineering, Northwest Normal University, Lanzhou 730070, China. E-mail: magf@nwnu.edu.cn; leizq@nwnu.edu.cn
bCollege of Chemistry and Environmental Science, Lanzhou City University, Lanzhou 730070, China
First published on 1st December 2015
Abstract
We have employed the biomaterial white clover as a carbon precursor and ZnCl2 as an activating agent to prepare white clover carbons (WCCs). The WCC-2 (mass ratios of white clover and ZnCl2 is 1![[thin space (1/6-em)]](https://www.rsc.org/images/entities/char_2009.gif) :
:![[thin space (1/6-em)]](https://www.rsc.org/images/entities/char_2009.gif) 2) possesses as high as 6.9 wt% nitrogen content and 857 m2 g−1 BET surface area. Furthermore, it exhibits 233.1 F g−1 specific capacitance at a current density of 1.0 A g−1, even 82.9% capacitance retention at 20 A g−1 in 2 mol L−1 KOH electrolyte. The specific capacitance could remain at almost about 100.0% when the cycle number is between the 200–5000 cycles. Because of the wide potential window (0–2.0 V) and high specific capacitance, the WCC-2//WCC-2 symmetric capacitor shows an energy density of 30–13.1 W h kg−1 under the power outputs of 503.5–9991.5 W kg−1 in 0.5 mol L−1 Na2SO4 electrolyte. The results demonstrate WCC-2 can be a promising candidate for the electrode material of high performance supercapacitors.
2) possesses as high as 6.9 wt% nitrogen content and 857 m2 g−1 BET surface area. Furthermore, it exhibits 233.1 F g−1 specific capacitance at a current density of 1.0 A g−1, even 82.9% capacitance retention at 20 A g−1 in 2 mol L−1 KOH electrolyte. The specific capacitance could remain at almost about 100.0% when the cycle number is between the 200–5000 cycles. Because of the wide potential window (0–2.0 V) and high specific capacitance, the WCC-2//WCC-2 symmetric capacitor shows an energy density of 30–13.1 W h kg−1 under the power outputs of 503.5–9991.5 W kg−1 in 0.5 mol L−1 Na2SO4 electrolyte. The results demonstrate WCC-2 can be a promising candidate for the electrode material of high performance supercapacitors.
1. Introduction
Supercapacitors are perfectly adapted for the quality of electricity required by energy efficient industrial equipment, electric and hybrid electric vehicles and smart-grid applications, for they have a high power density and good cyclability. Although, the energy density of supercapacitors is several orders of magnitude higher than that of conventional capacitors, compared with batteries (e.g., lithium-ion batteries), the energy density is low.1 Therefore, in the development of supercapacitors, the most critical aspect is to provide higher energy density while maintaining power density and cyclability.To meet such demands, porous carbon materials have received increased attention as electrode materials for supercapacitors because of their controllable pore size, high surface area, high thermal stability, low cost and good corrosion resistance.2 The carbon electrode is primarily made up of electrical double layer capacitors (EDLC), which are based on electrostatic attraction to generate charge accumulation and are formed at the electrode/electrolyte interface.3,4 To develop high performance carbon electrodes, and further enhance the energy density of supercapacitors, it is crucial to understand the capacitive performance of porous carbon depends on not only pore structure but also surface functionality of carbon.5,6 In this respect, one approach is to introduce an abundant porous structure and incorporate heteroatoms into carbon frameworks.7–9 The incorporation of heteroatoms, especially nitrogen, into carbon materials can improve the specific capacitance considerably, because the nitrogen-containing functional groups can improve the wettability of carbon materials to electrolyte solution, enhancing the electronic conductivity while maintaining the superb cyclability.10,11 A variety of nitrogen-doped porous carbons have been developed to meet this challenge, which is usually prepared by treating porous carbon with urea, amines, or ammonia,12,13 or using various nitrogen-containing carbon precursors with synthetic polymers,14,15 and ionic liquids.16,17 However, the preparation processes for these carbons require expensive and non-renewable raw materials, a lot of time and energy, and tedious preparation procedures.
Recent advances in electrode materials, such as, biomass or biomass derivatives offer significant opportunities to develop new, improved electrode materials from renewable resources. Wang et al. prepared microporous chicken feather carbon via activation with KOH, which exhibits the highest initial specific capacitance of 302 F g−1 at a current density of 1 A g−1 in 1 M H2SO4.18 Ding et al. created a high performance hybrid sodium ion capacitor with the active materials in both anode and cathode being approximately balanced in their capacity and derived entirely from biomass waste peanut shells.19 And Wu et al. used watermelon as the carbon source to prepare sponge-like carbonaceous hydrogels and aerogels through a novel, eco-friendly hydrothermal carbonization method.20
It is well known that white clover (Trifolium repens) grows all over the world, is very cheap, readily available and drought tolerant. In general, white clover works well as a major forage legume of considerable economic importance in temperate agricultural systems because of its nutritional value.21 Furthermore, it is a potential raw material to prepare nitrogen-doped porous carbons with good electrochemical capacitive performance because white clover can fix nitrogen.22 As a result of all these inherent advantages, white clover is generating very strong interest with regard to its use as a biomass carbon material for supercapacitors.
2. Experimental
2.1 Materials
White clover (Trifolium repens) derived from the local environment (Lanzhou Gansu province, China), zinc chloride (ZnCl2, Yantai Shuangshuang Chemical Co., Ltd, China). All chemical reagents were of analytical grade.2.2 Preparation of nitrogen-doped porous carbon based on white clover
Before carbonization, the raw material (white clover) was physically mixed with ZnCl2 in variable mass ratios of 1![[thin space (1/6-em)]](https://www.rsc.org/images/entities/char_2009.gif) :
:![[thin space (1/6-em)]](https://www.rsc.org/images/entities/char_2009.gif) 1, 1
1, 1![[thin space (1/6-em)]](https://www.rsc.org/images/entities/char_2009.gif) :
:![[thin space (1/6-em)]](https://www.rsc.org/images/entities/char_2009.gif) 2 and 1
2 and 1![[thin space (1/6-em)]](https://www.rsc.org/images/entities/char_2009.gif) :
:![[thin space (1/6-em)]](https://www.rsc.org/images/entities/char_2009.gif) 3, respectively. It has been proven that physical mixing was chosen as the contacting method because in most cases it can lead to better porosity development than impregnation.23 The graphitization, activation and nitrogen-doped process of the white clover were simultaneously carried out in a tubular furnace by heating to 700 °C under a N2 flow with a heating rate of 5 °C min−1, and further hold at 700 °C for 2 h. Furthermore, the raw materials were used under the same conditions for comparison purposes. All samples were thoroughly washed several times with 2.0 mol L−1 HCl to remove inorganic salts and any unwanted impurities, and then with distilled water until neutral pH was achieved. Finally, the carbon samples were dried in an oven at 60 °C for 24 h. Hereafter, we name the as-prepared carbons with different mass ratios of white clover and activating agent (1
3, respectively. It has been proven that physical mixing was chosen as the contacting method because in most cases it can lead to better porosity development than impregnation.23 The graphitization, activation and nitrogen-doped process of the white clover were simultaneously carried out in a tubular furnace by heating to 700 °C under a N2 flow with a heating rate of 5 °C min−1, and further hold at 700 °C for 2 h. Furthermore, the raw materials were used under the same conditions for comparison purposes. All samples were thoroughly washed several times with 2.0 mol L−1 HCl to remove inorganic salts and any unwanted impurities, and then with distilled water until neutral pH was achieved. Finally, the carbon samples were dried in an oven at 60 °C for 24 h. Hereafter, we name the as-prepared carbons with different mass ratios of white clover and activating agent (1![[thin space (1/6-em)]](https://www.rsc.org/images/entities/char_2009.gif) :
:![[thin space (1/6-em)]](https://www.rsc.org/images/entities/char_2009.gif) 0, 1
0, 1![[thin space (1/6-em)]](https://www.rsc.org/images/entities/char_2009.gif) :
:![[thin space (1/6-em)]](https://www.rsc.org/images/entities/char_2009.gif) 1, 1
1, 1![[thin space (1/6-em)]](https://www.rsc.org/images/entities/char_2009.gif) :
:![[thin space (1/6-em)]](https://www.rsc.org/images/entities/char_2009.gif) 2 and 1
2 and 1![[thin space (1/6-em)]](https://www.rsc.org/images/entities/char_2009.gif) :
:![[thin space (1/6-em)]](https://www.rsc.org/images/entities/char_2009.gif) 3) as WCC-0, WCC-1, WCC-2 and WCC-3, respectively.
3) as WCC-0, WCC-1, WCC-2 and WCC-3, respectively.
2.3 Characterization of various carbon materials
The morphologies of the carbons were characterized using field emission scanning electron microscopy (FE-SEM, Ultra Plus, Carl Zeiss) at an accelerating voltage of 5.0 kV. The structure of the samples was characterized by transmission electron microscopy (TEM, JEM-2010 Japan). X-ray diffraction (XRD) of the samples was obtained on a Rigaku D/Max-2400 diffractometer with Cu Kα radiation (k = 1.5418 Å) at 40 kV, 100 mA and the 2θ range from 5° to 80°. Raman spectra were evaluated at ambient temperature through an inVia Raman spectrometer (Renishaw) with an Argon ion laser (λ = 514 nm). The Brunauer–Emmett–Teller surface area (SBET) and pore structure of the carbon samples were analyzed by nitrogen adsorption in a Micromeritics ASAP 2020 nitrogen adsorption apparatus (U.S.A.), and all samples were degassed at 200 °C prior to nitrogen adsorption measurements. The elemental microanalysis (C, H and N) was carried out using an Elemental Analyzer Vario EL and X-ray photoelectron spectroscopy (XPS) measurement was performed on an Escalab 210 system (Germany).2.4 Electrochemical measurements
Cyclic voltammetry (CV) studies of the all carbons were performed with an electrochemical workstation (CHI 660D) in a three-electrode system. The glassy carbon electrode with a diameter of 5 mm was employed as the working electrode, high purity carbon rod as the counter electrode, and Hg/HgO (1 mol L−1 KOH) as the reference electrode. Typically, 4 mg as-prepared products with assistance by ultrasonic vibration dispersed in 0.4 mL of 0.25 wt% Nafion (DuPont, USA) ethanol solutions. Then, 8 μL of the above suspension was dropped onto the glassy carbon electrode and dried for 10 minutes at room temperature. Electrochemical impedance spectroscopy (EIS) measurements was performed in the frequency between 0.1 Hz and 100 kHz and impedance amplitude of ±5 mV at an open circuit potential. The cycle-life stability was obtained on the cycling testing equipment (CT2001A, Wuhan Land Electronic Co. Ltd., China).Besides, the capacitive performance of WCC-2 was investigated using a two-electrode testing cell. The working electrode was prepared by uniformly stirring the WCC-2 powder into the mixture of polyvinylidene fluoride (PVDF) and commercial carbon black in N-methyl-2-pyrrolidone (NMP) until a homogeneous slurry formed. The slurry was coated on nickel foam and dried at 80 °C for 12 h, then weighed and pressed into sheets under 10 MPa. The total mass was close to 4 mg of each electrode as a device for the measurements. Two as-prepared WCC-2 electrodes were fabricated with the separator (thin polypropylene film) and electrolyte solution (0.5 mol L−1 Na2SO4 aqueous solutions) symmetrically into a sandwich-type cell construction (electrode/separator/electrode).
3. Results and discussion
3.1 Morphologies and chemical features of activated carbons
The morphology and high porosity of the white clover and carbon samples were investigated by FE-SEM techniques (Fig. 1). The internal structure of the white clover is shown in Fig. 1a and lots of irregular pores in the macroscopic scale and rough surface could be observed. However, after carbonization, it is clearly seen from Fig. 1b that the WCC-0 has a smooth surface and the pristine macropores disappeared, which might be due to the collapse of the pores in the process of heating-up. The activated carbon materials seem to be accumulated by small carbon spherical particles, which might make ionic diffusion from bulk electrolyte into the inner space of carbon materials easier. By contrast, the size of the carbon particles of WCC-2 are smaller than WCC-1. And WCC-2 (Fig. 1d) appears to be composed of small carbon fragments and also looser with less agglomeration than WCC-1 (Fig. 1c). Being different from the others, these generated macropores and carbon layers accumulated randomly in WCC-3 (Fig. 1e).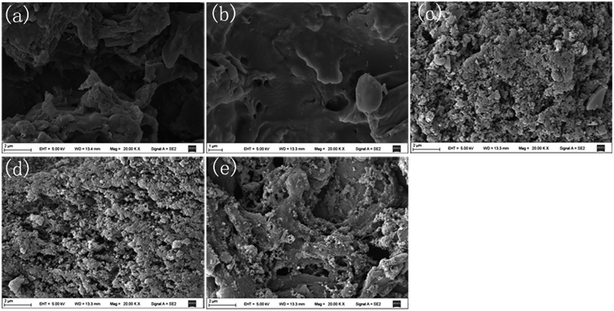 | ||
| Fig. 1 FE-SEM images of: (a) the raw material of white clover after grinding and carbons prepared with different additions of activating agent: (b) WCC-0; (c) WCC-1; (d) WCC-2 and (e) WCC-3 samples. | ||
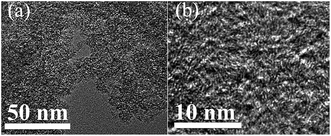
In addition, the TEM image in Fig. 2a demonstrates that the WCC-2 has a well-defined pore system consisting of an abundant inherent and disordered three-dimensional mesopore porous structure which is beneficial to the fast diffusion of electrolyte ions from bulk electrolyte into the inner space of carbon materials. High resolution TEM images clearly exhibit a highly developed microporous structure due to carbonization and the activation of the white clover. Notably, this kind of micro–mesopores structure is very important for rapid charge/discharge at large current density and excellent rate capability performance, because the micropores provide high specific surface areas to store charge meanwhile the interconnected mesopores can make diffusion and transport of electrolytes easier.24
In order to investigate the development of porosity by ZnCl2 activation, the specific surface areas and pore structures of the activated carbon samples were measured by the N2 adsorption–desorption technique. As given in Fig. 3a, it is clear that WCC-0 prepared without activating agent shows a type I absorption isotherm (according to the IUPAC classification) indicating the non-porous characteristics. But with the increase of the white clover/ZnCl2 mass ratio, the dramatically increased adsorption volumes show a much more developed porous structure, meanwhile the rapid increment at lower pressure indicates the more developed micropores, proving the white clover/ZnCl2 mass ratio might be an important factor for controlling the development of porosity by ZnCl2 chemical activation. Specifically, the carbons after activation display between type II and type IV absorption isotherms with a much higher N2 absorption capacity than WCC-0 indicating the abundant pore structure. In addition, the isotherms of the activated carbon samples (WCC-1, WCC-2 and WCC-3) are assigned to the typical type H-4 hysteresis loops at relative pressures from 0.40 to 1.0 implying the coexistence of mesopores, which are associated with aggregates of plate-like particles giving rise to slit-shaped pores. And the sharp increase in adsorption capacity for the activated carbon samples at low relative pressure (P/P0 < 0.2) could be attributed to the strong absorption of N2 in micropores. Furthermore, the obvious tails at higher relative pressures approaching 1.0 demonstrates the existence of macropores.25 These results indicate that the samples include not only predominant mesopores but also a certain amount of micropores and macropores.
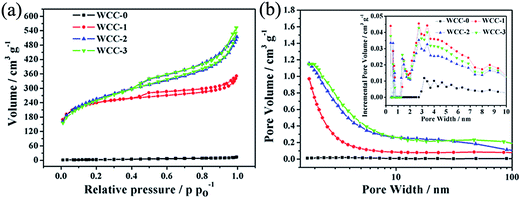 | ||
| Fig. 3 (a) Nitrogen adsorption–desorption isotherms, (b) and inset (b) pore size distributions of the as-prepared carbons. | ||
The pore structure is also confirmed by the pore size distribution plots, which is recorded from the adsorption branch of the isotherm based on BJH model (Fig. 3b) and associated with non-local density functional theory (the inset of the Fig. 3b). As shown in Fig. 3b and the inset, the activated carbons have a well-developed porous structure and exhibit much more pores with diameters centered in the microporous and mesoporous regions than WCC-0. As a result, the more activating agent added, the larger the porosity of the carbon generated by chemical activation.26,27 It is possible that while ZnCl2 corroded, the micropores were formed and the mesopores of WCC were expanded at a high temperature of 700 °C. However, in the pore diameter range of 2–100 nm, apparent differences can be found with WCC-2 and WCC-3 as compared with WCC-1 which has an obviously lower intensity in mesopores and macropores. It also can be seen that WCC-3 possesses somewhat more mesopores and macropores than WCC-2. In more detail, the plots (the inset of the Fig. 3b) indicate that the porosity of the activated carbons mostly consist of a wider pore distribution in well-defined pore systems: micropores (0.3 nm, 0.6–2 nm) and smaller mesopores (2–5 nm). And the WCC-2 contains multi-level micropores centered at 0.6 nm and 1.2 nm which provide the hierarchical microstructure to store and insert the electron efficiently and ensure the electron access to those sites.24
Apart from the above mentioned analysis, Table 1 containing BET specific surface areas and pore volumes can provide the textural properties of the carbon samples more precisely. The activated porous carbon materials show much higher specific surface area and pore volume than the directly carbonized white clover (Fig. 3a, Table 1), indicating the high efficiency of ZnCl2 activating agent on pore propagation and widening at the same time. Accordingly, the as-prepared carbons after activation contain an abundance of both mesopores and micropores. Even though the nitrogen adsorption–desorption isotherms and BET specific surface areas of WCC-2 and WCC-3 are very similar, there are no obvious differences between the micropore volumes and the average pore diameter. That is, the BET specific surface areas of WCC-2 and WCC-3 are 857.0 and 851.0 m2 g−1, but their micropore areas are 194.6 and 121.3 m2 g−1, their average pore widths are 3.71 and 4.02 nm, which demonstrates there are more abundant micropores and less mesopores and macropores in the WCC-2 than WCC-3. This fact is identical with the results of Fig. 3b. The pore structure in WCC-2 is believed to be more beneficial for supercapacitors, because the actual energy storage takes place predominately in the micropores, meanwhile, the larger pores can provide fast mass-transport of electrolytes.3
| Samples | Elemental analysis | SBETa (m2 g−1) | Smicb (m2 g−1) | Dc (nm) | Vtotald (cm3 g−1) | ||
|---|---|---|---|---|---|---|---|
| C (%) | N (%) | H (%) | |||||
| a Specific surface area determined according to BET (Brunauer–Emmett–Teller) method.b Micropore surface area from t-plot method.c Adsorption average pore diameter.d Total pore volume. | |||||||
| WCC-0 | 59.3 | 4.1 | 1.3 | 12.9 | 0 | 0 | 0.02 |
| WCC-1 | 77.1 | 6.8 | 1.7 | 763.1 | 353.4 | 2.84 | 0.54 |
| WCC-2 | 78.3 | 6.9 | 1.6 | 857.0 | 194.6 | 3.71 | 0.80 |
| WCC-3 | 79.4 | 6.8 | 1.6 | 851.0 | 121.3 | 4.02 | 0.85 |
Elemental analysis was employed on all nitrogen-doped porous carbons based on white clover because the chemical activation can also influence the nitrogen content. As listed in Table 1, the nitrogen contents of WCC-0, WCC-1, WCC-2 and WCC-3 are 4.1, 6.8, 6.9, and 6.8 wt%, respectively, which increase after activation and almost remain stable whatever the mass ratio of the raw material to the activation agent is at 700 °C. This result indicates the nitrogen content of the carbons during activation and carbonization may be retained.
X-ray photoelectron spectroscopy (XPS) analysis was used to further investigate the surface nitrogen chemical composition in WCC-2. Fig. 4a demonstrates a predominant C 1s peak at around 299.8 eV, a weak O 1s peak near 544.8 eV, and a pronounced N 1s peak located at about 413.8 eV, with atomic concentrations of 87.78, 5.85, and 5.37%, respectively. The N 1s peak further confirms the doping of N atoms in the carbon frame, which can produce defects in carbon as well as improve the hydrophilicity, increase the utilization ratio of the surface area and additional active sites for the supercapacitor.28,29 The binding energy peaks observed in the high-resolution N 1s profile (Fig. 4b) can be basically deconvoluted into four peaks located at 398.5, 400.1, 401.4, and 403.7 eV, which are attributed to pyridinic (N-6), pyrrolic and pyridone (N-5), quaternary (N-Q), and pyridine-N-oxide (N-X) groups, respectively.30 The surface nitrogen species include N-6 (37.3%), N-5, (28.6%), N-Q (17.0%) and N-X (17.1%), and the N-6 and N-5 species contents are as high as 65.9% of the total nitrogen atoms of WCC-2, which are considered to improve the performance of the supercapacitors.31 In addition, to analyze the elemental distribution, WCC-2 was further characterized by element mapping images of carbon, oxygen and nitrogen (Fig. 4c). The uniform distribution of blue dots (nitrogen) suggests that nitrogen is uniformly doped in the WCC-2 skeleton.
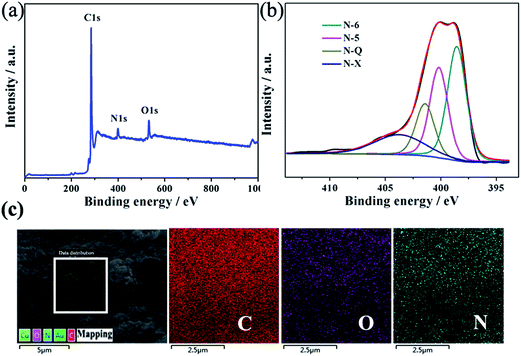 | ||
| Fig. 4 (a) XPS survey spectra, (b) high-resolution XPS spectra of the deconvoluted N 1s peak and (c) elemental mapping images (selected from the square region) of WCC-2. | ||
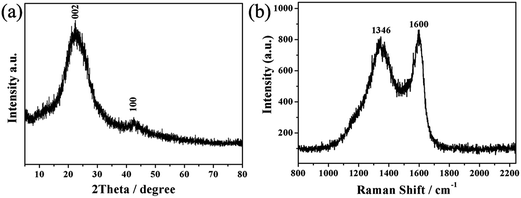
X-ray diffraction (XRD) analysis was used to investigate the structure of WCC-2. As seen from Fig. 5a, two typical peaks can been observed. The clear observation of the (002) diffraction peak at around 2θ = 23.7° indicating that the activated carbon consists of small domains of ordered graphene sheets, and another diffraction peak centered at 2θ = 42.5° which can be approximately indexed as the (100) plane of standard graphite. Notably, both diffraction peaks are broad in width and low intensity in height, suggesting the amorphous feature of the WCC-2 with partial graphitization.
Raman spectroscopy analysis was employed to further investigate the structure of the WCC-2 sample. As given in Fig. 5b, the peaks at 1346 and 1600 cm−1 represent the D band and the G band of the carbon material, respectively, which are characteristic Raman peaks for carbon materials.32 As is known, the D band is generally associated with A1g symmetry which corresponds to the disordered carbon or defective graphitic structures, whereas the G band is a characteristic feature of the graphitic layers due to the E2g phonon of the sp2 carbon atoms corresponding to the tangential vibration of the carbon atoms.33 In addition, the relative intensity ratio of the D to G band (ID/IG) is proportional to the number of defect sites of carbon and used to examine the degree of disorder in the graphitic structure. That is, the higher the ratio, the lower the degree of graphitization. For WCC-2, the ID/IG ratio was 0.95, indicating partial graphitization and a relatively lower degree of graphitization than that of the commercial activated carbon (0.52).34 These observations from XRD and Raman analysis further suggest that WCC-2 possesses a partially graphitized structure, which might lead to its good electronic conductivity.
3.2 Electrochemical characterization of activated carbons
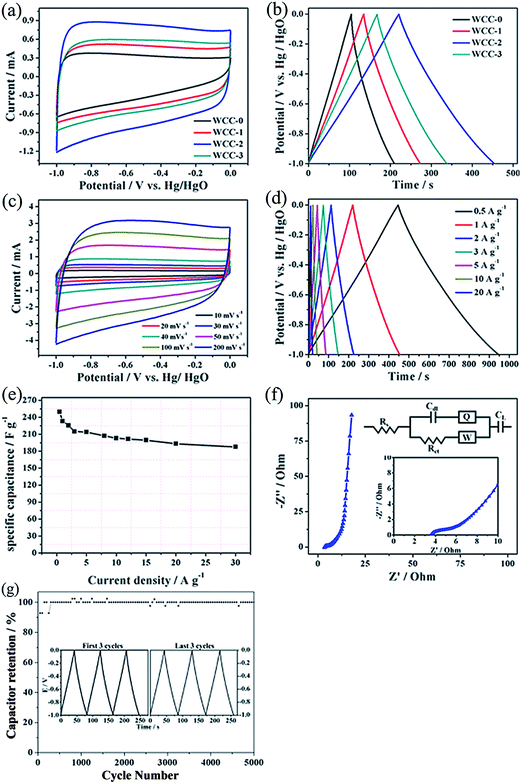
The obtained carbons were used as electrode materials of supercapacitors, and their electrochemical behaviors were analyzed in 2 mol L−1 KOH electrolyte employing a standard three-electrode system within a voltage window of −1.0 to 0 V. Obviously, from Fig. 6a, WCC-0 shows a triangular CV curve shape while the activated carbons exhibit quasi-rectangular CV curves at scanning rates of 50 mV s−1. As is known, the larger the area of the CV curve, the higher the capacitance of the electrode.35 Comparatively, the CV curve area of WCC-2 is much higher than that of the others, displaying a higher specific capacitance.Galvanostatic charge/discharge has also been employed to estimate the electrochemical performance of all carbon samples as electrode materials for supercapacitors at the density of 1 A g−1. It can be clearly seen in Fig. 6b that the shapes of all GCD curves are linear and symmetrical, suggesting that the electrodes possess an ideal capacitive performance and splendid electrochemical reversibility. The WCC-2 sample still maintains the appearance of roughly rectangular-like shapes at a high scan rate, even up to 200 mV s−1, indicating an ideal electrochemical capacitive behavior with rapid diffusion and easy transportation of electrolyte ions to the interface of the electrode (Fig. 6c). It might be due to the synergistic effect of the porous structure in WCC-2 which promotes ion diffusion and electrolyte/electrode wettability.
Fig. 6d shows the GCD curves of WCC-2 at different current densities (0.5–20 A g−1). It is clear that the shapes of the charge/discharge curves are closely linear and symmetrical, indicating an excellent capacitive behavior and electrochemical reversibility. Even when the current density increases to 20 A g−1, the galvanostatic charge/discharge curves still remain a nearly linear-like shape. In addition, specific capacitances of the electrode at different densities are calculated according to the equation:
| Cs = IΔt/(mΔV), | (1) |
Electrochemical impedance spectroscopy (EIS) is used to investigate the facilitated ion- or electron-transport kinetics within the WCC-2 electrodes. Fig. 6f displays the Nyquist plot of WCC-2 electrode in 2 mol L−1 KOH at the frequency range of 0.1 Hz to 100 kHz. It is composed of three distinct parts at a different frequency range, including an uncompleted semicircle part at high frequency, an inclined portion of the curve (about 45°) at middle frequency and a linear part at low frequency. At the high frequency region (the inset of Fig. 6f), the intercept at the real axis gives the internal resistance value of the cell capacitor (Rs), which is the sum of the ionic resistance of the electrolyte, intrinsic active material resistance and the contact resistance at the interface of the active material and the current collector.36 The diameter of the semicircle reflects the charge transfer resistance (Rct), which is related to the charge transfer through the electrode/electrolyte interface. A smaller semicircle means a lower charge-transfer resistance. The 45° slope of the line in the middle frequencies is ascribed to the Warburg impedance (W), responding to the frequency dependence of ion diffusion/transport from electrolyte to the pore surface of the carbon electrode. The almost vertical line indicates swift ion diffusion in the electrolyte and ion adsorption onto the electrode surface and represents the dominance of ideal double-layer charge/discharge behaviors at low frequency.37 The Nyquist plots are also fitted and interpreted with the help of an appropriate electric equivalent circuit (see the inset of Fig. 6f). The capacitor circuit consists of Rs, Rct, W, CL, Cdl and Q, in which Cdl and Q are related to the capacitor layer formed during the charge–discharge process, and CL reflects the limited capacitance.38 As can be concluded, the WCC-2 not only has a low Rs (3.5 Ω cm2), but also possesses a small Rct (0.97 Ω cm2), as well as a small Warburg resistance (0.017 Ω cm2). These values indicate that the ion diffusion and electrolyte permeation into the pore structure is easier, which might facilitate the formation of the electric double layer. The result might be ascribed to partial graphitization, high surface area and controlled pore size as well as a high nitrogen content.
Fig. 6g indicates the cycling stabilities of the WCC-2 electrode investigated by GCD measurement at a current density of 1 A g−1 for 5000 cycles. It is clear that the specific capacitance still remains at almost 100.0% of the capacitance value of the 200 cycles after 5000 cycles, and GC curves of the first three and the last three cycles are almost identical isosceles triangles (Fig. 6g inset), which indicate that the WCC-2 delivers an excellent cycling stability as an electrode material for supercapacitors.
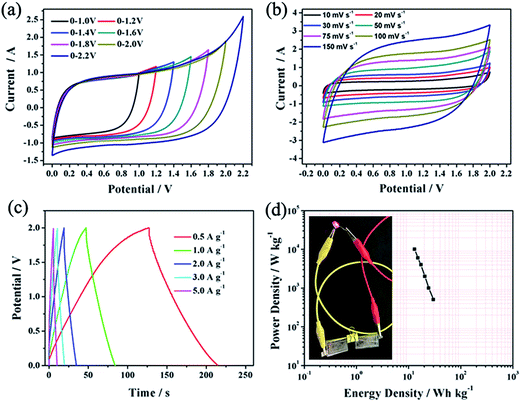
To further investigate the electrochemical performance of the WCC-2 electrode in a full cell set-up by cyclic voltammetry and galvanostatic charge/discharge test, a symmetric supercapacitor based on two equal WCC-2 is developed in a two-electrode system. According to the equation E = 1/2CV2, the energy density is not only related to the capacitance of the symmetric supercapacitor but also closely interrelated with the operating voltage. To further enhance the energy density of the symmetric capacitor, the strategy of improving the operation voltage is a vital candidate. One of the suitable methods is to select an optimal electrolyte for the two-electrode symmetric supercapacitors. And the neutral Na2SO4 aqueous solution electrolyte stands out above the rest in recent years, because the carbon//carbon symmetric capacitors possess a larger operation voltage in Na2SO4 aqueous solution than in acid and alkali solutions. More importantly, it is cost-efficient, environmentally friendly, and easier to obtain than organic solutions.39 Therefore, the WCC-2//WCC-2 symmetric supercapacitor was fabricated in 0.5 mol L−1 Na2SO4 aqueous solution. Furthermore, due to the vital influence of the voltage range, CV curves in different ranges were performed to determine the stable and optimal voltage ranges. As shown in Fig. 6a, it can be clearly seen that the operating cell voltage can be greatly extended. CV curves of the WCC-2//WCC-2 device are measured at 50 mV s−1 with different potential windows. It is clearly seen that all curves exhibit rectangular-like shapes (Fig. 7a) and there is no obvious increase in the anodic current even at potential windows up to 2.0 V, implying an ideal capacitive behavior and a fast charge/discharge property. Therefore, a detailed investigation of the WCC-2//WCC-2 symmetric supercapacitor was performed in the voltage range of 0–2.0 V.
It is clear from Fig. 7b that all curves of the WCC-2//WCC-2 symmetric capacitor display a quasi-rectangular shape, even at scan rates as high as 150 mV s−1, indicating a good charge propagation with an excellent rate capability and suggesting the characteristics of double-layer capacitance. This characteristic of the carbon material is associated with the porous feature that can be accessed freely and quickly by electrolyte ions. These results can be further confirmed by galvanostatic charge/discharge measurements. As shown in Fig. 7c, the GCD curves of the WCC-2//WCC-2 device exhibit nearly triangular shapes with a small deviation from linearity, implying excellent electrochemical reversibility and low internal series resistance.40 In addition, the WCC-2 capacitor delivers specific capacitances of 44.0 F g−1 and 36.9 F g−1 at the current density of 0.5 A g−1 and 1.0 A g−1, based on the total active material mass of two electrodes. The Ragone plot in Fig. 7d shows the comparison of the power and energy densities of the WCC-2//WCC-2 symmetric capacitor device in 0.5 mol L−1 Na2SO4 electrolyte. The specific energy density (E, W h kg−1) and power density (P, W kg−1) for the supercapacitor cell can be calculated from the discharge curves at different current densities using the following equations:
| E = 1/2CV2 | (2) |
| P = E/t | (3) |
4. Conclusion
The nitrogen-doped porous carbon is prepared by white clover and the activating agent ZnCl2. Owing to high BET specific surface area (857.0 m2 g−1) and superior surface functionality (6.9 wt% nitrogen content), WCC-2 has high specific capacitance (233.1 F g−1 at the current density of 1 A g−1), possesses good capacitance retention capability and an excellent cycling stability. Besides the inherent advantages, the WCC-2//WCC-2 symmetric supercapacitor device delivers a high energy density of 30 W h kg−1 at the power density of 503.5 W kg−1. Therefore, it is a promising strategy to employ biomaterial white clover as advanced electrode materials for high-performance supercapacitors.Acknowledgements
This research was financially supported by the National Science Foundation of China (No. 21164009, 21174114), the program for Changjiang Scholars and Innovative Research Team in University (IRT1177), the Science and Technology Program of Gansu Province (No. 1308RJZA295, 1308RJZA265), Key Laboratory of Eco-Environment-Related Polymer Materials (Northwest Normal University) of Ministry of Education, and Key Laboratory of Polymer Materials of Gansu Province.References
- Y. Z. Zhang, Y. Wang, T. Cheng, W. Y. Lai, H. Pang and W. Huang, Chem. Soc. Rev., 2015, 44, 5181–5199 RSC.
- X. Yang, C. Chen, Y. Wang, L. Qiu and D. Li, Science, 2013, 341, 534–537 CrossRef CAS PubMed.
- E. Frackowiak and F. Beguin, Carbon, 2001, 39, 937–950 CrossRef CAS.
- L. Dai, D. W. Chang, J. B. Baek and W. Lu, Small, 2012, 8, 1130–1166 CrossRef CAS PubMed.
- H. J. Denisa, S. Mykola, Q. L. Gao and J. Teresa, Adv. Funct. Mater., 2009, 19, 438–447 CrossRef.
- J. Chang, Z. Gao, X. Wang, D. Wu, F. Xu, X. Wang, Y. Guo and K. Jiang, Electrochim. Acta, 2015, 157, 290–298 CrossRef CAS.
- L. F. Chen, X. D. Zhang, H. W. Liang, M. Kong, Q. F. Guan, P. Chen, Z. Y. Wu and S. H. Yu, ACS Nano, 2012, 6, 7092–7102 CrossRef CAS PubMed.
- Y. Zhao, M. Liu, X. Deng, L. Miao, P. K. Tripathi, X. Ma, D. Zhu, Z. Xu, Z. Hao and L. Gan, Electrochim. Acta, 2015, 153, 448–455 CrossRef CAS.
- D. Zhu, Y. Wang, L. Gan, M. Liu, K. Cheng, Y. Zhao, X. Deng and D. Sun, Electrochim. Acta, 2015, 158, 166–174 CrossRef CAS.
- Y. Zhai, Y. Dou, D. Zhao, P. F. Fulvio, R. T. Mayes and S. Dai, Adv. Mater., 2011, 23, 4828–4850 CrossRef CAS PubMed.
- J. Tang, J. Liu, C. Li, Y. Li, M. O. Tade, S. Dai and Y. Yamauchi, Angew. Chem., Int. Ed., 2015, 54, 588–593 CAS.
- R. Ramanathan and V. Bansal, RSC Adv., 2015, 5, 1424–1429 RSC.
- W. Luo, B. Wang, C. G. Heron, M. J. Allen, J. Morre, C. S. Maier, W. F. Stickle and X. Ji, Nano Lett., 2014, 14, 2225–2229 CrossRef CAS PubMed.
- C. Hu, S. He, S. Jiang, S. Chen and H. Hou, RSC Adv., 2015, 5, 14441–14447 RSC.
- S. Dutta, A. Bhaumik and K. C. W. Wu, Energy Environ. Sci., 2014, 7, 3574–3592 CAS.
- S. Mascotto, D. Kuzmicz, D. Wallacher, M. Siebenbürger, D. Clemens, S. Risse, J. Yuan, M. Antonietti and M. Ballauff, Carbon, 2015, 82, 425–435 CrossRef CAS.
- A. S. Pensado, F. Malberg, M. C. Gomes, A. A. Pádua, J. Fernández and B. Kirchner, RSC Adv., 2014, 4, 18017–18024 RSC.
- Q. Wang, Q. Cao, X. Wang, B. Jing, H. Kuang and L. Zhou, J. Power Sources, 2013, 225, 101–107 CrossRef CAS.
- J. Ding, H. Wang, Z. Li, K. Cui, D. Karpuzov, X. Tan, A. Kohandehghan and D. Mitlin, Energy Environ. Sci., 2015, 8, 941–955 CAS.
- X. L. Wu, T. Wen, H. L. Guo, S. Yang, X. Wang and A. W. Xu, ACS Nano, 2013, 7, 3589–3597 CrossRef CAS PubMed.
- I. Vaseva, Y. Akiscan, K. Demirevska, I. Anders and U. Feller, Sci. Hortic., 2011, 130, 653–659 CrossRef CAS.
- N. M. Casey, D. Milbourne, S. Barth, M. Febrer, G. Jenkins, M. T. Abberton, C. Jones and D. Thorogood, Theor. Appl. Genet., 2010, 121, 567–576 CrossRef PubMed.
- M. A. Lillo-Ródenas, D. Lozano-Castelló, D. Cazorla-Amorós and A. Linares-Solano, Carbon, 2001, 39, 751–759 CrossRef.
- X. Ma, M. Liu, L. Gan, Y. Zhao and L. Chen, J. Solid State Electrochem., 2013, 17, 2293–2301 CrossRef CAS.
- H. Zhong, C. Deng, Y. Qiu, L. Yao and H. Zhang, J. Mater. Chem. A, 2014, 2, 17047–17057 CAS.
- M. Liu, J. Qian, Y. Zhao, D. Zhu, L. Gan and L. Chen, J. Mater. Chem. A, 2015, 3, 11517–11526 CAS.
- P. K. Tripathi, M. Liu, Y. Zhao, X. Ma, L. Gan, O. Noonanb and C. Yu, J. Mater. Chem. A, 2014, 2, 8534–8544 CAS.
- J. P. Paraknowitsch, J. Zhang, D. S. Su, A. Thomas and M. Antonietti, Adv. Mater., 2010, 22, 87–93 CrossRef CAS PubMed.
- Z. Li, Z. Xu, X. Tan, H. Wang, C. M. B. Holt, T. Stephenson, B. C. Olsen and D. Mitlin, Energy Environ. Sci., 2013, 6, 871–878 CAS.
- J. R. Pels, F. Kapteijn, J. A. Moulijn, Q. Zhu and K. M. Thomas, Carbon, 1995, 33, 1641–1653 CrossRef CAS.
- H. C. Chen, F. G. Sun, J. T. Wang, W. C. Li, W. M. Qiao, L. C. Ling and D. H. Long, J. Phys. Chem. C, 2013, 117, 8318–8328 CAS.
- S. Gao, K. Geng, H. Liu, X. Wei, M. Zhang, P. Wang and J. Wang, Energy Environ. Sci., 2015, 8, 221–229 CAS.
- A. Sadezky, H. Muckenhuber, H. Grothe, R. Niessner and U. Pöschl, Carbon, 2005, 43, 1731–1742 CrossRef CAS.
- H. Wang, Z. Xu, A. Kohandehghan, Z. Li, K. Cui, X. Tan, T. J. Stephenson, C. K. King’ondu, C. M. Holt, B. C. Olsen, J. K. Tak, D. Harfield, A. O. Anyia and D. Mitlin, ACS Nano, 2013, 7, 5131–5141 CrossRef CAS PubMed.
- X. Wu, J. Zhou, W. Xing, G. Wang, H. Cui, S. Zhuo, Q. Xue, Z. Yana and S. Z. Qiao, J. Mater. Chem., 2012, 22, 23186–23193 RSC.
- D. Puthusseri, V. Aravindan, S. Madhavi and S. Ogale, Energy Environ. Sci., 2014, 7, 728–735 CAS.
- H. Wu, X. Y. Wang, L. L. Jiang, C. Wu, Q. L. Zhao, X. Liu, B. A. Hu and L. H. Yi, J. Power Sources, 2013, 226, 202–209 CrossRef CAS.
- L. Sun, C. Tian, Y. Fu, Y. Yang, J. Yin, L. Wang and H. Fu, Chem.–Eur. J., 2014, 20, 564–574 CrossRef CAS PubMed.
- Q. Wang, J. Yan, Y. Wang, T. Wei, M. Zhang, X. Jing and Z. Fan, Carbon, 2014, 67, 119–127 CrossRef CAS.
- J. Yan, Q. Wang, C. Lin, T. Wei and Z. Fan, Adv. Energy Mater., 2014, 4, 201400500 Search PubMed.
- W. H. Qu, Y. Y. Xu, A. H. Lu, X. Q. Zhang and W. C. Li, Bioresour. Technol., 2015, 189, 285–291 CrossRef CAS PubMed.
- Q. Zhao, X. Wang, H. Xia, J. Liu, H. Wang, J. Gao, Y. Zhang, J. Liu, H. Zhou, X. Li, S. Zhang and X. Wang, Electrochim. Acta, 2015, 173, 566–574 CrossRef CAS.
| This journal is © The Royal Society of Chemistry 2015 |

