A versatile method for direct determination of iron content in multi-wall carbon nanotubes by inductively coupled plasma atomic emission spectrometry with slurry sample introduction
Joanna Bok-Baduraa,
Agata Jakóbik-Kolon*a,
Marian Tureka,
Sławomir Boncelb and
Krzysztof Karońc
aSilesian University of Technology, Faculty of Chemistry, Department of Inorganic, Analytical Chemistry and Electrochemistry, Bolesława Krzywoustego 6, 44-100 Gliwice, Poland. E-mail: agata.jakobik@polsl.pl; Tel: +48 322371990
bSilesian University of Technology, Faculty of Chemistry, Department of Organic Chemistry, Biochemistry and Biotechnology, Bolesława Krzywoustego 4, 44-100 Gliwice, Poland
cSilesian University of Technology, Faculty of Chemistry, Department of Physical Chemistry and Technology of Polymers, Marcina Strzody 9, 44-100 Gliwice, Poland
First published on 20th November 2015
Abstract
Carbon nanotubes (CNTs), due to their unique combination of physicochemical properties, are continuously considered as one of the most interesting materials in contemporary science and industry. Their applicability depends on physical properties, such as number of walls, morphology, diameter and length (aspect ratio), but also on the content of carbonaceous and metallic contaminants (typically present as encapsulated catalyst nanoparticles from catalytic Chemical Vapor Deposition). Therefore, especially for medical and biomedical applications, the concentration of metallic impurities or modifiers should be monitored. In this paper, an inductively coupled plasma atomic emission spectrometry (ICP-AES) technique with slurry nebulization is proposed for direct determination of iron in multi-wall carbon nanotubes (MWCNTs). Slurries of MWCNTs are prepared in a 1% solution of Triton X-100, ultrasonicated to ensure their homogeneity and measured by the ICP-AES apparatus. The optimal range of MWCNTs slurry concentration and plasma radiofrequency (RF) power are established as 40–500 mg L−1 and 1.0 kW, respectively. The precision of the method does not exceed 1.5% of the mean values. Validation of the method is based on the fact that Fe is partly leached from the slurry and the assumption that iron in the leachate gives the same response in ICP-AES as iron in the residual MWCNTs slurry. This behavior was proved by summing both results for Fe (determined in the leachate and in the slurry of post-leaching nanotubes), which always yielded the same total amount of Fe for different degrees of leaching and this value was in full agreement with the iron content in the original, tested sample, as determined by the proposed slurry method. Taking into account all the examinations and obtained results, it can be concluded that the proposed method is applicable for fast, versatile, direct, and simple quantitative analysis of iron in MWCNTs and potentially other nanoallotropes produced by c-CVD.
1. Introduction
Multi-wall carbon nanotubes (MWCNTs) due to their unique electrical, optical, magnetic and mechanical properties are one of the most interesting materials of the 21st century. CNTs have already been or will be in the forthcoming future applied in the following fields: electronics, power engineering, industrial catalysis, military technology or (broadly defined) materials engineering (filler in polymers, ceramic and metallic nanocomposites including heat- and electric conductors, high performance CNT fibers, nanoliquids, antifouling paints etc.)1 Currently, a great interest for carbon nanotubes (CNTs) in medicine and biotechnology (e.g. drugs or vaccine delivery systems, biomaterials and biosensors) is observed.2–4Synthesis of MWCNTs – the most scalable and synthesized with low costs nanotubes – typically requires catalyst (Fe, Ni, Y, Co, Mo, La) which is essential in their high yield controllable growth and selective formation. However, the catalyst particles usually remain in the final product as encapsulated or to-CNT-wall tethered impurities which may fundamentally alter the nanotube properties (e.g. electronic, magnetic etc.). Moreover, these impurities may generate non-specific eco- and cytotoxicity to the produced material.3,5 On the other hand, in some cases metal nanoparticles may be introduced into/onto MWCNTs deliberately to achieve tunable properties (e.g. iron-enriched MWCNTs as contrast agent in magnetic resonance imaging or in targeted drug delivery systems).6 The presence of metal nanoparticles in CNTs, especially as for medical and biomedical application, should be fast and conveniently monitored to avoid changes of their properties. This statement is also true for industrial synthesis of MWCNTs where quality control and emissions levels will constitute key values for the market of nanomaterials and public health.
A lot of methods have been already proposed to examine structure, physical properties and chemical composition of MWCNTs including thermogravimetric analysis (TGA),7–9 Raman spectroscopy,7,8 transmission electron microscopy (TEM),7 scanning electron microscopy (SEM), scanning electron microscopy/energy dispersive X-ray spectrometry (SEM/EDX),3 transmission electron microscopy/energy dispersive X-ray spectrometry (TEM/EDX),10 X-ray photoelectron scattering,3 X-ray fluorescence11 or neutron activation analysis (NAA).12,13 Although these methods are commonly used, they have certain limitations e.g. TGA – the most popular method for determination the metal content in CNTs does not provide the information about the type of elements but only about the content of non-combustible and/or non-volatile part of sample.10,11 Other microscope methods like TEM, SEM, etc. are only surface sensitive and are insufficiently sensitive for determination of trace metal residues, particularly if the metal is encapsulated in core of individual CNTs. Generally, most of these methods are applicable for qualitative or semi-quantitative analyses, whereas the information about chemistry of impurities or modifier content are either unavailable or can be only estimated. NAA is the most appropriate technique for determination of metal content in CNTs, but it is not widely used due to the fact that the nuclear reactor is required.3 In other methods like inductively coupled plasma atomic emission spectrometry (ICP-AES) or inductively coupled plasma mass spectrometry (ICP-MS), which could give full information on concentration of particular elements, liquid samples are required.13 Due to the extreme difficulties in digesting/dissolving pristine CNTs, the procedures of preparation of liquid samples constitute the most important as well as the most problematic step in the whole process of analysis. Dry ashing and dissolution in concentrated nitric acid, wet acid digestion, microwave-assisted digestion or microwave induced combustion digestion were proposed to prepare samples to ICP-AES or ICP-MS.3,5,14 Unfortunately, these methods are often time-consuming, laborious, multistage, and not always give a complete digestion which may cause erroneous results in the further analysis.10 Furthermore, for dry ashing large amounts of sample must be used and, for this reason, this method cannot be used in a small laboratory scale. These methods also require the use of aggressive chemicals and conditions (e.g. for microwave-assisted dissolution procedure the mixture of nitric and perchloric acid must be applied) and depend on the type and structure of materials.14 The alternative method for digestion of CNTs and subsequent determination of total iron requires using a mixture of 70% HNO3 and 90% H2SO4 (1![[thin space (1/6-em)]](https://www.rsc.org/images/entities/char_2009.gif) :
:![[thin space (1/6-em)]](https://www.rsc.org/images/entities/char_2009.gif) 1, v/v) and 17 h of reflux.15 This method is time consuming and preparation of a large number of samples would be difficult.
1, v/v) and 17 h of reflux.15 This method is time consuming and preparation of a large number of samples would be difficult.
Therefore, direct, fast and simple analytical method for quantitative analysis of metal modifiers or metal impurities in CNTs is necessary. In this work, we propose fast and simple analytical method for direct determination of total iron content in MWCNTs using ICP-AES with a slurry sample introduction. This method has been previously used successfully for determination of elements in various materials (e.g. coal, titanium dioxide, dolomite and magnesia, cement etc.).16–19 Importantly, it is straightforward to implement and does not require modification of the ICP-AES equipment.
2. Experimental
2.1. Apparatus
Determination of iron concentration was performed utilizing Varian 710-ES spectrometer equipped with a V-groove nebulizer and a reduced-volume Sturman–Masters type spray chamber made of poly(tetrafluorethylene) (Varian). The operating parameters and the selected analytical lines were presented in Table 1. For determination of slurry concentration UV-VIS spectrophotometer (Varian, Carry 50 Scan) was used. The absorbance at the wavelength of 500 nm in a 1 cm glass cuvette was measured. SEM (Scanning electron microscope – Phenom Pro Desktop SEM) was used to obtain the micrographs of MWCNTs. EA (Elemental Analysis, Perkin Elmer 2400 Series II CHNS/O analyzer) to obtain an approximate values of iron content were utilized. For mineralization the MARS 5 CEM Corp. was used (200 °C, ramp time 15 min, hold time 15 min).| Parameter | Value |
|---|---|
| RF power, kW | 1.0 |
| Ar plasma flow rate, L min−1 | 15 |
| Ar carrier flow rate, L min−1 | 1.5 |
| Nebulizer pressure, kPa | 210 |
| Pump rate, rpm | 15 |
| Viewing | Axial |
| Fe wavelength, nm | 234.350, 261.187, 261.382 |
2.2. Materials and reagents
MWCNTs used in this study were synthesized by c-CVD (Chemical Vapor Deposition) according to a procedure previously described (760 °C, FeCp2 – ferrocene, bis(η5-cyclopentadienyl)iron as iron precursor, toluene as carbon source and Ar as carrier gas).20 Preliminary characterization of this material was performed using SEM, whereas for estimation of the total iron concentration in pristine (as-synthesized) MWCNTs elemental analysis (EA) was used. Triton X-100 – surfactant (Sigma-Aldrich) and nitric acid (65%, Suprapur, Merck) were used to prepare the slurries. All of the slurries, dispersions and solutions were prepared using ultrapure water (MilliporeElix 10 System).2.3. Concentration of MWCNTs in the slurries – UV-VIS analysis
A few slurry samples of various MWCNT concentration in 1% Triton X-100 aqueous solution were prepared for calibration. Blank solution was also prepared (1% Triton X-100) and used as the reference. On the basis on calibration curve, the actual concentrations of MWCNTs in the slurries were computed in the further experiments.2.4. ICP-AES analysis
2.5. Evaluation of the slurry method
The elaborated here slurry method was applied since MWCNTs used in these studies could not be completely digested – obtaining clear solution was impossible. Due to the lack of the certified reference materials similar to tested sample, validation of the method was based on the fact that Fe is partly leached from the slurry and assumption that iron in the leachate gives the same response in ICP-AES as iron in the residual MWCNTs slurry so the same calibration as for Fe in solution must work correctly also for Fe in the slurry. Therefore in order to test the proposed slurry method, iron was leached from iron-containing CNTs sample by two different methods: (1) leaching with the solution of 5% nitric acid and 1% Triton X-100; (2) microwave-assisted leaching with a mixture of concentrated acids (HNO3 and H2SO4, 4![[thin space (1/6-em)]](https://www.rsc.org/images/entities/char_2009.gif) :
:![[thin space (1/6-em)]](https://www.rsc.org/images/entities/char_2009.gif) 1). The amount of iron in the leachate was determined by ICP-AES method. The post-leaching MWCNTs was filtered, washed, and used for the preparation of slurry. Because it was impossible to quantitatively transfer MWCNTs from the filter, the concentration of the prepared slurry was determined by UV-VIS method. The iron content in the slurry prepared from the post-leaching MWCNTs was determined using the proposed slurry method. Subsequently, the sum of iron content in the leachate and iron content in post-leaching CNTs was compared with the iron content determined in the investigated material by the evaluated slurry method.
1). The amount of iron in the leachate was determined by ICP-AES method. The post-leaching MWCNTs was filtered, washed, and used for the preparation of slurry. Because it was impossible to quantitatively transfer MWCNTs from the filter, the concentration of the prepared slurry was determined by UV-VIS method. The iron content in the slurry prepared from the post-leaching MWCNTs was determined using the proposed slurry method. Subsequently, the sum of iron content in the leachate and iron content in post-leaching CNTs was compared with the iron content determined in the investigated material by the evaluated slurry method.
3. Results and discussion
3.1. MWCNT characterization
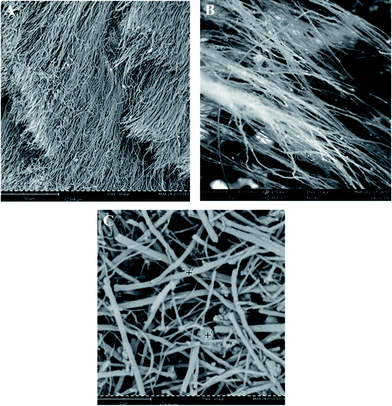
Micromorphology of the examined material was observed using SEM (Fig. 1A and B). In addition, SEM micrographs were used to indicate effectiveness of dispersion of MWCNTs in Triton X-100 solutions (Fig. 1C). In the original material, long, needle-like, aligned fibrous nanotubes covered with a few catalyst nanoparticles visible as brighter spots were observed. In turn, after dispersion, the nanotubes were found as distributed randomly. Differences in the appearance of slurries after the sonication could be observed with an unarmed eye – (Fig. 2A and B). Elemental analysis showed 95.5% ± 0.4% of carbon, 0.0% of nitrogen and 0.0% of hydrogen in the sample. Assuming that residual part of the sample was iron, ca. 4% of total iron was estimated in studied nanotube sample.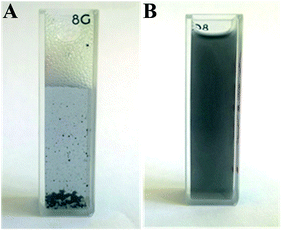 | ||
| Fig. 2 Slurries of MWCNTs in 1% Triton X-100: (A) before ultrasonication; (B) after ultrasonication. | ||
3.2. Concentration of MWCNTs in the slurries – UV-VIS analysis
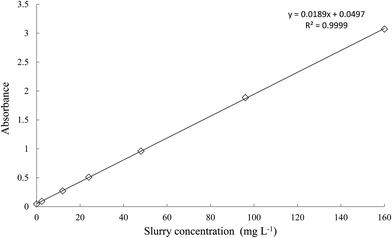
The calibration curve prepared in the range of 0 to 160 mg L−1 slurry concentration (Fig. 3) fulfilled the Lambert–Beer–Bouger Law and was used to examine the actual concentration of MWCNT in the slurries intended for further experiments.3.3. ICP-AES analysis
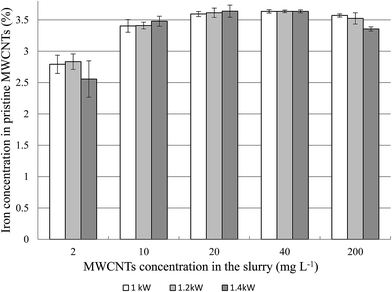 | ||
| Fig. 6 Effect of the RF power used for determination iron in the MWCNT slurries at various concentrations. | ||
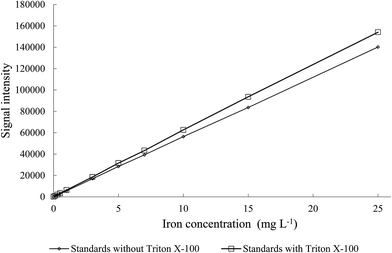
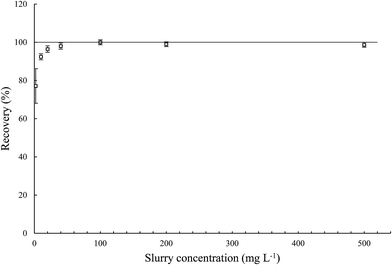
Generally, there was no statistically significant difference between results for a given slurry concentration measured in the investigated plasma power range. Increasing plasma power did not extend the working range of slurry concentration. As mentioned previously, at the lowest utilized slurry concentrations (2 mg L−1, 10 mg L−1), the obtained values were underestimated. The underestimation was also observed in the case of 1.4 kW plasma power and at the highest MWCNT concentration in the slurry. We can only speculate that during the excitation in plasma, short-lived Fe–C compounds can be created at the highest temperature (easier to exceed activation energies of formation reactions) and at the highest MWCNT concentration (high Fe–C collision frequency). Those molecular species have completely different emission and absorption spectra from “pure” Fe and C atoms, and thus if the atomization of iron is not complete it would result in lowering of the Fe concentration.
Since, no significant influence of RF power to measurement results was observed in the further research, 1.0 kW plasma power could be used as the optimal value.
3.4. Evaluation of the analytical method
Preliminary studies showed that even mineralization in a closed system using microwaves and a mixture of concentrated acids (HNO3 and H2SO4, 4![[thin space (1/6-em)]](https://www.rsc.org/images/entities/char_2009.gif) :
:![[thin space (1/6-em)]](https://www.rsc.org/images/entities/char_2009.gif) 1, v/v) did not digest the investigated nanotubes. After so-performed mineralization a lot of thick, black, floccose precipitate was still present in the mixtures. Hence, it was impossible to completely digest MWCNTs in order to directly determine the iron content in nanotubes. In addition, there are neither certified reference materials for MWCNTs nor for iron in any type of CNTs. Therefore, to test the proposed slurry method, iron was leached from iron-containing MWCNT sample using two procedures. In case of leaching with the solution of 5% nitric acid and 1% Triton X-100, less iron was transferred to the leachate (35–42%) than in the case of microwave-assisted leaching with a mixture of concentrated nitric and sulfuric acids (84–97%) – Tables 2 and 3. Also, the difference in iron content determined in the slurry prepared from the post-leaching CNTs was observed – in the first procedure: 57–64%, in the second: 2–14%. In both of these cases the iron leaching took place, but in case of microwave-assisted leaching with mixture of concentrated acids was more efficient. Unfortunately, contrary to the first case, the results of leaching were unrepeatable. The results proved that under the examined conditions, the complete leaching of iron was impossible and the use of the slurry method was necessary. To prove the correctness of iron determination in the CNTs slurry, results of a total amount of iron (determined in leachate and in slurry of post-leaching nanotubes) and the reference value were compared. The comparison showed that the sum of iron content in the leachate and iron content in post-leaching MWCNTs, calculated for different degrees of leaching, was in full agreement with the iron content in the original, tested sample, as determined by the proposed slurry method. Those comparative studies proved our assumption that iron in the leachate gives the same response in ICP-AES as iron in the residual MWCNTs slurry was justified and correct. Therefore the same calibration as for Fe in solution could be employed also for Fe in the slurry and the results obtained by the slurry method was assumed to be correct.
1, v/v) did not digest the investigated nanotubes. After so-performed mineralization a lot of thick, black, floccose precipitate was still present in the mixtures. Hence, it was impossible to completely digest MWCNTs in order to directly determine the iron content in nanotubes. In addition, there are neither certified reference materials for MWCNTs nor for iron in any type of CNTs. Therefore, to test the proposed slurry method, iron was leached from iron-containing MWCNT sample using two procedures. In case of leaching with the solution of 5% nitric acid and 1% Triton X-100, less iron was transferred to the leachate (35–42%) than in the case of microwave-assisted leaching with a mixture of concentrated nitric and sulfuric acids (84–97%) – Tables 2 and 3. Also, the difference in iron content determined in the slurry prepared from the post-leaching CNTs was observed – in the first procedure: 57–64%, in the second: 2–14%. In both of these cases the iron leaching took place, but in case of microwave-assisted leaching with mixture of concentrated acids was more efficient. Unfortunately, contrary to the first case, the results of leaching were unrepeatable. The results proved that under the examined conditions, the complete leaching of iron was impossible and the use of the slurry method was necessary. To prove the correctness of iron determination in the CNTs slurry, results of a total amount of iron (determined in leachate and in slurry of post-leaching nanotubes) and the reference value were compared. The comparison showed that the sum of iron content in the leachate and iron content in post-leaching MWCNTs, calculated for different degrees of leaching, was in full agreement with the iron content in the original, tested sample, as determined by the proposed slurry method. Those comparative studies proved our assumption that iron in the leachate gives the same response in ICP-AES as iron in the residual MWCNTs slurry was justified and correct. Therefore the same calibration as for Fe in solution could be employed also for Fe in the slurry and the results obtained by the slurry method was assumed to be correct.
| Amount of iron leached from 1 g of CNTs [mg] (A) | Mass contribution of iron determined in leachate to the total iron mass [%] (B) | Amount of iron in 1 g of CNTs after leaching [mg] (C) | Mass contribution of iron determined in solid residue to the total iron mass [%] (D) | Total amount of iron in 1 g of CNTs, sum of (A) and (C) [mg] (E) | Amount of iron in 1 g of original CNTs determined by slurry sampling [mg] (F) | Recovery (E) × 100/(F) [%] | |
|---|---|---|---|---|---|---|---|
| 1 | 13.6 | 37.57 | 22.6 | 62.43 | 36.2 | 36.4 | 102.1 |
| 2 | 15.6 | 42.13 | 21.4 | 57.87 | 36.9 | 98.6 | |
| 3 | 13.1 | 35.11 | 24.2 | 64.89 | 37.3 | 102.3 |
| Amount of iron leached from 1 g of CNTs [mg] (A) | Mass contribution of iron determined in leachate to the total iron mass [%] (B) | Amount of iron in 1 g of CNTs after leaching [mg] (C) | Mass contribution of iron determined in solid residue to the total iron mass [%] (D) | Total amount of iron in 1 g of CNTs, sum of (A) and (C) [mg] (E) | Amount of iron in 1 g of original CNTs determined by slurry sampling [mg] (F) | Recovery (E) × 100/(F) [%] | |
|---|---|---|---|---|---|---|---|
| 1 | 35.94 | 97.76 | 0.82 | 2.24 | 36.76 | 36.4 | 101.12 |
| 2 | 34.37 | 95.91 | 1.47 | 4.09 | 35.83 | 98.57 | |
| 3 | 31.45 | 84.03 | 5.98 | 15.97 | 37.43 | 102.96 |
3.5. Determination of iron in MWCNTs by the slurry sampling ICP-AES technique
Based on the previously described experiment, the optimal parameters for the MWCNT slurry sample preparation and for determination of iron in MWCNTs were established.Ten 0.1 mgL−1 MWCNT samples were ultrasonicated for 1 h in 1% Triton X-100 solution. Next, they were measured under conditions provided in Experimental section. The results are presented in Table 4. The calculated mean value of iron content in the investigated MWCNTs was in agreement with the above-established actual value. Precision of the method, evaluated as expanded uncertainty by calculating the confidence interval (95% confidence level, 10 replicates), was high and did not exceed 1.5% of the mean value. These outcomes constitute the evidence that the proposed method of determination of total iron content in MWCNTs by the slurry sampling ICP-AES technique is fully applicable.
| No. of sample | Iron concentration [%] |
|---|---|
| 1 | 3.70 |
| 2 | 3.71 |
| 3 | 3.77 |
| 4 | 3.68 |
| 5 | 3.58 |
| 6 | 3.56 |
| 7 | 3.70 |
| 8 | 3.65 |
| 9 | 3.65 |
| 10 | 3.62 |
| Mean value | 3.66 |
| u | 0.05 |
4. Conclusions
In this study, a fast, simple and versatile ICP-AES technique with slurry sample nebulization for direct iron determination in MWCNTs was presented. The influence of slurry concentration and the RF power on iron determination were examined. Generally, no significant effect of either RF power in the range of 1.0–1.4 kW or MWCNT concentration in the slurry in the range of 40–500 mg L−1 was observed. Based on those results, the iron concentration in the examined MWCNTs was established as 3.64 ± 0.05%. Precision of the proposed method was high, and did not exceed 1.5% of mean value. Using the proposed ICP-AES technique with the slurry sampling avoids the laborious, time-consuming sample preparation steps. Therefore, the proposed method may be a rapid, economic, more environmental-friendly and extensible to numerous carbon- and non-carbon nanomaterials way for direct determination of total iron content.Acknowledgements
S. Boncel thanks the National Science Centre in Poland (program SONATA, 2012/05/D/ST5/03519) the Foundation for Polish Science (39/UD/SKILLS/2015, ‘Impuls’ program) and National Science Centre & The National Centre for Research and Development (program TANGO1, TANGO1/266702/NCBR/2015), all Poland, for the financial support.Notes and references
- M. F. L. de Volder, S. H. Tawfick, R. H. Baughman and A. J. Hart, Science, 2013, 339, 535–539 CrossRef CAS PubMed
.
- Y. Lin, S. Taylor, H. Li, K. A. S. Fernando, L. Qu, W. Wang, L. Gu, B. Zhou and Y.-P. Sun, J. Mater. Chem., 2004, 14, 527 RSC
.
- C. Ge, F. Lao, W. Li, Y. Li, C. Chen, Y. Qiu, X. Mao, B. Li, Z. Chai and Y. Zhao, Anal. Chem., 2008, 80, 9426–9434 CrossRef CAS PubMed
.
- R. Rastogi, R. Kaushal, S. K. Tripathi, A. L. Sharma, I. Kaur and L. M. Bharadwaj, J. Colloid Interface Sci., 2008, 328, 421–428 CrossRef CAS PubMed
.
- L. Ayouni-Derouiche, M. Méjean, P. Gay, M.-L. Milliand, P. Lantéri, L. Gauthier and E. Flahaut, Carbon, 2014, 80, 59–67 CrossRef CAS
.
- N. Kuźnik, M. M. Tomczyk, S. Boncel, A. P. Herman, K. K. K. Koziol and M. Kempka, Mater. Lett., 2014, 136, 34–36 CrossRef
.
- C. M. Chen, M. Chen, Y.-W. Peng, H.-W. Yu and C.-F. Chen, Thin Solid Films, 2006, 498, 202–205 CrossRef CAS
.
- K. L. Strong, D. P. Anderson, K. Lafdi and J. N. Kuhn, Carbon, 2003, 41, 1477–1488 CrossRef CAS
.
- S. Scaccia, M. Carewska and P. P. Prosini, Thermochim. Acta, 2005, 435, 209–212 CrossRef CAS
.
- T. Kolodiazhnyi and M. Pumera, Small, 2008, 4, 1476–1484 CrossRef CAS PubMed
.
- B. Cavness, J. Heimbecker, J. Velasquez and S. Williams, Radiat. Phys. Chem., 2012, 81, 131–134 CrossRef CAS
.
- T. Braun, H. Rausch, L. P. Bíró, Z. Konya and I. Kiricsi, J. Radioanal. Nucl. Chem., 2004, 262, 31–34 CrossRef CAS
.
- R. Zeisler, R. L. Paul, R. Oflaz Spatz, L. L. Yu, J. L. Mann, W. R. Kelly, B. E. Lang, S. D. Leigh and J. Fagan, Anal. Bioanal. Chem., 2011, 399, 509–517 CrossRef CAS PubMed
.
- P. A. Mello, L. F. Rodrigues, M. A. G. Nunes and J. C. P. Mattos, Instrumentation, 2011, 22, 1040–1049 CAS
.
- S. Boncel and K. K. K. Koziol, Appl. Surf. Sci., 2014, 301, 488–491 CrossRef CAS
.
- M. Mujuru, R. I. McCrindle, B. M. Botha and P. P. Ndibewu, Fuel, 2009, 88, 719–724 CrossRef CAS
.
- Z. Wang, Z. Ni, D. Qiu, T. Chen, G. Tao and P. Yang, J. Anal. At. Spectrom., 2004, 19, 273 RSC
.
- J. Bok-Badura, A. Jakóbik-Kolon, M. Turek, J. Szczerba, M. Lemanowicz and K. Karoń, Spectrochim. Acta, Part B, 2015, 113, 79–83 CrossRef CAS
.
- L. Marjanovic, R. I. McCrindle, B. M. Botha and J. Hermanus Potgieter, J. Anal. At. Spectrom., 2000, 15, 983–985 RSC
.
- S. Boncel, K. K. K. Koziol, K. Z. Walczak, A. H. Windle and M. S. P. Shaffer, Mater. Lett., 2011, 65, 2299–2303 CrossRef CAS
.
- P. Randhawa, J.-S. Park, S. Sharma, P. Kumar, M.-S. Shin and S. S. Sekhon, J. Nanoelectron. Optoelectron., 2012, 7, 279–286 CrossRef CAS
.
- L. Ebdon, M. Foulkes and K. Sutton, J. Anal. At. Spectrom., 1997, 12, 213–229 RSC
.
- M. Henryk, in Advances in Atomic Spectroscopy, 2002, vol. 7, pp. 237–248 Search PubMed
.
| This journal is © The Royal Society of Chemistry 2015 |

