 Open Access Article
Hierarchically porous organic polymers: highly enhanced gas uptake and transport through templated synthesis†
Sanjiban
Chakraborty
a,
Yamil J.
Colón
b,
Randall Q.
Snurr
b and
SonBinh T.
Nguyen
*a
aDepartment of Chemistry and the International Institute for Nanotechnology, Northwestern University, 2145 Sheridan Road, Evanston, Illinois 60208-3113, USA. E-mail: stn@northwestern.edu
bDepartment of Chemical & Biological Engineering, Northwestern University, 2145 Sheridan Road, Evanston, IL 60208, USA
First published on 16th September 2014
Abstract
Porous organic polymers (POPs) possessing meso- and micropores can be obtained by carrying out the polymerization inside a mesoporous silica aerogel template and then removing the template after polymerization. The total pore volume (tpv) and specific surface area (ssa) can be greatly enhanced by modifying the template (up to 210% increase for tpv and 73% for ssa) as well as by supercritical processing of the POPs (up to an additional 142% increase for tpv and an additional 32% for ssa) to include larger mesopores. The broad range of pores allows for faster transport of molecules through the hierarchically porous POPs, resulting in increased diffusion rates and faster gas uptake compared to POPs with only micropores.
Introduction
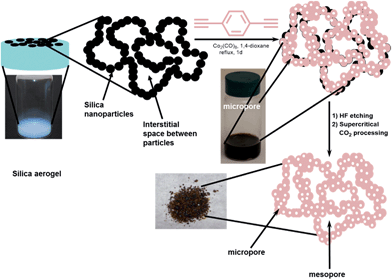
The past decade has witnessed a surge in the development of porous organic polymers (POPs) due to their wide range of promising applications in catalysis,1–7 gas storage,8–14 and chemical separations.4,15–17 The well-defined micropores of the POPs make them good candidates for such applications. However, the presence of micropores, without additional larger mesopores, can often limit molecular diffusion, as observed in microporous zeolites.18 Unfortunately, this shortcoming in the transport properties of POP materials has been inadvertently ignored by the majority of POP synthetic strategies reported thus far, especially when the research focus has been on the measurement of static properties. Recently, we have reported that preserving the interparticle mesopores in a microporous porphyrin POP through supercritical CO2 processing can indeed lead to an increase in the rate of phosphate ester methanolysis by almost an order of magnitude.19 Given this, we were intrigued by the possibility of engineering mesopores into POPs as part of the synthesis, where POPs are made on a mesoporous template that could eventually be dissolved. Further processing with supercritical CO2 may then enable us to access even larger interparticle mesopores. The resulting POP materials would then have a hierarchical pore system where micropores provide the specific molecular-level interactions needed for storage, separation, or catalysis while the larger meso/macropores allow for enhanced diffusion and mass transfer throughout the entire POP volume.To incorporate larger pores into POPs, we adopted a synthetic strategy that is a cross between those used in the syntheses of mesoporous silica20 and mesopore-containing zeolites.21 We selected a mesoporous silica aerogel as a template that can be infiltrated with a solution of the desired monomers for POP synthesis (Fig. 1). Crosslinking of the building blocks inside the pores of the template, followed by HF-dissolution of the silica, then creates a hierarchically porous structure with a mixture of micropores (from the POP synthesis) and larger mesopores (presumably from the interstitial spaces between the silica particles that made up the aerogel template). As described below, we have successfully synthesized a series of POPs possessing both micro- and mesopores using this aerogel-templating strategy. By modifying the chemical functionalities of the aerogel template and employing supercritical CO2 processing, the surface areas and the pore size distributions of these POPs can be readily tuned across a broad hierarchy of pore sizes.
Results and discussion
To demonstrate that hierarchically porous POPs can be made using the aerogel-templating strategy, we selected the cobalt-catalyzed trimerization of 1,4-diethynylbenzene (1) as the POP-forming reaction. This reaction starts with an abundantly available monomer, can be carried out easily in a broad range of solvents, and has a short reaction time. In addition, the aromatic network that is formed is robust enough to tolerate the final HF-etching step. As Co-catalyzed alkyne trimerization reactions had been carried out in a mixture of water and methanol,22 we were confident that the CoII metallacyclopentadiene intermediate in this reaction could tolerate the Si–OH groups of the silica aerogel template. We note that the cobalt-catalyzed trimerization of 1,4-diethynylbenzene has been used previously to produce a POP with a surface area of 1030 m2 g−1.23We synthesized the silica aerogel template from commercially available Silbond-H, a pre-polymerized tetraethyl orthosilicate (TEOS) precursor (see ESI,† Section S2). The aerogel product is a monolithic column that completely filled the bottom portion of the vial without any macroscopic cracks between it and the wall of the vial (Fig. 1, left image). This then allowed the added monomer-catalyst [1 + Co2(CO)8] solution to completely fill the volume occupied by the gel monolith and confined the subsequent polymerization to the pores of the aerogel. After polymerization, the silica network in the resulting solid could be dissolved away to leave behind the desired aerogel-templated POP1|a as a dark powder (Fig. 1, bottom right image; see also ESI,† Section S4). As a comparison, we also made POP1 in the absence of the aerogel template following the protocol established by Yu, Liu, and coworkers.23 The SEM images of POP1 and POP1|a (ESI,† Fig. S8) suggest that these materials are indeed quite different: while the latter comprises aggregates of clearly defined small nanoparticles, the nanoparticles have “coalesced” into larger pieces in the former, with not much interstitial space between the pieces.
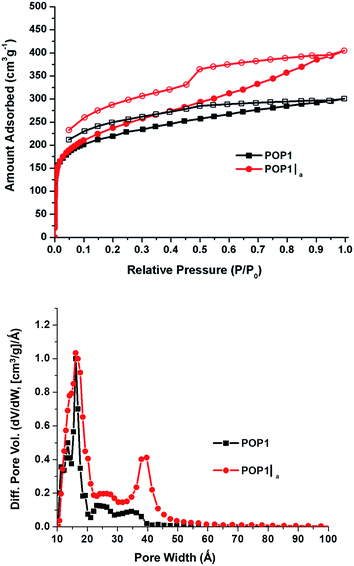
The N2 gas adsorption–desorption data for POP1 and the aerogel-templated POP1|a (Fig. 2, top) revealed distinct differences in the nature of the pores in these two materials. The upward slope in the adsorption branch of the isotherm for POP1|a, which becomes steeper at higher pressures, has been attributed to the presence of pores that are larger than the typical micropores.24 The hysteresis in the isotherm for POP1|a has a distinct step in the desorption branch, indicating that the pores are not all slit-like.24 Not surprisingly, POP1|a has an increased surface area1 (910 m2 g−1, Table 1, entry 2) compared to that of POP1 (800 m2 g−1, Table 1, entry 1). Notably, the total pore volume of POP1|a (0.59 cm3 g−1, Table 1, entry 2) has increased significantly (by 41%) from that of POP1 (0.42 cm3 g−1, Table 1, entry 1) while its micropore volume (calculated from the t plot method) remains the same as that of POP1. Thus, the additional gain in pore volume in POP1|a can indeed be attributed to the introduction of larger pores through the aerogel template. This gain is more apparent in the pore size distribution plot for POP1|a, which exhibits a broad peak (∼40 Å) in the mesopore region (Fig. 2, bottom). As expected, POP1|a shows a corresponding increase in the external surface area—i.e., the surface area of all non-micropores—(410 m2 g−1, Table 1, entry 2) compared to that of POP1 (250 m2 g−1; Table 1, entry 1).
| Entry | POP | Specific surface area (ssa) (m2 g−1) | Total pore volumeb (tpv) (cm3 g−1) | Micropore volumea (cm3 g−1) | Micropore surface areaa (m2 g−1) | External surface areaa (m2 g−1) | Percent increase in tpv and (ssa) (%) |
|---|---|---|---|---|---|---|---|
| a Obtained using t plot method (see ESI, Section S1). b Total pore volume is obtained from BET data up to P/P0 = 1 and is defined as the sum of micropore volume and volumes of larger pores. | |||||||
| 1 | POP1 | 800 | 0.42 | 0.23 | 550 | 250 | 0 (0) |
| 2 | POP1|a | 910 | 0.59 | 0.22 | 500 | 410 | 41 (14) |
| 3 | POP1|a-TMS | 1380 | 1.30 | 0.23 | 490 | 890 | 210 (73) |
| 4 | POP1|a-Ph | 1250 | 0.99 | 0.21 | 490 | 760 | 136 (56) |
| 5 | scp POP1|a | 1590 | 1.70 | 0.19 | 450 | 1150 | 305 (99) |
| 6 | scp POP1|a-TMS | 1640 | 1.90 | 0.20 | 440 | 1200 | 352 (105) |
| 7 | scp POP1|a-Ph | 1640 | 1.90 | 0.19 | 430 | 1210 | 352 (105) |
To assess whether it is necessary to have a monolithic25 aerogel template firmly affixed in a vial for the confined synthesis of POP1|a, we crushed an aerogel monolith into a powder and carried out POP synthesis using the same conditions described above (see ESI,† Section S5). The N2 gas adsorption–desorption and pore size distribution data for these POP1|a-crushed materials (ESI,† Fig. S4) are essentially the same as those for POP1: there is no gain in either the external surface area or the amount of mesopores (ESI,† Table S2). This clearly illustrates the need for a monolithic template that completely fills the reaction volume in which the POP synthesis takes place. When the monolith is broken into loosely packed individual chunks that resemble chromatographic silica gel powder, the total volume that this powder occupies decreases compared to that of the monolith and there is a large amount of macroscopic “empty” space where the silica is not present. In such a case, if we employ the same polymerization reaction volume as that used in the monolith, a significant portion of the polymerization will occur in this “empty” volume and the resulting polymer will have mostly micropores. As a result, the final POP1|a-crushed material is actually quite similar to POP1, the POP synthesized without template, and no enhancement in mesoporosity is observed.
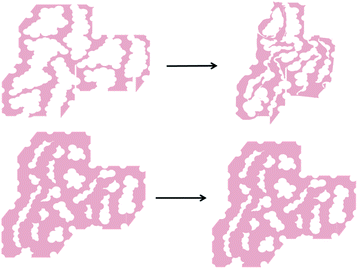
Our model (Fig. 1) suggests that the mesopores in POP1|a primarily arise from the extensive mesoporous interstitial space between the silica gel nanoparticles in the aerogel template (>94% of the ssa is external surface area and >99% of the total pore volume is mesopore volume; see ESI,† Table S1).26 If this is indeed the case, while our initial gain in external surface area (∼160 m2 g−1) for POP1|a is promising, it is only a fraction of the very large portion of external surface area that was present in the original aerogel template.27 We hypothesize that this discrepancy may be caused by the loss of the mesopores upon dissolution of the silica gel template. Specifically, if the polymerization shown in Fig. 1 does not generate a mechanically robust network of cross-linked polymer, dissolution of the silica gel template may result in the collapse of such mesopores and a subsequent loss of external surface area (Fig. 3, top).
One strategy for avoiding potential collapse of the templated POP network upon work up, and increasing the retention of mesoporosity in the resulting POP, is to strengthen the polymer network. This may be accomplished by increasing the interaction between the organic component (monomer/polymer) and the inorganic silica aerogel template during polymerization. Such increased interaction may lead to a thicker polymer “coating” of the silica nanoparticles during the polymerization process and a more mechanically robust network of cross-linked polymer (Fig. 3, bottom). Such a network would be better able to retain the mesopores upon dissolution of the silica gel template, resulting in a higher external surface area for the final POP.
To explore the aforementioned hypothesis, we post-synthetically modified the surface hydroxyl groups of the silica aerogel with either trimethylchlorosilane (TMCS) or phenyltriethoxysilane (PTES) (ESI,† Section S3). Such “capping” with hydrophobic organic groups does not significantly change the surface area of the aerogel (ESI,† Fig. S2) but should allow the resulting surface to interact strongly with the hydrophobic dialkyne monomer 1 and the Co-based propagating species, creating a more mechanically robust network. The resulting POP materials can then better tolerate the processing conditions and have larger total pore volumes and external surface areas. This is indeed the case. BET analyses of POP1|a-TMS and POP1|a-Ph—the two materials producing by polymerizing 1,4-dialkynebenzene inside the trimethyl- and phenyl-modified aerogels, respectively—revealed highly enhanced surface areas (1380 and 1250 m2 g−1, respectively; ESI,† Fig. S5). Most impressive are the large gains in total pore volumes (68–120%) and external surface areas (85–117%) for both of these materials compared to POP1|a (Table 1, cf. entries 2–4). Of course, we cannot discount contributions from increases in the interstitial space between the organic-modified aerogel particles that might have occurred as a result of the steric “capping” by TMS and Ph groups. Such modification of the surface of the silica gel nanoparticles has been shown to prevent them from excessive shrinking upon drying28,29 (see also ESI,† Fig. S12) and can contribute to the increased external surface area of the modified templates. Due to the lengthy modification process (ESI,† Section S3), we have not attempted to control the extent of modification and determine the relative contributions of these two factors. Interestingly, while the pore size distributions for POP1|a-TMS and POP1|a-Ph are very different from those of POP1 and POP1|a (Fig. 4 and Table 1), they are very similar to each other.
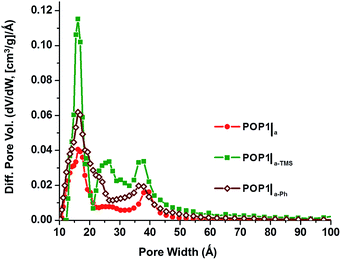 | ||
| Fig. 4 Pore size distributions based on DFT calculations (slit–pore model) for POP1|a (red circles), POP1|a-TMS (green squares), and POP1|a-Ph (brown diamonds). | ||
Up to this point, our results clearly indicate that the confined syntheses of POP1 inside silica aerogel templates can indeed generate a significant amount of mesopores. While this is quite exciting, the surface area and porosity data that we have obtained thus far are for materials that have been thermally activated (i.e., heat-treated under vacuum) prior to surface characterization. Although thermal activation is a commonly employed protocol for many porous solids such as zeolites, mesoporous silica, and MOFs, recent research has indicated that fast solvent removal during such a process may lead to strong capillary actions that collapse interstitial pores or pore apertures, resulting in low overall surface areas and pore accessibilities for both MOFs30,31 and POPs.19 Following the protocol established by Totten et al.,19 we activated all three of our hierarchically porous POPs using supercritical CO2 processing instead of thermal activation. Gratifyingly, the supercritical CO2-processed POPs (scpPOP1|a, scpPOP1|a-TMS, and scpPOP1|a-Ph) display significant increases in both external surface areas (34–179%) and total pore volumes (46–188%) in comparison to the thermally activated samples (Table 1, cf. entries 5–7 and entries 2–4). Most notably, the N2 isotherms for the supercritical CO2-processed materials are all Type II with pronounced hysteresis (Fig. 5, top panel; see also ESI,† Fig. S6). The presence of pores that are larger than 20 Å is clearly indicated by the steep upward-sloping trend of the isotherm at high pressures (P/P0 > 0.9). Indeed, the pore size distributions for these materials all display broad mesoporous regions with several peaks extending over a wide range of pore diameters (Fig. 5, bottom panel; see also ESI,† Fig. S7). Comparing to the data shown in Fig. 4, these data suggest that even larger mesopores (>50 Å) exist in the interstitial space between the POP nanoparticles and can indeed be preserved by supercritical CO2 processing.
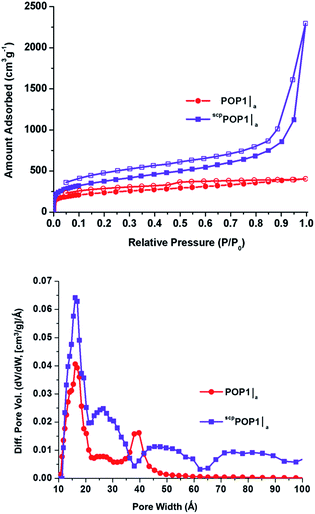 | ||
| Fig. 5 (Top) N2 isotherms measured at 77 K of POP1|a (red circles) and supercritical CO2-processed POP-A (scpPOP1|a – purple squares). Closed symbols, adsorption; open symbols, desorption. (Bottom) pore size distributions based on DFT calculations (slit–pore model) for POP1|a (red circles) and scpPOP1|a (purple squares). See ESI† for the isotherms (Fig. S6) and pore size distributions (Fig. S7) of other supercritical CO2-processed POPs. | ||
To assess the transport advantage of having large mesopores integrated into POP1, we compared the time-dependence for propane uptake in POP1, POP1|a, scpPOP1|a, POP1|a-TMS, and POP1|a-Ph at 0.3 bar and 298 K (Fig. 6). The hierarchically porous POPs (POP1|a, scpPOP1|a, POP1|a-TMS, and POP1|a-Ph) all adsorb propane much faster than the parent POP1. As quantified by the diffusional time constants for propane transport through the POP materials (given by D/r2, where D is the diffusion coefficient and r is the characteristic length scale, as defined in the ESI,† Section S15), the hierarchically porous POPs adsorb propane at a rate that is a factor of 4 to 8 times faster than that for POP1 (see ESI,† Table S4). These improved diffusion characteristics may comprise a clear advantage for applications in separation, catalysis, and sensing.
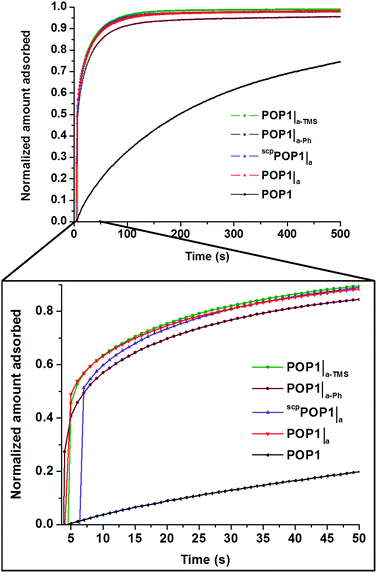 | ||
Fig. 6 Time-dependent propane-uptake profiles for POP1, POP1|a, scpPOP1|a, POP1|a-TMS, and POP1|a-Ph at 0.3 bar and 298 K. Data in each profile were normalized to the maximum uptake values at 15![[thin space (1/6-em)]](https://www.rsc.org/images/entities/char_2009.gif) 000 s (see complete set of data in the ESI,† Fig. S13). 000 s (see complete set of data in the ESI,† Fig. S13). | ||
Conclusions
In summary, we have demonstrated that hierarchically porous POPs containing both meso- and micropores can be realized by carrying out the synthesis of a microporous POP inside a monolithic mesoporous silica aerogel template followed by dissolving away the template in a manner that preserves the larger pores. The total pore volumes and specific surface areas can be increased (up to 210 and 73%, respectively) without altering the micropore volumes through the use of a hydrophobic aerogel template that interacts better with the monomer and polymer. Supercritical CO2 processing of these POPs can further enhance the total pore volumes (by an additional 142%) and specific surface areas (by an additional 32%) and by preventing the loss of large (i.e., >50 Å) interparticle mesopores during thermal activation. The utility of having the additional hierarchy of mesopores in POPs is clearly apparent through the faster uptake of propane by the hierarchical POPs, illustrating highly facile diffusion that should be highly advantageous in catalysis, separation, and sensing. We are currently exploring such applications.Acknowledgements
S.C was initially supported by the Institute for Atom-efficient Chemical Transformations (IACT), an Energy Frontier Research Center funded by the U.S Department of Energy, Office of Science, Office of Basic Energy Sciences. R.Q.S. and S.T.N acknowledge subsequent support from DTRA (HDTRA1-14-1-0014). Y.J.C. is an NSF Graduate Research Fellow (Grant no. DGE-0824162). Experimental facilities at the Integrated Molecular Structure Education and Research Center (IMSERC), and the EPIC facility in the Northwestern University Atomic- and Nanoscale Characterization Experimental Center, both at Northwestern University, were purchased with grants from NSF-NSEC, NSF-MRSEC, Keck Foundation, the state of Illinois, and Northwestern University. Instruments in the Northwestern University sorption laboratory were purchased with grants from the DOE, the NSF, and Micromeritics Instrument Corporation.Notes and references
- Y. Zhang and S. N. Riduan, Chem. Soc. Rev., 2012, 41, 2083–2094 RSC.
- Z. Xie, C. Wang, K. E. deKrafft and W. Lin, J. Am. Chem. Soc., 2011, 133, 2056–2059 CrossRef CAS PubMed.
- A. M. Shultz, O. K. Farha, J. T. Hupp and S. T. Nguyen, Chem. Sci., 2011, 2, 686–689 RSC.
- N. B. McKeown and P. M. Budd, Chem. Soc. Rev., 2006, 35, 675–683 RSC.
- H. J. Mackintosh, P. M. Budd and N. B. McKeown, J. Mater. Chem., 2008, 18, 573–578 RSC.
- P. Kaur, J. T. Hupp and S. T. Nguyen, ACS Catal., 2011, 1, 819–835 CrossRef CAS.
- J.-X. Jiang, C. Wang, A. Laybourn, T. Hasell, R. Clowes, Y. Z. Khimyak, J. Xiao, S. J. Higgins, D. J. Adams and A. I. Cooper, Angew. Chem., Int. Ed., 2011, 50, 1072–1075 CrossRef CAS PubMed.
- T. Ben, H. Ren, S. Ma, D. Cao, J. Lan, X. Jing, W. Wang, J. Xu, F. Deng, J. M. Simmons, S. Qiu and G. Zhu, Angew. Chem., Int. Ed., 2009, 48, 9457–9460 CrossRef CAS PubMed.
- Q. Chen, M. Luo, P. Hammershøj, D. Zhou, Y. Han, B. W. Laursen, C.-G. Yan and B.-H. Han, J. Am. Chem. Soc., 2012, 134, 6084–6087 CrossRef CAS PubMed.
- A. I. Cooper, Adv. Mater., 2009, 21, 1291–1295 CrossRef CAS.
- B. G. Hauser, O. K. Farha, J. Exley and J. T. Hupp, Chem. Mater., 2013, 25, 12–16 CrossRef CAS.
- M. G. Rabbani and H. M. El-Kaderi, Chem. Mater., 2011, 23, 1650–1653 CrossRef CAS.
- J. Weber and A. Thomas, J. Am. Chem. Soc., 2008, 130, 6334–6335 CrossRef CAS PubMed.
- D. Yuan, W. Lu, D. Zhao and H.-C. Zhou, Adv. Mater., 2011, 23, 3723–3725 CrossRef CAS PubMed.
- M. G. Rabbani and H. M. El-Kaderi, Chem. Mater., 2012, 24, 1511–1517 CrossRef CAS.
- G. Peterson, O. Farha, B. Schindler, P. Jones, J. Mahle and J. Hupp, J. Porous Mater., 2012, 19, 261–266 CrossRef CAS.
- O. K. Farha, A. M. Spokoyny, B. G. Hauser, Y.-S. Bae, S. E. Brown, R. Q. Snurr, C. A. Mirkin and J. T. Hupp, Chem. Mater., 2009, 21, 3033–3035 CrossRef CAS.
- C. M. A. Parlett, K. Wilson and A. F. Lee, Chem. Soc. Rev., 2013, 42, 3876–3893 RSC.
- R. K. Totten, Y.-S. Kim, M. H. Weston, O. K. Farha, J. T. Hupp and S. T. Nguyen, J. Am. Chem. Soc., 2013, 135, 11720–11723 CrossRef CAS PubMed.
- F. Hoffmann, M. Cornelius, J. Morell and M. Fröba, Angew. Chem., Int. Ed., 2006, 45, 3216–3251 CrossRef CAS PubMed.
- H. Chen, J. Wydra, X. Zhang, P.-S. Lee, Z. Wang, W. Fan and M. Tsapatsis, J. Am. Chem. Soc., 2011, 133, 12390–12393 CrossRef CAS PubMed.
- M. S. Sigman, A. W. Fatland and B. E. Eaton, J. Am. Chem. Soc., 1998, 120, 5130–5131 CrossRef CAS.
- S. Yuan, B. Dorney, D. White, S. Kirklin, P. Zapol, L. Yu and D.-J. Liu, Chem. Commun., 2010, 46, 4547–4549 RSC.
- P. Pandey, O. K. Farha, A. M. Spokoyny, C. A. Mirkin, M. G. Kanatzidis, J. T. Hupp and S. T. Nguyen, J. Mater. Chem., 2011, 21, 1700–1703 RSC.
- Herein, we employed the definition of monolith as “being casted as a single macroscopic piece.” Morphologically, the aerogel monolith is made up of chain of silica gel particles. See the ESI,† Fig. S12 for SEM images of the aerogels.
- While some of the mesopores in POP1|a may be generated from the dissolved-away silica nanoparticles (∼10–20 nm in size, see N. Leventis, Acc. Chem. Res., 2007, 40, 874–884 CrossRef CAS PubMed ) that make up the gel, this portion is probably insignificant.
- R. Al-Oweini and H. El-Rassy, Appl. Surf. Sci., 2010, 257, 276–281 CrossRef CAS PubMed.
- P. B. Sarawade, J.-K. Kim, A. Hilonga and H. T. Kim, Solid State Sci., 2010, 12, 911–918 CrossRef CAS PubMed.
- A. P. Rao, A. V. Rao and G. M. Pajonk, Appl. Surf. Sci., 2007, 253, 6032–6040 CrossRef CAS PubMed.
- A. P. Nelson, O. K. Farha, K. L. Mulfort and J. T. Hupp, J. Am. Chem. Soc., 2008, 131, 458–460 CrossRef PubMed.
- O. K. Farha and J. T. Hupp, Acc. Chem. Res., 2010, 43, 1166–1175 CrossRef CAS PubMed.
Footnote |
| † Electronic supplementary information (ESI) available: Complete procedures for the synthesis of hierarchically porous organic polymers and characterization data (gas adsorption–desorption isotherms, pore size distribution graphs, SEM images, and density data). Detailed procedures for propane uptake experiments and calculation of diffusion constants. See DOI: 10.1039/c4sc02502d |
| This journal is © The Royal Society of Chemistry 2015 |

