 Open Access Article
Creative Commons Attribution 3.0 Unported Licence
Magnetic anisotropy of endohedral lanthanide ions: paramagnetic NMR study of MSc2N@C80-Ih with M running through the whole 4f row†
Y.
Zhang
,
D.
Krylov
,
M.
Rosenkranz
,
S.
Schiemenz
and
A. A.
Popov
*
Leibniz Institute for Solid State and Materials Research, 01069 Dresden, Germany. E-mail: a.popov@ifw-dresden.de
First published on 28th January 2015
Abstract
Paramagnetic and variable temperature 13C and 45Sc nuclear magnetic resonance studies are performed for nitride clusterfullerenes MSc2N@C80 with icosahedral Ih(7) carbon cage, where M runs through all lanthanides forming nitride clusters. The influence of the endohedral lanthanide ions on the NMR spectral pattern is carefully followed, and dramatic differences are found in peak positions and line widths. Thus, 13C lines broaden from 0.01–0.02 ppm in diamagnetic MSc2N@C80 molecules (M = La, Y, Lu) to several ppm in TbSc2N@C80 and DySc2N@C80. Direction of the paramagnetic shift depends on the shape of the 4f electron density in corresponding lanthanide ions. In TmSc2N@C80 and ErSc2N@C80 with prolate 4f-density of lanthanide ions, 13C signals are shifted down-field, whereas 45Sc peaks are shifted up-field versus diamagnetic values. In all other MSc2N@C80 molecules lanthanide ions have oblate-shaped 4f electron density, and the lanthanide-induced shift is negative for 13C and positive for 45Sc peaks. Analysis of the pseudocontact and contact contributions to chemical shifts revealed that the pseudocontact term dominates both in 13C and 45Sc NMR spectra, although contact shifts for 13C signals are also considerable. Point charge computations of the ligand field splitting are performed to explain experimental results, and showed reasonable agreement with experimental pseudocontact shifts. Nitrogen atom bearing large negative charge and located close to the lanthanide ion results in large magnetic anisotropy of lanthanide ions in nitride clusterfullerenes with quasi-uniaxial ligand field.
Introduction
The molecules of endohedral metallofullerenes (EMFs) comprise the fullerene cage encapsulating one to three metal ions or a more complex hybrid cluster.1 Shielding magnetic ions (such as lanthanides) inside the carbon cage protects their spin states from the environment making EMFs potentially useful for spintronics applications. Numerous studies of magnetic properties of EMFs reported before 2012 did not reveal any deviation from paramagnetic behaviour, although the influence of the magnetic anisotropy of endohedral lanthanide ions on the measured magnetic moments was proposed.2 However, in 2012 it was discovered that DySc2N@C80 exhibits slow magnetization reversal at helium temperatures.3 The presence of hysteresis in the magnetization curves measured below 5 K indicated that this EMF can be classified as a single molecule magnet (SMM). In subsequent studies, the SMM behaviour was also found in Dy2ScN@C80 (ref. 4) and HoSc2N@C80,5 and more EMF-based SMM are likely to be discovered in the near future. Importantly, both DySc2N@C80 and Dy2ScN@C80 exhibit unusually long attempt times, which are orders of magnitude longer than in other lanthanide-based SMMs.One of the most important factors determining the SMM behaviour of lanthanide molecular magnets is the single ion magnetic anisotropy.6 Reliable elucidation of the ligand-field (LF) splitting of the 4fn total momentum states is crucial (although not sufficient) for the correct description of magnetic properties of lanthanide SMMs. Despite the understanding that the magnetic anisotropy is an important factor determining magnetic properties of EMF, a consistent description of the LF effects in EMF has not been provided yet. The first dedicated studies of the LF in nitride clusterfullerenes have been published only recently and were motivated by the discovery of SMM behaviour in DySc2N@C80 and Dy2ScN@C80. According to the ab initio computations at the CASSCF level,7 the LF splitting in DySc2N@C80 is so large that its magnetization behavior at low temperature is determined solely by the ground state of the 6H15/2 manifold. Namely, the gap between the ground (mJ = ±15/2) and the first excited (mJ = ±13/2) magnetic states was predicted to be 373–415 cm−1 (ref. 7a) or 485 cm−1 (ref. 7b). Likewise, magnetization curves of DySc2N@C80 and HoSc2N@C80 measured by SQUID below 10 K are also described by only one state with mJ = ±15/2 (Dy) or mJ = ±8 (Ho).4,5 The information about excited magnetic states might be revealed from magnetizations studies at higher temperatures (e.g., the population of the mJ = ±13/2 state in DySc2N@C80 near room temperature is expected to be ca. 10%). However, with the increase of the temperature the total magnetization of the sample is decreasing dramatically and can hardly be measured reliably when only limited amount of sample is available (as it is often the case with EMF SMMs). An alternative might be the use of spectroscopic techniques, such as analysis of the fine structure in the lanthanide-based luminescence spectrum.8 Unfortunately, the fullerene cages of EMFs absorb light in the visible range and hence block the possibility to observe the lanthanide-based luminescence for a majority of 4f elements. So far, metal-based luminescence in EMFs could be detected only for endohedral Er3+ ions emitting in the near-IR range.9
Solution nuclear magnetic resonance (NMR) studies can provide complimentary information on the magnetic anisotropy of lanthanide ions for the temperatures not well accessible by direct magnetization measurements. The chemical shift of a nuclei in a paramagnetic compound can be described as a sum of diamagnetic and paramagnetic terms, δexp = δdia + δpara. In due turn, the paramagnetic shift has two major contributions, contact δcon and pseudocontact δpc.10 The contact (Fermi) shift results from the interaction between the nuclear spin (of 13C or 45Sc atoms in this work) and the spin-polarized electron density of the molecule (in particular in the region close to the nuclei of interest). As such, the contact shift is proportional to the hyperfine coupling constant weighed with the expectation value of the spin operator Sz of the lanthanide. The pseudocontact shift is caused by dipolar through-space interactions of the nuclear and electronic magnetic dipoles. For an i-th atom in a lanthanide-containing molecule the pseudocontact shift can be computed as:
 | (1a) |
 | (1b) |
As can be seen in eqn (1), the pseudocontact shift contains information on the molecular structure and on the magnetic properties of the paramagnetic center. Paramagnetic NMR is therefore a popular structure elucidation tool for metal complexes, polymers or biomolecules.10b,c,11 At the same time, it can be also used to determine or verify LF parameters in lanthanide complexes.12 The prerequisite for both types of application of NMR spectroscopy in the studies of paramagnetic molecules is the possibility to separate contact and pseudocontact contributions,13 since only the latter brings necessary information about molecular structure and magnetic anisotropy.
In the field of endohedral metallofullerenes, paramagnetic NMR was mainly used for the structural studies. Several Ce-EMFs,14 anion of Pr@C82,15 three isomers of Tm@C82,16 Sm@C80,17 and Sm@C82 (ref. 18) were characterized by 13C NMR. The variable-temperature 45Sc NMR study was also reported for CeSc2N@C80.19 The dominant contribution of the pseudocontact shift in Ce-EMFs was postulated based on the analysis of the temperature dependence in the framework of Bleaney's theory. The size of the contact term contribution in the paramagnetic NMR spectra of EMFs remains unclear. Our group recently reported paramagnetic NMR study of HoM2N@C80 and Ho2MN@C80 (M = Sc, Y, Lu).2013C and 45Sc signals of these molecules could be identified in spite of the severe broadening induced by Ho3+ ions. This study showed that paramagnetic NMR spectroscopy when combined with the analysis of the ligand field splitting, can provide information on the magnetic state of lanthanide ions in EMFs.
In this work we report on a systematic paramagnetic NMR study of MSc2N@C80 compounds with all lanthanides forming nitride clusterfullerenes (M = La, Ce, Pr, Nd, Gd, Tb, Dy, Ho, Er, Tm) and concomitant calculations of the ligand field splitting in these molecules. The main goal is to provide a consistent and uniform description of the magnetic states of lanthanide ions in these molecules based on the ligand field computations verified by experimental NMR data. The manuscript is organized in several parts. First, we describe the results of experimental NMR measurements, including the temperature dependence and relaxation times. Then, we perform a thorough analysis of the NMR data to separate contact and pseudocontact contributions to paramagnetic shifts. This section is followed by the brief analysis of the molecular structures. Then point-charge calculations of the ligand field splitting are described, which give the desired description of the single ion magnetic anisotropy in the series of MSc2N@C80 molecules across the whole 4f row. Reliability of the computed LF patterns is then verified by comparison of the computed and experimental pseudocontact shifts.
Experimental and computational details
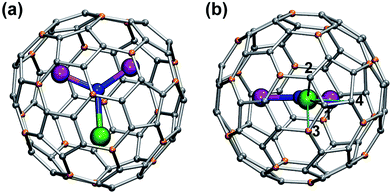
In this work we will consider exclusively MSc2N@C80 compounds with the Ih(7) carbon cage (Fig. 1). Hereafter the compounds will be abbreviated as 1M, where M denotes the corresponding lanthanide (e.g., LaSc2N@C80 is denoted hereafter as 1La). All studied compounds were synthesized using the arc-discharge method in the presence of nitrogen source such as NH3 (ref. 21) or guanidine thiocyanate,22 and then separated using chromatography as described in the ESI Fig. S1–S5.† The synthesis of 1Ce,231Nd,241Pr,231Dy,241Ho,20b and 1Lu24 in our group was described earlier. 1La, 1Pr, 1Tb, 1Er and 1Tm were synthesized for this work using guanidine thiocyanate as a nitrogen source, whereas 1Tb and 1Y were synthesized using NH3 as a reactive gas. Note that the synthesis and characterization of 1Y,251La,261Ce,191Tb,27 and 1Er28 was also reported by other groups using somewhat different conditions. Gd also forms mixed-metal nitride clusterfullerenes with Sc,29 but neither 13C nor 45Sc NMR signals could be detected for 1Gd, so this molecule will not be discussed hereafter.The 125 MHz 13C NMR and 121.5 MHz 45Sc NMR measurements were performed on a Bruker Avance 500 spectrometer equipped with a multiprobe head 1152Z. The measurements were performed for compounds dissolved in CS2 with d6-acetone placed in a coaxial tube as a lock; in special cases d4-ortho-dichlorobenzene was also used as a solvent. Typically the spectra were measured at each 10 K in the temperature rage form 268 to 308 K.
Longitudinal relaxation rates (R1) were measured using inversion recovery pulse sequence with different delays between π and π/2 pulses. The values were determined from the slope of the linear fit of ln(Imax − I) versus τ (delay). Transversal relaxation rates (R2) were measured using Carr–Pucell–Meiboom–Gill (CPMG) pulse sequence.30 The values were determined from slopes of linear fit of −ln(I) versus τ (delay). In case of broad line width, R2 cannot be determined by CPMG-pulse sequence because the relaxation is too fast. Conservative estimation of R2 values in such cases can be done by measuring the line width at half peak maximum. However, R*2 determined by this procedure includes the line broadening by inhomogeneity of the magnetic field ( ) and therefore the T2 time determined from the line width is shorter than the real one.
DFT optimization of molecular coordinates was performed at the B3LYP level using the Firefly31 code. The basis sets were def2-SVP {5,1,1/3,1/1} for carbon atoms,32 def2-TZVP {6,2,1,1/4,1,1/1,1/1} for nitrogen,32 and Stuttgart–Cologne effective core potentials for Sc (ECP10MDF)33 and lanthanides (4f-in-core ECP-MWB-II)34 with {3,1,1,1,1,1/2,2,1,1,1/4,1,1/1,1/1} and {3,1,1,1,1,1/3,1,1,1,1/2,1,1,1,1/1,1,1/1,1} valence parts, respectively. Spin density and hyperfine coupling constants in GdSc2N@C80 were computed at the PBE level using the specially tailored SARC basis set of TZVP quality35 combined with either DKH or ZORA scalar relativistic corrections implemented in the ORCA package.36 To compute the Bader (QTAIM) charges, full electron calculations were performed at the PBE/SARC-TZVP level with DKH scalar relativistic corrections using ORCA. To avoid poor reliability of the full electron DFT treatment of the 4f elements, Y was used to model the charges of the lanthanides from Tb to Tm, whereas La was used to model Ce, Pr, and Nd. QTAIM computations of the atomic charges were then performed with the AIMAll37 code. Point charge calculations of the ligand field splitting, magnetic susceptibility tensors, and 4f electron densities were performed using so1ion (Cfield) routine in McPhase code.38 Molecular structures and isosurfaces were visualized with the help of VMD.39
Results and discussion
NMR spectroscopy
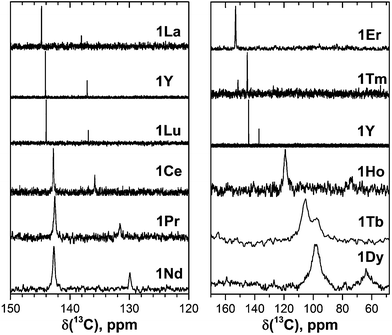 | ||
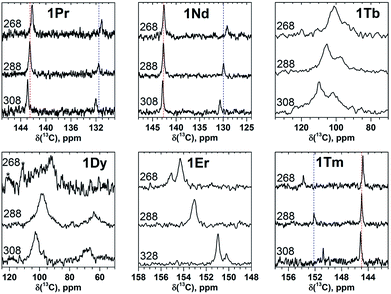
| Fig. 2 13C NMR spectra of 1M compounds measured in CS2 at 288 K. Note the different scale in the left and right panels; for a better comparison, the spectrum of 1Y is shown in both panels. | ||
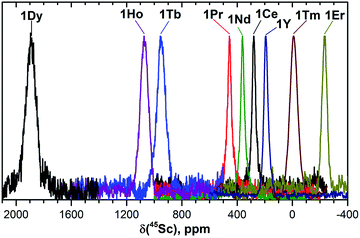 | ||
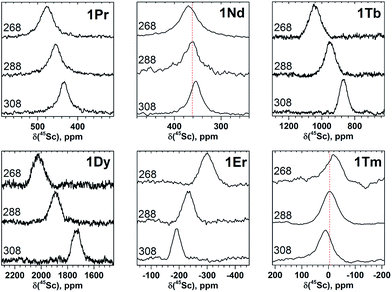
| Fig. 3 45Sc NMR spectra of 1M compounds measured in CS2 at 288 K. The δ(45Sc) value of diamagnetic 1Y is 191 ppm. | ||
Fast rotation of the MSc2N cluster inside the highly symmetric C80-Ih carbon cage results in the averaging of the carbon signals, leaving only two 13C NMR peaks with a 3![[thin space (1/6-em)]](https://www.rsc.org/images/entities/char_2009.gif) :
:![[thin space (1/6-em)]](https://www.rsc.org/images/entities/char_2009.gif) 1 intensity ratio. The higher intensity peaks corresponds to the 60 carbon atoms at the pentagon–hexagon–hexagon junctions (PHHJ), whereas the lower intensity peak is due to the 20 atoms at the triple hexagon junctions (THJ, see Fig. 1). The chemical shift of the PHHJ carbons in diamagnetic 1M compounds is bracketed by the 1La and 1Lu values, 144.76 and 143.99 ppm, respectively. Likewise, the THJ signal varies from 138.08 ppm in 1La to 136.90 ppm in 1Lu. Chemical shifts of the THJ and PHHJ carbon atoms in 1Y are intermediate between those of 1La and 1Lu (see Table 1). Thus, depending on the size of the endohedral cluster, the diamagnetic 13C values are subject to change within the range of ca. 1 ppm (see also ref. 40) which should be taken into account in the analysis of the paramagnetic shifts in other 1M compounds. The δdia values listed in Table 1 and used to compute paramagnetic shifts were obtained by approximating the 13C chemical shifts by a quadratic function of the Shannon radii of metal ions (see ESI Fig. S6†).
1 intensity ratio. The higher intensity peaks corresponds to the 60 carbon atoms at the pentagon–hexagon–hexagon junctions (PHHJ), whereas the lower intensity peak is due to the 20 atoms at the triple hexagon junctions (THJ, see Fig. 1). The chemical shift of the PHHJ carbons in diamagnetic 1M compounds is bracketed by the 1La and 1Lu values, 144.76 and 143.99 ppm, respectively. Likewise, the THJ signal varies from 138.08 ppm in 1La to 136.90 ppm in 1Lu. Chemical shifts of the THJ and PHHJ carbon atoms in 1Y are intermediate between those of 1La and 1Lu (see Table 1). Thus, depending on the size of the endohedral cluster, the diamagnetic 13C values are subject to change within the range of ca. 1 ppm (see also ref. 40) which should be taken into account in the analysis of the paramagnetic shifts in other 1M compounds. The δdia values listed in Table 1 and used to compute paramagnetic shifts were obtained by approximating the 13C chemical shifts by a quadratic function of the Shannon radii of metal ions (see ESI Fig. S6†).
| 1M | R(M3+) | 13C-PHHJ | δ dia | δ para | Δ308268 | 13C-THJ | δ para | Δ308268 | 45Sc δ | δ para | Δ308268 | ||
|---|---|---|---|---|---|---|---|---|---|---|---|---|---|
| δ | Δν1/2 | δ | δ dia | ||||||||||
| a Ionic radii are in Å, chemical shifts are in ppm, line width Δν1/2 in Hz 13C chemical shifts are determined with precision to the second decimal except for 1Tb, 1Dy, and 1Ho, which are determined to the first decimal. b Diamagnetic shifts were estimated from the polynomial fit of the δ(1M)-versus-R(M3+) data for 1Y, 1La, and 1Lu. c The values are obtaining by subtracting the 45Sc chemical shift of 1La (1Ce, 1Pr, 1Nd) or 1Lu (other compounds). | |||||||||||||
| Y | 0.900 | 144.11 | 1.5 | 144.11 | — | — | 137.11 | 137.11 | — | — | 191 | — | — |
| La | 1.032 | 144.76 | 2.0 | 144.76 | — | — | 138.08 | 138.08 | — | — | 198 | — | — |
| Ce | 1.010 | 142.69 | 15.1 | 144.63 | −1.94 | 0.73 | 135.73 | 137.89 | −2.16 | 0.57 | 279 | 79 | — |
| Pr | 0.990 | 142.55 | 41.8 | 144.51 | −1.96 | 0.72 | 131.59 | 137.73 | −6.14 | 0.94 | 455 | 255 | −43 |
| Nd | 0.983 | 142.69 | 50.5 | 144.47 | −1.78 | 0.25 | 129.91 | 137.67 | −7.76 | 1.48 | 361 | 161 | −15 |
| Tb | 0.923 | 105.6 | 579 | 144.20 | −38.6 | 8.6 | 98.0 | 137.25 | −39.3 | 7.5 | 949 | 749 | −174 |
| Dy | 0.912 | 97.5 | 905 | 144.15 | −46.7 | 10.2 | 61.6 | 137.18 | −75.6 | — | 1892 | 1692 | −290 |
| Ho | 0.901 | 119.1 | 284 | 144.11 | −25.0 | — | 74.2 | 137.12 | −62.9 | — | 1072 | 872 | −165 |
| Er | 0.890 | 153.23 | ∼45 | 144.08 | 9.15 | −2.12 | 153.23 | 137.05 | 16.18 | −3.12 | −233 | −433 | 109 |
| Tm | 0.880 | 144.83 | 17.2 | 144.04 | 0.79 | 0.34 | 151.97 | 137.00 | 14.97 | −2.97 | −10 | −210 | 32 |
| Lu | 0.861 | 143.99 | 1.0 | 143.99 | — | 136.90 | 136.90 | — | 200 | — | |||
The measurement of the 13C NMR spectra of paramagnetic EMFs is complicated by the considerable line broadening. However, thanks to the simple two-line spectrum of the C80 carbon cage, the signals are detectable even when they are severely broadened as in 1Tb or 1Dy. In 1Ce, 1Pr, 1Nd, 1Tb, 1Dy, and 1Ho the 13C signals are shifted up-field with respect to the diamagnetic values. The magnitude of the paramagnetic shift varies from few ppm in 1Ce, 1Pr, and 1Nd to tens of ppm in 1Tb, 1Dy, and 1Ho (Fig. 2 and Table 1). On average, lanthanide-induced shifts of the THJ carbons are more pronounced than those of the PHHJ carbons.
In 1Er and 1Tm the lanthanide-induce shift is positive (down-field). The PHHJ and THJ 13C signals of 1Er are coinciding near the room temperature and appear at 153.2 ppm, but can be resolved at higher or lower temperatures as discussed below. In 1Tm, the stronger lanthanide-induced shift of the THJ signal pushes it to a lower field than that of the PHHJ (in all other 1M compounds the PHHJ signal appears at lower field than that of the THJ carbons). Direction of the lanthanide-induced paramagnetic shift is determined by a magnetic anisotropy of the lanthanide ion (see ref. 41 for recent examples), and hence experimental NMR data gives information at least on the sign of the anisotropy. This question will be discussed in more details below.
In 45Sc NMR spectra, all 1M compounds exhibit one relatively broad peak (Fig. 3). The 45Sc chemical shifts of the diamagnetic 1La and 1Lu are 198 and 200 ppm, respectively, whereas in paramagnetic 1M molecules the 45Sc signal position spans the range from −233 ppm in 1Er to 1892 ppm in 1Dy. The peak width varies from 30–40 ppm for the diamagnetic 1Lu and 1La and paramagnetic 1Ce, 1Pr, 1Nd and 1Er, to ca. 70–80 ppm for the 1Tb, 1Dy, 1Ho, and 1Tm.
Temperature variation of the peak positions is in line with the single-temperature δpara values. Namely, the compounds with strong paramagnetic shifts exhibit enhanced variation of the peak position with the temperature and vice versa. Likewise, the sign of the Δ308268(δ) values is opposite to the sign of the δpara shifts. The only exclusion is the PHHJ signal of 1Tm, for which both δpara and Δ308268(δ) parameters are positive. Since this signal has the smallest δpara value (0.79 ppm), we cannot exclude that uncertainties in the estimation of the δdia value may play a role here. More likely, however, is that the pseudocontact and contact contributions have opposite signs and compensate each other in this molecule.
Comparison of the Δν1/2 values for 13C peaks in 1M series (Fig. 1 and Table 1) reveals dramatic influence of the lanthanide on the nuclei spin relaxation. For instance, 13C nuclei spins in 1Dy (T2 ≈ 0.3 ms) relax ca. 5 × 10⁴ times faster than in diamagnetic 1Y (T2 = 17 s). The plot of Δν1/2versus δpara for the PHHJ carbons along the 1M series can be well fit by a parabola (see ESI Fig. S9†). This fact points to the prevailing contribution of the pseudocontact shift in the total paramagnetic shift since the relaxation rate in paramagnetic molecules has R−6 dependence on the distance between the nuclei and paramagnetic center, whereas the pseudocontact shift scales as R−3 (eqn (1)).
The broadening of 45Sc signals along the 1M series is not so pronounced as for carbon signals because the 45Sc quadrupole moment broadens the peaks even in diamagnetic molecules. The 45Sc signals in 1Dy, 1Tb, 1Ho, and 1Tm are roughly two times broader than in the 1Y (Fig. 3), which can be ascribed to a paramagnetic effect. At the same time, in 1Ce, 1Pr, 1Nd, and 1Er the line width is comparable to that of diamagnetic 1Y, which means that the spin relaxation rate in these molecules is still determined by a quadrupole effect.
The line width exhibits substantial decrease at lower temperatures (Fig. 4 and 5). For instance, 45Sc signals measured at 268 K are roughly twice broader than at 308 K (Fig. 5). In some previous works, temperature dependence of the 45Sc line width was used to estimate rotation barrier of the endohedral clusters.19,43 If the line width is directly proportional to the rotational correlation time, the plot ln(Δν1/2)-versus-T−1 gives a straight line with the slope proportional to the activation energy. In this work, none of the 1M molecules gave straight line in the ln(Δν1/2)-versus-T−1 coordinates, preventing thus further analysis of the data. The broadening at low temperature should result from the interplay of the slowing of the cluster dynamics and the electron spin contribution, which can hardly be separated at this moment.
Separation of contact and pseudocontact shifts
The localized “buried” nature of the 4f electrons in lanthanides implies that the contact contribution to the paramagnetic shift should be rather small. Typically, the values become negligible when the nucleus of interest is separated by more than four bonds from the lanthanide ion. However, in the 1M molecules both Sc and carbon atoms are located rather close to the lanthanide, and hence the contact term cannot be ignored. With systematic NMR data along the whole lanthanide series in hand, we can address this problem. Separation of the contact and pseudocontact shifts is a long standing problem in paramagnetic NMR, and several schemes were proposed to solve it.11c,13,44 Unfortunately, all methods allowing analytical deviation of linearizable equations are based on Bleaney's assumption45 that LF splitting is less than the thermal energy and hence expansion of the magnetic susceptibility in reciprocal temperature series is limited to T−2. This assumption is definitely not fulfilled for 1M molecules, and hence the results of these calculations may give only qualitative estimation at best (see also ref. 41a for a detailed discussion of the limitations of Bleaney's theory). Another assumption usually applied is that the system is either purely axial (LF operator described in phenomenological Bqk parameters is limited to the B02 term), or its rhombic anisotropy can be described solely by a B22 parameter. The sum of contact and pseudocontact shifts can be then described as:| δparaij = Fi〈Sz〉j + Cj(B02Gi + 6B22Hi) | (2) |
The first term is the contact shift, where Fi is proportional to a Fermi coupling constant, and 〈Sz〉j is the expectation value of the spin projection operator Sz for a given lanthanide. The second term is the pseudocontact shift, Cj is a numerical factor specific for each lanthanide and tabulated by Bleaney et al.,45b whereas Gi and Hi are structural factors (compare to eqn (1a)). If rhombic anisotropy is negligible, the second term reduces to δpcij = CjB02Gi (compare to eqn (1b)).
 | (3) |
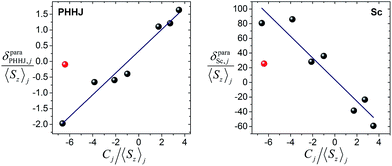
The plot δparaij/〈Sz〉jversus Cj/〈Sz〉j along the lanthanide series is expected to give a straight line, if all molecules are isostructural, and the Fi value and LF parameters are not changing along the series. Contact and pseudocontact shifts can be then computed from the intercept and the slope.
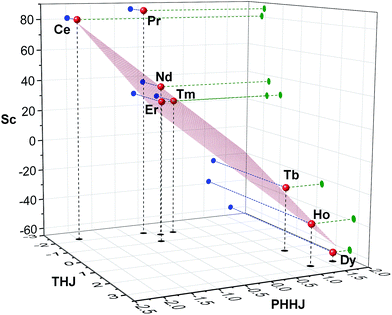
Fig. 6 shows δparaij/〈Sz〉jversus Cj/〈Sz〉j plots for two NMR signals measured for 1M molecules. 13C PHHJ and 45Sc shifts can be roughly linearized if 1Tm values are excluded from the set; the δcon and δpc shifts computed from the linear fits are listed in Tables 2 and 3. The 13C THJ shifts cannot be fitted by a straight line in these coordinates (see ESI Fig. S10†).
| 1M | 〈Sz〉ja | C j | PHHJ | DFTb | δ pc | DFTc | PCMd | Δ308268e | THJ | δ pc | PCMd | Δ308268e |
|---|---|---|---|---|---|---|---|---|---|---|---|---|
| δ con | δ con | |||||||||||
| Reilley | Reilley | DFTb | DFTc | |||||||||
| a 〈Sz〉j and Cj values are adopted from ref. 44a. b PBE/SARC-TZVP calculations. c The values are obtained as δpc(DFT) = δpara(exp) − δcon(DFT). d “PCM” stands for point charge model. e Δ308268 values are computed using PCM approach and include only δpc contribution. | ||||||||||||
| Ce | 0.98 | −6.48 | 0.3 | 0.4 | −2.2 | −2.3 | −1.2 | 0.2 | 0.2 | −2.4 | −3.4 | 0.5 |
| Pr | 2.97 | −11.41 | 1.0 | 1.2 | −4.0 | −3.1 | −2.7 | 0.4 | 0.8 | −6.9 | −7.7 | 1.2 |
| Nd | 4.49 | −4.46 | 1.4 | 1.8 | −1.5 | −3.6 | −2.1 | 0.5 | 1.1 | −8.9 | −6.0 | 1.4 |
| Tb | −31.82 | −86.84 | −10.3 | −12.7 | −30.1 | −25.9 | −17.6 | 3.1 | −8.1 | −31.2 | −61.2 | 10.9 |
| Dy | −28.54 | −100 | −9.2 | −11.4 | −34.6 | −35.2 | −24.2 | 4.3 | −7.3 | −68.3 | −73.0 | 12.9 |
| Ho | −22.63 | −39.25 | −7.3 | −9.0 | −13.6 | −16.0 | −12.5 | 3.4 | −5.8 | −57.2 | −47.3 | 12.0 |
| Er | −15.37 | 32.4 | −5.0 | −6.1 | 11.2 | 15.3 | 5.8 | −1.3 | −3.9 | 20.1 | 21.0 | −4.6 |
| Tm | −8.21 | 52.53 | −2.6 | −3.3 | 18.2 | 4.1 | 5.9 | −1.1 | −2.1 | 17.1 | 17.8 | −2.8 |
| 1M | δcon | 2-nuca | δpc | 2-nucb | PCMc | Δ308268d |
|---|---|---|---|---|---|---|
| Reilley | Reilley | |||||
| a Obtained using the fit of eqn (4a) together with 13C-PHHJ shifts, and then subtracting δcon(13C) values estimated by Reilley's approach; 1Pr value was not included in the fit; inclusion of 1Pr shift worsened the fit from R2 = 0.96 to R2 = 0.87, but gave the values closer to those obtained by Reilley's approach. b The values are obtained as δpc(2-nuc) = δpara(exp) − δcon(2-nuc). c “PCM” stands for point charge model. d Δ308268 values are computed using PCM approach and include only δpc contribution. | ||||||
| Ce | 4 | 0 | 95 | 79 | 87 | −14 |
| Pr | 11 | −1 | 168 | 257 | 197 | −31 |
| Nd | 17 | −2 | 66 | 163 | 150 | −36 |
| Tb | −122 | 14 | 1278 | 735 | 1430 | −255 |
| Dy | −110 | 13 | 1472 | 1679 | 1799 | −319 |
| Ho | −87 | 10 | 578 | 862 | 1060 | −290 |
| Er | −59 | 7 | −477 | −440 | −458 | 100 |
| Tm | −32 | 4 | −773 | −213 | −394 | 62 |
The absolute values of δcon shifts for the PHHJ carbons are 2–4 times smaller than those of δpc. Furthermore, the δcon and δpc shifts of 1Ce, 1Pr, 1Nd, 1Er, and 1Tm, have opposite signs. For 1Nd this analysis predicts mutual compensation of δcon and δpc shifts, but uncertainties of 1–2 ppm make the analysis of the small values rather ambiguous.
The ratio between δcon and δpc for the 45Sc chemical shifts is smaller than for the 13C counterparts, and the contact term contribution drops to less than 10% for the majority of lanthanides; the largest relative δcon values of ca. 20% are found in 1Nd and 1Ho. Thus, although uncertainty of the fit is rather high, the dominance of the pseudocontact term is beyond any doubt.
Deviations from the straight line in eqn (3) are usually considered to be an indication of the loss of the isostructurality along the series. This can hardly be the case for the 1M series since molecular structures determined by single-crystal X-ray diffraction for some of them are very similar (subject to vary with lanthanide contraction, see below).19,26–28 More likely, other assumptions used in the model are not valid. In particular, Reilley's approach implies that the LF parameters are not changing along the lanthanide row, which is most probably not correct for the 1M molecules.7b
 | (4a) |
The slope of the line is a ratio of the structural factors Gi/Gk, and the intercept is a difference of Fi and FkGi/Gk. For the molecules with a rhombic anisotropy (B22 ≠ 0), the parameter-free model can be obtained in a similar fashion by simultaneous analysis of chemical shifts of three different nuclei. In the latter case linearization gives the equation of a plane (ref. 47):
 | (4b) |
Fig. 7 visualizes analysis of all chemical shifts for 1M molecules within parameter free models. The 3D plot corresponds to the 3-nuclei method, whereas projections on the coordinate planes allow evaluation of the 2-nuclei method for three different combination of nuclei. In the 3-nuclei model, all data points except for 1Pr are close to the plane obtained by the least square fitting of eqn (4b). Analysis of the 2D plots in Fig. 7 shows that a good linear correlation exists only for the PHHJ-vs.-Sc plot (1Pr value is deviating again). Substituting the δcon values obtained for the PHHJ carbons using eqn (3) into eqn (4a) for the PHHJ-vs.-Sc correlation allows estimation of the 45Sc δcon shifts. The values obtained by this way are much smaller than those obtained using Reilley's approach. It should be also noted that the results of the δcon calculations for Sc using the 2-nuclei method are rather erratic and change significantly with small variation of the input parameters. At the same time, both methods agree in that the 45Sc δcon shifts are considerably smaller than the pseudocontact contributions.
The fact that the data points for THJ carbons fit well into the 3-nuculei model but do not give linear correlations in the 2-nuclei model might indicate that the rhombic anisotropy contribution is considerable here, but the limited amounts of points does not allow more solid conclusions.
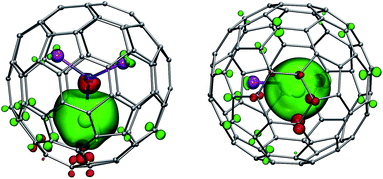
Fig. 8 shows the spin density distribution in 1Gd computed using the scalar-relativistic DKH2 approximation, PBE functional, and SARC-TZVP basis set. Negative spin polarization of the central nitrogen atoms and several carbon atoms close to the lanthanide can be well seen (red-colored lobes). At the same time, the sign of the spin density on the Sc atoms and carbon atoms further away from the Gd ion is the same as for the Gd itself.
Hyperfine coupling constants for carbon atoms in GdSc2N@C80 span the range from −0.041 MHz to 0.096 MHz, and the averaging over the whole carbon cage yields the values of 0.015 and 0.010 MHz for the PHHJ and THJ carbons, respectively. The pseudocontact shifts computed for 13C atoms using these constants are listed in Table 2. Remarkably, the DFT-computed values for the PHHJ carbons are quite close to those obtained by Reilley's method. If we tentatively suggest that the agreement between the theory and experiment is equally well for the THJ carbons, their contact shifts should be 35% smaller than those of PHHJs. Furthermore, relative contributions of the contact term in total paramagnetic shifts of the THJ carbons are much smaller than for the PHHJ carbons.
For the 45Sc hyperfine coupling constant, the PBE-DKH approximation with tailored SARC-TZVP basis set gives the average value of −0.27 MHz. An increasing the basis set to def2-TZVP or inclusion of the spin–orbit coupling corrections give the values of −0.26 MHz and −0.28 MHz, respectively, whereas switching to ZORA scalar relativistic method reduces the 45Sc hyperfine coupling constant to −0.21 MHz. If hybrid PBE0 functional is used instead of PBE with SARC-TZVP basis, predicted DKH and ZORA values are −0.35 and −0.49 MHz, respectively. The use of PBE-DKH/TZVP constants for estimation of the 45Sc contact shifts in 1M molecules yields unrealistically high values (625 ppm for 1Tb, 560 ppm for 1Dy, etc.). It should be noted that computation of the 45Sc hyperfine coupling constants is less straightforward than for 13C nuclei because of the subtle balance between the valence- and core–shell spin polarizations, which often have opposite signs in transition metals.49 Due to this reason, prediction of the 45Sc hyperfine coupling constants meets serious difficulties even for the Sc-based EMF radicals such as Sc3N@C80− (ref. 50), where coupling constants are large and dominated by SOMO contribution. Reliable prediction of the core–shell spin polarization becomes even more problematic for paramagnetic molecules, in which the spin density on the Sc atoms is largely induced by spin polarization (such as in 1M). We have to admit that DFT prediction of small 45Sc coupling constants in 1M can hardly be reliable at this moment and refrain from further discussion of DFT-computed δcon(45Sc) values.
Geometry parameters of 1M molecules
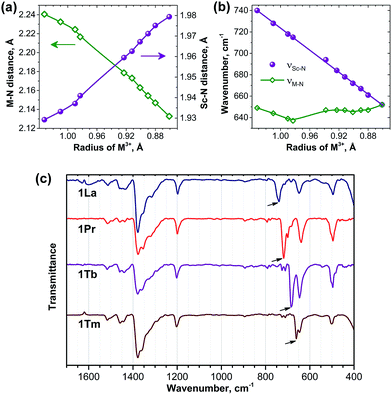
For the further analysis of the magnetic state and the LF splitting of lanthanide ions in the 1M compounds it is necessary to take into account a variation of the molecular geometry parameters along the series. Namely, a significant decrease of the ionic radii of lanthanides from La to Lu cannot be ignored, especially when magnetic anisotropy is large. Therefore, to obtain a consistent set of the molecular geometry parameters along the whole 4f row for the subsequent LF calculations (see next section), we performed DFT optimization of all structures using the B3LYP functional and 4f-in-core basis set for lanthanides. The M–N and averaged Sc–N bond lengths are listed in ESI Table S2† and are plotted versus Shannon ionic radii of M3+ ions in Fig. 9. As expected, the decrease of the ionic radii from La to Lu results in the gradual decrease of the M–N distance (from 2.241 Å in 1La to 2.133 Å in 1Lu). At the same time, since the carbon cage remains the same, the increase of the lanthanide size also leads to the simultaneous decrease of the Sc–N bond lengths (compare 1.929 Å in 1La to 1.979 Å in 1Lu) so that the cluster size remains more or less the same along the whole series. Single-crystal X-ray structures were reported earlier for 1La,261Ce,191Gd,271Tb,27 and 1Er,28 and experimental bond length values also confirm this trend. Namely, in the 1La–1Ce–1Gd–1Tb–1Er the lanthanide–nitrogen bond is decreasing as 2.196(4)–2.184(2)–2.149(10)–2.126(11)–2.089(9) Å. The averaged Sc–N distance is varying as 1.932(7)–1.938(2)–1.918(9)–1.949(8)–1.968(6) Å, respectively, i.e. there is a gradual decrease from 1La/1Ce to 1Tb to 1Er (note that 1Gd deviates from the trend). A comparison to the computed data shows that DFT overestimates the M–N distances by ca. 0.04–0.06 Å, whereas the error for the Sc–N distances is smaller than 0.01 Å. Overall, DFT-optimized bond lengths give reasonable estimation of the experimental values.Significant variation of the bond lengths in nitride clusters can be also inferred from the analysis of the FTIR absorption spectra. In the frequency range of 500–800 cm−1, all nitride clusterfullerenes have a characteristic antisymmetric metal–nitrogen stretching vibration with medium to strong absorption intensity, whose frequency correlates with the metal–nitrogen bond length and therefore can be used for the analysis of the structural correlations.29c,52 This mode corresponds to the in-plane motion of the nitrogen atom and is two-fold degenerate for the M3N cluster with the frequency of (3kM–N)0.5mN−0.5, where kM–N is the force constant of the metal–nitrogen bond, and mN is the mass of the nitrogen atom. In the mixed-metal cluster MSc2N, the degeneracy is lifted and the frequencies of two resulting vibrations are:
| νSc–N = (3kSc–N)0.5mN−0.5 | (5a) |
| νM−N = (2kM−N + kSc−N)0.5mN−0.5 | (5b) |
Fig. 9c compares the IR spectra for 1La, 1Pr, 1Tb, and 1Tm (IR spectra of other 1M compounds were reported by our group earlier20b,24,29c). In all spectra both the νM–N and νSc–N components can be clearly identified in the 600–800 cm−1 range. Comparison of the νM–N values along the 1M series is not straightforward, because the frequency versus bond length correlation does not hold exactly for different metals and also because of the admixture of the kSc–N force constant in eqn (5b). In fact, the νM–N frequency remains in the range of 635–650 cm−1 in the whole 1M series (Fig. 9b). The νSc–N frequencies are better suited for the structural correlations: Fig. 9b shows that the νSc–N frequencies vary from 652 cm−1 in 1Lu to 740 cm−1 in 1La and exhibit perfect linear correlation with the lanthanide ionic radii. Very good correlation also exists between the DFT-predicted Sc–N bond lengths and experimental νSc–N frequencies (not shown), thus confirming reliability of the DFT-computed structural parameters.
Ligand field in 1M molecules
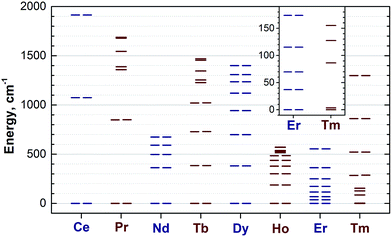
Reliable determination and verification of the cluster bond lengths discussed in the previous section is crucial for the analysis of the LF in nitride clusterfullerenes. Recently we showed that the point charge model employing scaled Bader charges can reasonably reproduce the ab initio (CASSCF) computed ligand field splitting in DySc2N@C80,7a,20a which enables the use of this simple approach for other 1M compounds. To calculate the LF splitting in this work we used B3LYP-optimized coordinates discussed above and Bader charges for nitrogen, scandium, and four closest carbon atoms (denoted C1–C4 in Fig. 1; since the cage carbon atoms have very small contribution to the LF,20a it is sufficient to consider only few nearest atoms, their QTAIM charges are listed in the ESI Table S2†). The charges were scaled by a factor of 0.754 to match the ab initio LF splitting in 1Dy from ref. 7a (see ESI Table S3†). Fig. 10 shows an overview of the mJ levels in all studied 1M molecules (the values and assignment are listed in the ESI Table S4†).The central nitrogen atom gives the main contribution to the LF in nitride clusterfullerenes because of its large negative charge (Bader charge −1.7) and close distance to the lanthanide ion (see ESI Table S3† for the LF point charge calculations using different parts of the MSc2N@C80 molecule). Therefore, correct description of the molecular geometry is crucial since even small variations of the metal–nitrogen distance lead to considerable changes in the ligand field.20a Two Sc ions produce the second largest contribution to the LF after the nitride ion. Their positive charges (Bader charge of ca. +1.7) reduce the effect of the nitride ion (e.g., in 1Dy the LF splitting is reduced by ca. 35% when Sc contribution is “turned on”) and introduce a deviation from the uniaxial symmetry. The charges of carbon atoms are much smaller than those of N and Sc (below −0.1), and hence only few carbons close to the lanthanide ion have non-negligible contribution to the LF (in comparison to the M + N + 2Sc system, addition of four carbons increases the splitting energies by ca. 12%, see ESI Table S3† for 1Dy and ref. 20a for a more detailed analysis of 1Ho). Thus, the LF experienced by lanthanide ions in 1M molecules has roughly a uniaxial character induced by a large negative point charge of the nitride ion, which results in rather simple LF splitting pattern despite the low molecular symmetry. A similar situation was found for a series of other Dy-based SMMs with low molecular symmetry.53
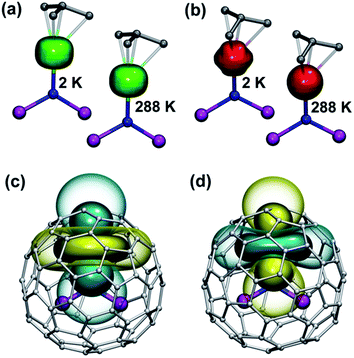
The practical importance of the states with small |mJ| values in ions with oblate 4f density is rather limited because the LF splitting in 1M is very large (Fig. 10). The smallest overall LF splitting, 571 cm−1, is found in 1Ho, whereas the largest LF splitting is reaching 1915 cm−1 in 1Ce. The gap between the ground state and the first excited state in 1Ce (1075 cm−1), 1Pr (849 cm−1), 1Nd (364 cm−1), 1Tb (384 cm−1), and 1Dy (382 cm−1) is so large that even at room temperature the ground magnetic state with the largest Jz projection is predicted to have predominant contribution to the magnetic properties. As a result, 4f density in such 1M molecules exhibits only small variation with temperature. For instance, 4f densities in 1Dy calculated at 2 K and 288 K can hardly be distinguished by eye (Fig. 11a).
The two-fold degenerate ground state with the large Jz projection and a significant gap to the first excited state are prerequisites for the SMM behaviour,54b and hence the data in Fig. 10 show that slow magnetization reversal can be expected for all 1M compounds (except for the 1Gd, 1Er and 1Tm). The SMM behaviour with exceptionally long attempt time is already discovered for 1Dy.3,4 Field-induced SMM behaviour is also found in non-Kramers 1Ho,5 albeit on a much shorter timescale than in 1Dy. The rigorous protection of the two-fold degeneracy of the ground magnetic state in Kramers ions makes them more attractive for single ion magnetism, and we expect 1Ce and 1Nd to be the next candidates for the SMM behaviour in nitride clusterfullerenes as already detected in some organometallic complexes of Ce55 and Nd.56 It should be however noted that the magnetization reversal barrier in 1Dy is smaller than expected from its LF splitting,4 which indicates that the mechanism for the magnetization reversal in 1M compounds is more complex and may include, for instance, Raman-like process.5
1Er is the only compound in the whole 1M series for which spectroscopic data on the lanthanide-based luminescence are available. At helium temperatures the luminescence spectra of 1Er exhibit the fine structure due to the Er-based transitions in the 4I13/2 → 4I15/2 manifold.9b,57 Unfortunately, emission from several molecular/cluster sites complicates the fine structure and makes assignment less straightforward. The energy gap between the two lowest energy LF states determined in ref. 57, 28/37 cm−1, compares reasonably to the 37 cm−1 gap between the mJ = ±1/2 and mJ = ±3/2 states in our calculations, however the overall splitting determined in the optical measurements, 330 cm−1, is considerably smaller than the value of 554 cm−1 predicted by the point-charge model.
Computed versus experimental pseudocontact chemical shifts
LF calculations allow direct estimation of the magnetic susceptibility tensor at different temperatures using Van Vleck formulae, and therefore enable computations of the pseudocontact chemical shifts using eqn (1a) or (1b) given the atomic coordinates are known (e.g. from DFT calculations) and they are not changing with temperature. Comparison between experimental and computed chemical shifts can be used then to evaluate reliability of the computed ligand field splitting levels. Rotation of the nitride cluster inside the carbon cage means that the values computed for individual carbon atoms should be averaged. Recently we found that the static model (simple averaging of the values) and the averaging of the values computed over molecular dynamics trajectory give comparable results for 1Ho,20a and therefore only static model is applied in this work.In the 1M molecules with oblate 4f-density eqn (1a) and (1b) give identical values of the pseudocontact shift because χxx and χyy components of the magnetic susceptibility tensor are virtually equal. In the 1Er and 1Tm molecules, the difference between χxx and χyy values is rather large, and hence eqn (1a) is to be used. The pseudocontact shifts computed for the THJ and PHHJ carbons as well as for the Sc atoms at T = 288 K are listed in Table 2 and 3 along with the computed Δ308268(δ) values. Fig. 11 plots pseudocontact shift isosurfaces in 1Dy and 1Er as examples of lanthanides with oblate and prolate 4f density shapes, respectively.
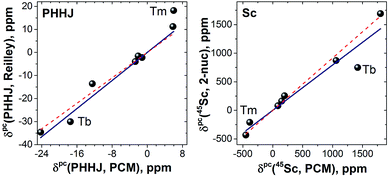
The reliability of the point charge model in calculations of the magnetic susceptibility can be evaluated comparing experimental and computed δpc shifts (Fig. 12). As experimental values we use the results of Reilley's approach for 13C-PHHJ signal and the values from the 2-nuclei fitting for 45Sc shifts. Details for the 13C-THJ shifts are not discussed in the text but can be found in the ESI Fig. S11.†
As can be seen in Fig. 12, reasonably good correlation exists between experimental and computed data. If 1Tm and 1Tb are not included in the set, the linear correlation with the intercept set to zero gives R2 values of 0.98 and 0.99 for the PHHJ and 45Sc shifts, respectively. Note also that the 45Sc δpc shifts from the 2-nuclei model are very close to the total δpara shifts. Thus, we can tentatively use 45Sc chemical shifts of paramagnetic mixed-metal nitride clusterfullerenes to evaluate the size of the magnetic anisotropy of the endohedral lanthanide ions without rather complicated and sometimes hardly possible estimation of the contact term.
It should be also noted that the slope of the linear fit in Fig. 12 is close to 0.9 for 45Sc but is near 1.4 for 13C-PHHJ. The slope for an analogous fit for the 13C-THJ signals (see ESI Fig. S11†) is close to 0.9. As follows from eqn (1) and our earlier studies of the Ho-based NCFs,20a the structural factor also plays an important role in determining the δpc values, and dynamic nature of the 13C shifts in 1M molecules (i.e. averaging over the cluster rotation) makes calculation less straightforward than for the 45Sc shifts. For instance, in 1Ho the term (3cos2![[thin space (1/6-em)]](https://www.rsc.org/images/entities/char_2009.gif) θi− 1)/12πRi3 (denoted hereafter as Gi) computed in this work at the B3LYP level is −3.30 × 10⁻⁴/−1.29 × 10−3 Å−3 for the PHHJ/THJ carbons, respectively. At the same time, our recent PBE computations using Y as a model for Ho gave the values of −7.37 × 10⁻⁴/−5.59 × 10−4 Å−3, respectively. Along the 1M series, the Gi values for carbon atoms vary by 15–20%, from −3.91 × 10⁻⁴/−1.13 × 10−3 Å−3 in 1Ce to −3.16 × 10⁻⁴/−1.31 × 10−3 Å−3 in 1Er. Since the slope of the linear fit between experimental and calculated δpc values for THJ carbons is closer to 1, we propose that B3LYP level gives correct values for the THJ carbons, whereas Gi factors for the PHHJs are underestimated (and therefore the slope is close to 1.4). Thus, the use of paramagnetic 13C chemical shifts for analysis of the magnetic anisotropy of the endohedral lanthanide ions meets certain difficulties caused by the uncertainties in the structural factor when endohedral cluster is rotating on the NMR time scale. On the contrary, the Gi term for 45Sc is almost independent on the level of theory employed to calculate it. Moreover, its variation along the whole 1M series is below 1% because the shortening of the M–N distance in the cluster is balanced by the elongation of the Sc–N distance. Such indifference to the structural factor makes the 45Sc chemical shifts more suitable for the analysis of the magnetic anisotropy in mixed-metal nitride clusterfullerenes.
θi− 1)/12πRi3 (denoted hereafter as Gi) computed in this work at the B3LYP level is −3.30 × 10⁻⁴/−1.29 × 10−3 Å−3 for the PHHJ/THJ carbons, respectively. At the same time, our recent PBE computations using Y as a model for Ho gave the values of −7.37 × 10⁻⁴/−5.59 × 10−4 Å−3, respectively. Along the 1M series, the Gi values for carbon atoms vary by 15–20%, from −3.91 × 10⁻⁴/−1.13 × 10−3 Å−3 in 1Ce to −3.16 × 10⁻⁴/−1.31 × 10−3 Å−3 in 1Er. Since the slope of the linear fit between experimental and calculated δpc values for THJ carbons is closer to 1, we propose that B3LYP level gives correct values for the THJ carbons, whereas Gi factors for the PHHJs are underestimated (and therefore the slope is close to 1.4). Thus, the use of paramagnetic 13C chemical shifts for analysis of the magnetic anisotropy of the endohedral lanthanide ions meets certain difficulties caused by the uncertainties in the structural factor when endohedral cluster is rotating on the NMR time scale. On the contrary, the Gi term for 45Sc is almost independent on the level of theory employed to calculate it. Moreover, its variation along the whole 1M series is below 1% because the shortening of the M–N distance in the cluster is balanced by the elongation of the Sc–N distance. Such indifference to the structural factor makes the 45Sc chemical shifts more suitable for the analysis of the magnetic anisotropy in mixed-metal nitride clusterfullerenes.
Computed Δ308268 values reasonably agree with experimental data for THJ carbon and Sc signals, but are rather far from the experimental values of the PHHJ carbons. The latter is likely to be due to the larger relative contribution of the contact shift for the PHHJ carbons, which is not taken into account in PCM computations of Δ308268. This is especially well seen for the 1Tm: based on its magnetic anisotropy, negative Δ308268 value is expected for the pseudocontact shift, but positive for the contact shift. A small positive Δ308268 value observed experimentally for the 1Tm-PHHJ carbon is therefore due to the compensation of both terms. On the contrary, the pseudocontact contribution in the 1Tm-THJ chemical shift is much larger than the contact counterpart, and the experimental Δ308268 value is negative in good agreement with the results of computations.
1Tm and 1Tb are important deviations from the general trend (Fig. 12). Especially noticeable is the 1Tb value for the 45Sc shift, which is predicted to be much more positive than experimentally observed (Fig. 12). In other words, whereas the point charge model predicts that the LF splitting in 1Tb and 1Dy is quite similar (Fig. 10), from the 45Sc NMR spectra it follows that the LF splitting in 1Tb should be considerably smaller. Interestingly, recent ab initio CASSCF calculations predict that the LF splitting in 1Tb is indeed smaller than in 1Dy,7b which would give better agreement with experimental NMR shifts. Similarly, correct prediction of the experimental values for 1Tm require reliable estimation of a considerable number of the LF splitting levels (Fig. 10), rather than only 1–2 excited states needed for other 1M molecules. Inability of the point charge model to correctly treat all states may be also the reason of the noticeable deviations well seen for 1Tm values in Fig. 12. Therefore, both 1Tb and 1Tm values provide convenient training set to be considered in future computational studies. At the current moment we can conclude that the point charge model gives qualitatively correct predictions of the LF splitting in lanthanide EMFs but fails to describe more subtle effects. More advanced approaches would be needed to address this problem,58 but this task goes beyond the scope of this work.
Conclusions
In this work we have performed the first systematic paramagnetic NMR study of MSc2N@C80-Ih molecules with M running through all lanthanides capable of forming nitride clusterfullerenes (M = La, Ce, Pr, Nd, Tb, Dy, Ho, Er, Tm, Lu). Analysis of the whole set of data enabled separation of the contact and pseudocontact contributions to the paramagnetic shifts. We showed that the contact shift of 13C nuclei may be rather large, although pseudocontact term is still larger. For the 45Sc shifts, the pseudocontact term dominates. Since pseudocontact term is directly dependent on the magnetic anisotropy, the 45Sc NMR spectra are found to be especially useful for the studies of magnetic properties of lanthanide ions in clusterfullerenes.Interpretation of the paramagnetic NMR data required modelling of the ligand filed splitting in MSc2N@C80 molecules, which was accomplished using the point charge model. Although quite simple, this approach provided semi-quantitative agreement with experimental data. Considerable deviations between experimental and computed chemical shifts are found only for TmSc2N@C80 and TbSc2N@C80. We showed that the main contribution to the ligand field is from the nitride ion, which results in an almost uniaxial ligand field. For the lanthanides with oblate shape of the 4f density (i.e. all lanthanides except for Er and Tm) the ground magnetic state in MSc2N@C80 has the largest Jz projection with rather large gap to higher energy states (with smaller mJ values). It shows that MSc2N@C80 molecules with Kramers lanthanide ions are especially promising in the field of single molecule magnetism. Yet, more refined treatment of the ligand field splitting might be needed to fully account for all experimental data.
Acknowledgements
The authors are thankful to David Kunhardt and Birgit Urban for their help in the synthesis of 1Tb and 1Y. Research Computing Center of Moscow State University59 and The Center for Information Services and High Performance Computing of Technical University of Dresden are acknowledged for computing time. Financial support by DFG (projects PO 1602/1-2 to AAP and DU225/31-1 within the D-A-CH program) is highly appreciated.Notes and references
- (a) A. A. Popov, S. Yang and L. Dunsch, Chem. Rev., 2013, 113, 5989–6113 CrossRef CAS PubMed; (b) X. Lu, L. Feng, T. Akasaka and S. Nagase, Chem. Soc. Rev., 2012, 41, 7723–7760 RSC.
- (a) H. Funasaka, K. Sakurai, Y. Oda, K. Yamamoto and T. Takahashi, Chem. Phys. Lett., 1995, 232, 273–277 CrossRef CAS; (b) H. J. Huang, S. H. Yang and X. X. Zhang, J. Phys. Chem. B, 1999, 103, 5928–5932 CrossRef CAS; (c) R. Kitaura, H. Okimoto, H. Shinohara, T. Nakamura and H. Osawa, Phys. Rev. B: Condens. Matter Mater. Phys., 2007, 76, 172409 CrossRef; (d) H. J. Huang, S. H. Yang and X. X. Zhang, J. Phys. Chem. B, 2000, 104, 1473–1482 CrossRef CAS; (e) M. Wolf, K. H. Muller, D. Eckert, Y. Skourski, P. Georgi, R. Marczak, M. Krause and L. Dunsch, J. Magn. Magn. Mater., 2005, 290, 290–293 CrossRef; (f) F. Bondino, C. Cepek, N. Tagmatarchis, M. Prato, H. Shinohara and A. Goldoni, J. Phys. Chem. B, 2006, 110, 7289–7295 CrossRef CAS PubMed; (g) M. Wolf, K. H. Muller, Y. Skourski, D. Eckert, P. Georgi, M. Krause and L. Dunsch, Angew. Chem., Int. Ed., 2005, 44, 3306–3309 CrossRef CAS PubMed; (h) H. Okimoto, R. Kitaura, T. Nakamura, Y. Ito, Y. Kitamura, T. Akachi, D. Ogawa, N. Imazu, Y. Kato, Y. Asada, T. Sugai, H. Osawa, T. Matsushita, T. Muro and H. Shinohara, J. Phys. Chem. C, 2008, 112, 6103–6109 CrossRef CAS; (i) A. Tiwari, G. Dantelle, K. Porfyrakis, A. A. R. Watt, A. Ardavan and G. A. D. Briggs, Chem. Phys. Lett., 2008, 466, 155–158 CrossRef CAS; (j) T. Zuo, M. M. Olmstead, C. M. Beavers, A. L. Balch, G. Wang, G. T. Yee, C. Shu, L. Xu, B. Elliott, L. Echegoyen, J. C. Duchamp and H. C. Dorn, Inorg. Chem., 2008, 47, 5234–5244 CrossRef CAS PubMed; (k) B. Náfrádi, Á. Antal, Á. Pásztor, L. Forró, L. F. Kiss, T. Fehér, É. Kováts, S. Pekker and A. Jánossy, J. Phys. Chem. Lett., 2012, 3, 3291–3296 CrossRef; (l) C. F. Hermanns, M. Bernien, A. Krüger, C. Schmidt, S. T. Waßerroth, G. Ahmadi, B. W. Heinrich, M. Schneider, P. W. Brouwer, K. J. Franke, E. Weschke and W. Kuch, Phys. Rev. Lett., 2013, 111, 167203 CrossRef PubMed; (m) L. Chen, E. E. Carpenter, C. S. Hellberg, H. C. Dorn, M. Shultz, W. Wernsdorfer and I. Chiorescu, J. Appl. Phys., 2011, 109, 07B101 Search PubMed; (n) A. L. Svitova, Y. Krupskaya, N. Samoylova, R. Kraus, J. Geck, L. Dunsch and A. A. Popov, Dalton Trans., 2014, 43, 7387–7390 RSC.
- R. Westerström, J. Dreiser, C. Piamonteze, M. Muntwiler, S. Weyeneth, H. Brune, S. Rusponi, F. Nolting, A. Popov, S. Yang, L. Dunsch and T. Greber, J. Am. Chem. Soc., 2012, 134, 9840–9843 CrossRef PubMed.
- R. Westerström, J. Dreiser, C. Piamonteze, M. Muntwiler, S. Weyeneth, K. Krämer, S.-X. Liu, S. Decurtins, A. Popov, S. Yang, L. Dunsch and T. Greber, Phys. Rev. B: Condens. Matter Mater. Phys., 2014, 89, 060406 CrossRef.
- J. Dreiser, R. Westerström, Y. Zhang, A. A. Popov, L. Dunsch, K. Krämer, S.-X. Liu, S. Decurtins and T. Greber, Chem.–Eur. J., 2014, 20, 13536–13540 CrossRef CAS PubMed.
- (a) M. Bottrill, L. K. Nicholas and N. J. Long, Chem. Soc. Rev., 2006, 35, 557–571 RSC; (b) N. Ishikawa, M. Sugita, T. Ishikawa, S. Koshihara and Y. Kaizu, J. Phys. Chem. B, 2004, 108, 11265–11271 CrossRef CAS; (c) H. L. C. Feltham and S. Brooker, Coord. Chem. Rev., 2014, 276, 1–33 CrossRef CAS; (d) L. Sorace, C. Benelli and D. Gatteschi, Chem. Soc. Rev., 2011, 40, 3092–3104 RSC; (e) J. Luzon and R. Sessoli, Dalton Trans., 2012, 41, 13556–13567 RSC; (f) N. Ishikawa, M. Sugita, T. Ishikawa, S. Koshihara and Y. Kaizu, J. Am. Chem. Soc., 2003, 125, 8694–8695 CrossRef CAS PubMed.
- (a) V. Vieru, L. Ungur and L. F. Chibotaru, J. Phys. Chem. Lett., 2013, 4, 3565–3569 CrossRef CAS; (b) F. Cimpoesu, N. Dragoe, H. Ramanantoanina, W. Urland and C. Daul, Phys. Chem. Chem. Phys., 2014, 16, 11337–11348 RSC.
- (a) Q.-W. Li, J.-L. Liu, J.-H. Jia, J.-D. Leng, W.-Q. Lin, Y.-C. Chen and M.-L. Tong, Dalton Trans., 2013, 42, 11262–11270 RSC; (b) S. Shintoyo, K. Murakami, T. Fujinami, N. Matsumoto, N. Mochida, T. Ishida, Y. Sunatsuki, M. Watanabe, M. Tsuchimoto, J. Mrozinski, C. Coletti and N. Re, Inorg. Chem., 2014, 53, 10359–10369 CrossRef CAS PubMed; (c) K. Yamashita, R. Miyazaki, Y. Kataoka, T. Nakanishi, Y. Hasegawa, M. Nakano, T. Yamamura and T. Kajiwara, Dalton Trans., 2013, 42, 1987–1990 RSC; (d) M. Karbowiak, C. Rudowicz and T. Ishida, Inorg. Chem., 2013, 52, 13199–13206 CrossRef CAS PubMed.
- (a) R. M. Macfarlane, G. Wittmann, P. H. M. vanLoosdrecht, M. deVries, D. S. Bethune, S. Stevenson and H. C. Dorn, Phys. Rev. Lett., 1997, 79, 1397–1400 CrossRef CAS; (b) R. M. Macfarlane, D. S. Bethune, S. Stevenson and H. C. Dorn, Chem. Phys. Lett., 2001, 343, 229–234 CrossRef CAS; (c) Y. Ito, T. Okazaki, S. Okubo, M. Akachi, Y. Ohno, T. Mizutani, T. Nakamura, R. Kitaura, T. Sugai and H. Shinohara, ACS Nano, 2007, 1, 456–462 CrossRef CAS PubMed.
- (a) I. Bertini, C. Luchinat and G. Parigi, Solution NMR of Paramagnetic Molecules. Application to Metallobiomolecules and Models, Elseviser Science B. V., Amsterdam, 2001 Search PubMed; (b) J. A. Peters, J. Huskens and D. J. Raber, Prog. Nucl. Magn. Reson. Spectrosc., 1996, 28, 283–350 CrossRef CAS; (c) W.-M. Liu, M. Overhand and M. Ubbink, Coord. Chem. Rev., 2014, 273–274, 2–12 CrossRef CAS.
- (a) I. Bertini, C. Luchinat and G. Parigi, Prog. Nucl. Magn. Reson. Spectrosc., 2002, 40, 249–273 CrossRef CAS; (b) J. Koehler and J. Meiler, Prog. Nucl. Magn. Reson. Spectrosc., 2011, 59, 360–389 CrossRef CAS PubMed; (c) C. Piguet and C. F. G. C. Geraldes, in Handbook on the Physics and Chemistry of Rare Earths, ed. J. C. G. B. K. A. Gschneidner and V. K. Pecharsky, Elsevier, 2003, vol. 33, pp. 353–463 Search PubMed.
- (a) M. Damjanovic, K. Katoh, M. Yamashita and M. Enders, J. Am. Chem. Soc., 2013, 135, 14349–14358 CrossRef CAS PubMed; (b) N. Ishikawa, T. Iino and Y. Kaizu, J. Phys. Chem. A, 2002, 106, 9543–9550 CrossRef CAS; (c) I. Bertini, M. B. L. Janik, Y.-M. Lee, C. Luchinat and A. Rosato, J. Am. Chem. Soc., 2001, 123, 4181–4188 CrossRef CAS PubMed.
- C. N. Reilley, B. W. Good and J. F. Desreux, Anal. Chem., 1975, 47, 2110–2116 CrossRef CAS.
- (a) M. Yamada, N. Mizorogi, T. Tsuchiya, T. Akasaka and S. Nagase, Chem.–Eur. J., 2009, 15, 9486–9493 CrossRef CAS PubMed; (b) M. Yamada, T. Wakahara, T. Tsuchiya, Y. Maeda, M. Kako, T. Akasaka, K. Yoza, E. Horn, N. Mizorogi and S. Nagase, Chem. Commun., 2008, 558–560 RSC; (c) M. Yamada, T. Wakahara, T. Tsuchiya, Y. Maeda, T. Akasaka, N. Mizorogi and S. Nagase, J. Phys. Chem. A, 2008, 112, 7627–7631 CrossRef CAS PubMed; (d) M. Kanai, K. Porfyrakis, A. N. Khlobystov, H. Shinohara and T. J. S. Dennis, in Fullerenes and Nanotubes: The building Blocks of Next Generation Nanodevices. Electrochemcial Society Proceedings, ed. P. V. Kamat, D. M. Guldi and F. D'Souza, Electrochemical Society, Pennington, 2003, vol. 15, pp. 543–547 Search PubMed; (e) T. Wakahara, J. Kobayashi, M. Yamada, Y. Maeda, T. Tsuchiya, M. Okamura, T. Akasaka, M. Waelchli, K. Kobayashi, S. Nagase, T. Kato, M. Kako, K. Yamamoto and K. M. Kadish, J. Am. Chem. Soc., 2004, 126, 4883–4887 CrossRef CAS PubMed; (f) Y. Takano, M. Aoyagi, M. Yamada, H. Nikawa, Z. Slanina, N. Mizorogi, M. O. Ishitsuka, T. Tsuchiya, Y. Maeda, T. Akasaka, T. Kato and S. Nagase, J. Am. Chem. Soc., 2009, 131, 9340–9346 CrossRef CAS PubMed; (g) M. Yamada, T. Wakahara, Y. Lian, T. Tsuchiya, T. Akasaka, M. Waelchli, N. Mizorogi, S. Nagase and K. M. Kadish, J. Am. Chem. Soc., 2006, 128, 1400–1401 CrossRef CAS PubMed.
- T. Wakahara, S. Okubo, M. Kondo, Y. Maeda, T. Akasaka, M. Waelchli, M. Kako, K. Kobayashi, S. Nagase, T. Kato, K. Yamamoto, X. Gao, E. Van Caemelbecke and K. M. Kadish, Chem. Phys. Lett., 2002, 360, 235–239 CrossRef CAS.
- T. Kodama, N. Ozawa, Y. Miyake, K. Sakaguchi, H. Nishikawa, I. Ikemoto, K. Kikuchi and Y. Achiba, J. Am. Chem. Soc., 2002, 124, 1452–1455 CrossRef CAS PubMed.
- W. Xu, B. Niu, Z. Shi, Y. Lian and L. Feng, Nanoscale, 2012, 4, 6876–6879 RSC.
- W. Xu, B. Niu, L. Feng, Z. Shi and Y. Lian, Chem.–Eur. J., 2012, 18, 14246–14249 CrossRef CAS PubMed.
- X. L. Wang, T. M. Zuo, M. M. Olmstead, J. C. Duchamp, T. E. Glass, F. Cromer, A. L. Balch and H. C. Dorn, J. Am. Chem. Soc., 2006, 128, 8884–8889 CrossRef CAS PubMed.
- (a) Y. Zhang, D. Krylov, S. Schiemenz, M. Rosenkranz, R. Westerstrom, J. Dreiser, T. Greber, B. Buchner and A. A. Popov, Nanoscale, 2014, 6, 11431–11438 RSC; (b) Y. Zhang, A. A. Popov, S. Schiemenz and L. Dunsch, Chem.–Eur. J., 2012, 18, 9691–9698 CrossRef CAS PubMed.
- L. Dunsch, P. Georgi, M. Krause and C. R. Wang, Synth. Met., 2003, 135, 761–762 Search PubMed.
- S. Yang, L. Zhang, W. Zhang and L. Dunsch, Chem.–Eur. J., 2010, 16, 12398–12405 CrossRef CAS PubMed.
- Y. Zhang, S. Schiemenz, A. A. Popov and L. Dunsch, J. Phys. Chem. Lett., 2013, 4, 2404–2409 CrossRef CAS.
- S. Yang, A. A. Popov, C. Chen and L. Dunsch, J. Phys. Chem. C, 2009, 113, 7616–7623 CAS.
- N. Chen, L. Z. Fan, K. Tan, Y. Q. Wu, C. Y. Shu, X. Lu and C. R. Wang, J. Phys. Chem. C, 2007, 111, 11823–11828 CAS.
- S. Stevenson, C. B. Rose, J. S. Maslenikova, J. R. Villarreal, M. A. Mackey, B. Q. Mercado, K. Chen, M. M. Olmstead and A. L. Balch, Inorg. Chem., 2012, 51, 13096–13102 CrossRef CAS PubMed.
- S. Stevenson, C. Chancellor, H. M. Lee, M. M. Olmstead and A. L. Balch, Inorg. Chem., 2008, 47, 1420–1427 CrossRef CAS PubMed.
- M. M. Olmstead, A. de Bettencourt-Dias, J. C. Duchamp, S. Stevenson, H. C. Dorn and A. L. Balch, J. Am. Chem. Soc., 2000, 122, 12220–12226 CrossRef CAS.
- (a) A. L. Svitova, A. A. Popov and L. Dunsch, Inorg. Chem., 2013, 52, 3368–3380 CrossRef CAS PubMed; (b) S. F. Yang, A. A. Popov, M. Kalbac and L. Dunsch, Chem.–Eur. J., 2008, 14, 2084–2092 CrossRef CAS PubMed; (c) S. F. Yang, M. Kalbac, A. Popov and L. Dunsch, ChemPhysChem, 2006, 7, 1990–1995 CrossRef CAS PubMed.
- S. Meiboom and D. Gill, Rev. Sci. Instrum., 1958, 29, 688–691 CrossRef CAS.
- A. A. Granovsky, Firefly version 8.00, 2013. http://classic.chem.msu.su/gran/firefly/index.html Search PubMed.
- F. Weigend and R. Ahlrichs, Phys. Chem. Chem. Phys., 2005, 7, 3297–3305 RSC.
- M. Dolg, U. Wedig, H. Stoll and H. Preuss, J. Chem. Phys., 1987, 86, 866–872 CrossRef CAS.
- M. Dolg, H. Stoll, A. Savin and H. Preuss, Theor. Chim. Acta, 1989, 75, 173–194 CrossRef CAS.
- D. A. Pantazis and F. Neese, J. Chem. Theory Comput., 2009, 5, 2229–2238 CrossRef CAS.
- (a) F. Neese, WIREs Computational Molecular Science, 2012, 2, 73–78 CrossRef CAS; (b) F. Neese, Orca version 3.0, Institute for physical and theoretical chemistry, Bonn, 2014 Search PubMed.
- T. A. Keith, AIMAll (Version 14.04.17), 2014, http://aim.tkgristmill.com Search PubMed.
- M. Rotter, J. Magn. Magn. Mater., 2004, 272–276, Supplement, E481–E482 CrossRef.
- W. Humphrey, A. Dalke and K. Schulten, J. Mol. Graphics, 1996, 14, 33–38 CrossRef CAS PubMed.
- S. Yang, A. A. Popov and L. Dunsch, Angew. Chem., Int. Ed. Engl., 2008, 47, 8196–8200 CrossRef CAS PubMed.
- (a) A. M. Funk, K.-L. N. A. Finney, P. Harvey, A. M. Kenwright, E. R. Neil, N. J. Rogers, P. Kanthi Senanayake and D. Parker, Chem. Sci., 2015 10.1039/C4SC03429E; (b) K. R. Meihaus, S. G. Minasian, W. W. Lukens, S. A. Kozimor, D. K. Shuh, T. Tyliszczak and J. R. Long, J. Am. Chem. Soc., 2014, 136, 6056–6068 CrossRef CAS PubMed.
- S. Klod, L. Zhang and L. Dunsch, J. Phys. Chem. C, 2010, 114, 8264–8267 CAS.
- (a) J. Zhang and H. C. Dorn, Fullerenes, Nanotubes, Carbon Nanostruct., 2014, 22, 35–46 CrossRef CAS; (b) W. Fu, X. Wang, H. Azuremendi, J. Zhang and H. C. Dorn, Chem. Commun., 2011, 47, 3858–3860 RSC; (c) Y. Feng, T. Wang, J. Xiang, L.-H. Gan, B. Wu, L. Jiang and C.-R. Wang, Dalton Trans., 2015, 44, 2057–2061 RSC.
- (a) S. D. Pietro, S. L. Piano and L. D. Bari, Coord. Chem. Rev., 2011, 255, 2810–2820 CrossRef; (b) A. G. Martynov, Y. G. Gorbunova and A. Y. Tsivadze, Dalton Trans., 2011, 40, 7165–7171 RSC.
- (a) B. Bleaney, J. Magn. Reson., 1972, 8, 91–100 CAS; (b) B. Bleaney, C. M. Dobson, B. A. Levine, R. B. Martin, R. J. P. Williams and A. V. Xavier, J. Chem. Soc., Chem. Commun., 1972, 791–793 RSC.
- S. Spiliadis and A. A. Pinkerton, J. Chem. Soc., Dalton Trans., 1982, 1815–1818 RSC.
- (a) N. Ouali, J.-P. Rivera, D. Chapon, P. Delangle and C. Piguet, Inorg. Chem., 2004, 43, 1517–1529 CrossRef CAS PubMed; (b) E. Terazzi, J.-P. Rivera, N. Ouali and C. Piguet, Magn. Reson. Chem., 2006, 44, 539–552 CrossRef CAS PubMed.
- A. Rodríguez-Rodríguez, D. Esteban-Gómez, A. de Blas, T. Rodríguez-Blas, M. Botta, R. Tripier and C. Platas-Iglesias, Inorg. Chem., 2012, 51, 13419–13429 CrossRef PubMed.
- M. L. Munzarová, P. Kubácek and M. Kaupp, J. Am. Chem. Soc., 2000, 122, 11900–11913 CrossRef.
- (a) P. Jakes and K. P. Dinse, J. Am. Chem. Soc., 2001, 123, 8854–8855 CrossRef CAS PubMed; (b) B. Elliott, A. D. Pykhova, J. Rivera, C. M. Cardona, L. Dunsch, A. A. Popov and L. Echegoyen, J. Phys. Chem. C, 2013, 117, 2344–2348 CrossRef CAS; (c) A. A. Popov and L. Dunsch, J. Am. Chem. Soc., 2008, 130, 17726–17742 CrossRef CAS PubMed.
- (a) V. S. Mironov, Y. G. Galyametdinov, A. Ceulemans, C. Görller-Walrand and K. Binnemans, J. Chem. Phys., 2002, 116, 4673–4685 CrossRef CAS; (b) B. R. McGarvey, J. Magn. Reson., 1979, 33, 445–455 CAS.
- (a) A. A. Popov, J. Comput. Theor. Nanosci., 2009, 6, 292–317 CrossRef CAS; (b) S. F. Yang, S. I. Troyanov, A. A. Popov, M. Krause and L. Dunsch, J. Am. Chem. Soc., 2006, 128, 16733–16739 CrossRef CAS PubMed.
- L. Ungur and L. F. Chibotaru, Phys. Chem. Chem. Phys., 2011, 13, 20086–20090 RSC.
- (a) J. Sievers, Phys. Rev. B: Condens. Matter Mater. Phys., 1982, 45, 289–296 CrossRef CAS; (b) J. D. Rinehart and J. R. Long, Chem. Sci., 2011, 2, 2078–2085 RSC.
- (a) J. J. Le Roy, I. Korobkov, J. E. Kim, E. J. Schelter and M. Murugesu, Dalton Trans., 2014, 43, 2737–2740 RSC; (b) S. Hino, M. Maeda, K. Yamashita, Y. Kataoka, M. Nakano, T. Yamamura, H. Nojiri, M. Kofu, O. Yamamuro and T. Kajiwara, Dalton Trans., 2013, 42, 2683–2686 RSC.
- J. D. Rinehart and J. R. Long, Dalton Trans., 2012, 41, 13572–13574 RSC.
- A. Tiwari, G. Dantelle, K. Porfyrakis, R. A. Taylor, A. A. R. Watt, A. Ardavan and G. A. D. Briggs, J. Chem. Phys., 2007, 127, 194504 CrossRef PubMed.
- (a) J. J. Baldoví, J. M. Clemente-Juan, E. Coronado and A. Gaita-Ariño, Inorg. Chem., 2014, 53, 11323–11327 CrossRef PubMed; (b) N. F. Chilton, D. Collison, E. J. L. McInnes, R. E. P. Winpenny and A. Soncini, Nat. Commun., 2013, 4, 2551, DOI:10.1038/ncomms3551; (c) J. van Leusen, M. Speldrich, H. Schilder and P. Kögerler, Coord. Chem. Rev., 2015 DOI:10.1016/j.ccr.2014.10.011.
- V. V. Voevodin, S. A. Zhumatiy, S. I. Sobolev, A. S. Antonov, P. A. Bryzgalov, D. A. Nikitenko, K. S. Stefanov and V. V. Voevodin, in Open Systems J., 2012, http://www.osp.ru/os/2012/2007/13017641 Search PubMed.
Footnote |
| † Electronic supplementary information (ESI) available: Details of relaxation time measurements, ligand field splitting, additional correlation between data points, Cartesian coordinates. See DOI: 10.1039/c5sc00154d |
| This journal is © The Royal Society of Chemistry 2015 |

