 Open Access Article
Assessing the exchange coupling in binuclear lanthanide(III) complexes and the slow relaxation of the magnetization in the antiferromagnetically coupled Dy2 derivative†
Chun Y.
Chow
a,
Hélène
Bolvin
b,
Victoria E.
Campbell
c,
Régis
Guillot
c,
Jeff W.
Kampf
a,
Wolfgang
Wernsdorfer
d,
Frédéric
Gendron
e,
Jochen
Autschbach
e,
Vincent L.
Pecoraro
*a and
Talal
Mallah
 *c
*c
aDepartment of Chemistry, University of Michigan, Ann Arbor, Michigan 48108, USA. E-mail: vlpec@umich.edu
bLaboratiore de Chimie et Physique Quantiques, Université Toulouse III, 118 route de Narbonne, 31062 Toulouse, France
cInstitut de Chimie Moléculaire et des Matériaux d'Orsay, CNRS, Université de Paris Sud 11, 91405 Orsay Cedex, France. E-mail: talal.mallah@u-psud.fr
dInstitut Néel, CNRS, Université J. Fourier, BP 166 25, Avenue des Martyrs, 38405 Grenoble, France
eDepartment of Chemistry, University at Buffalo, State University of New York, Buffalo, NY 14260-3000, USA
First published on 7th May 2015
Abstract
We report here the synthesis and the investigation of the magnetic properties of a series of binuclear lanthanide complexes belonging to the metallacrown family. The isostructural complexes have a core structure with the general formula [Ga4Ln2(shi3−)4(Hshi2−)2(H2shi−)2(C5H5N)4(CH3OH)x(H2O)x]·xC5H5N·xCH3OH·xH2O (where H3shi = salicylhydroxamic acid and Ln = GdIII1; TbIII2; DyIII3; ErIII4; YIII5; YIII0.9DyIII0.16). Apart from the Er-containing complex, all complexes exhibit an antiferromagnetic exchange coupling leading to a diamagnetic ground state. Magnetic studies, below 2 K, on a single crystal of 3 using a micro-squid array reveal an opening of the magnetic hysteresis cycle at zero field. The dynamic susceptibility studies of 3 and of the diluted DyY 6 complexes reveal the presence of two relaxation processes for 3 that are due to the excited ferromagnetic state and to the uncoupled DyIII ions. The antiferromagnetic coupling in 3 was shown to be mainly due to an exchange mechanism, which accounts for about 2/3 of the energy gap between the antiferro- and the ferromagnetic states. The overlap integrals between the Natural Spin Orbitals (NSOs) of the mononuclear fragments, which are related to the magnitude of the antiferromagnetic exchange, are one order of magnitude larger for the Dy2 than for the Er2 complex.
Introduction
The design and synthesis of coordination compounds that contain metal centers and combine high spin and magnetic anisotropy have been an active area of research since the discovery of superparamagnetic behavior in the archetypal [Mn12O12(OCR)16(H2O)4],1 the first reported single-molecule magnet (SMM). These molecular magnets are characterized by magnetic bistability and have potential uses in areas such as magnetic data storage, spintronics2 and quantum computing.3 A major obstacle to the realization of such applications is the development of molecules with large spin-reversal barriers that will function at practical temperatures. Early efforts towards increasing this barrier involved synthesizing large transition-metal based clusters with high spin ground states.1,4–6 In order to increase spin, magnetic anisotropy and subsequently, the energy barrier, much of the current SMM research has shifted towards lanthanide based complexes.7 Due to strong unquenched orbital angular momentum and significant spin–orbit coupling, lanthanide ions possess large intrinsic anisotropy such that mononuclear lanthanide complexes can exhibit slow magnetic relaxation.8Unlike their transition-metal counterparts, lanthanide-based SMMs are at the weak-exchange limit,9 and have dynamic magnetic behavior which cannot be adequately described within the framework of the zero-field splitting phenomenon,10 which can be used to understand the origin of the energy barrier in transition-metal SMMs. Furthermore, lanthanide SMMs display dynamic magnetization behavior that can be complicated by the presence of multiple relaxation pathways.11 Nonetheless, when it comes to designing SMMs with large energy barriers, more metal centers may be better, as it has been shown that metal–metal exchange coupling can aid in suppressing quantum tunneling phenomena that occur in polynuclear systems.12 For example, Long and coworkers have shown that a terbium(III) dimer that is strongly coupled through a radical bridge can display hysteresis of a purely molecular origin up to 14 K.13 Correspondingly, SMMs with some of the largest energy barriers reported to date have been multinuclear lanthanide complexes.14,15 Unfortunately, due to the radial contraction of 4f orbitals, lanthanide–lanthanide interactions tend to be weak and most polymetallic lanthanide SMMs have magnetic properties which are of single-ion origin;7 for instance a tetranuclear Dy4III exhibited barrier heights of 9.7 and 107 K corresponding to two crystallographically independent DyIII sites.15 In these compounds, the variable temperature ac data show only one distinct relaxation peak indicative of the single-ion relaxation. In order to understand magnetic behavior in complex polynuclear SMMs, simpler model systems are essential for elucidating the underlying 4f–4f interactions.16,17
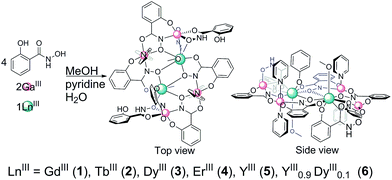
The metallacrown18 class of supramolecular compounds utilizes versatile ligands which have been used to produce both purely transition-metal and mixed 3d–4f heterometallic SMMs.4,6,19–21 We employed this synthetic strategy to study lanthanide-only SMMs with the diamagnetic GaIII ion selected to form the backbone of metallacrown complex which isolates the pairs of lanthanide ions, reducing intermolecular dipolar interactions. Herein, we report the synthesis and characterization of an isostructural series of symmetric hexanuclear Ga4III–Ln2III compounds with the general formula [Ga4Ln2(shi3−)4(Hshi2−)2(H2shi−)2(C5H5N)4(CH3OH)x(H2O)x]·xC5H5N·xCH3OH·xH2O (LnIII = GdIII1, TbIII2, DyIII3, ErIII4, YIII5, YIII0.9DyIII0.16), where the dimeric lanthanide Ln2O2 unit is protected by the Ga4 ring, thus precluding large dipolar intermolecular interactions. To date, compound 3 is a rare example of an antiferromagnetically coupled Ising-like lanthanide dimer with a diamagnetic ground state that shows an opening of the hysteresis loop at zero magnetic field, a behavior that was also observed in the antiferromagnetically coupled Dy3 complexes.22
Experimental section
General information
All reagents and chemicals were purchased from Sigma Aldrich or Alfa Aesar and were used without further purification. All reactions were carried out under aerobic conditions. Elemental analysis was performed by Atlantic Microlabs Inc. All reactions were carried under aerobic conditions.Synthesis of Gd2Ga4 (1)
Salicylhydroxamic acid (153.1 mg, 1.000 mmol), Gd(NO3)3·6H2O (112.8 mg, 0.2500 mmol), Ga(NO3)3·xH2O (127.9 mg, 0.5000 mmol) were dissolved in 46 mL methanol. 13 mL pyridine was added drop wise to this solution, followed by 6.5 mL H2O. The solution was stirred for 30 seconds and then filtered. Slow evaporation of half of the solution yielded crystalline compound after 2 weeks.Synthesis of Tb2Ga4 (2), Dy2Ga4 (3), Er2Ga4 (4) and Y2Ga4 (5)
A general procedure for complexes 2, 3, 4 and 5 is as follows. Salicylhydroxamic acid (153.1 mg, 1.000 mmol), Ln(NO3)3·xH2O (0.2500 mmol), Ga(NO3)3·xH2O (127.9 mg, 0.5000 mmol) were dissolved in 21 mL methanol. 6 mL pyridine was added drop wise to this solution, followed by 3 mL H2O. The solution was stirred for 30 seconds and then filtered. Slow evaporation of half of the solution yielded crystalline compound after 2 weeks.Synthesis of Y1.8Dy0.2Ga4 (6)
Salicylhydroxamic acid (153.1 mg, 1.000 mmol), Dy(NO3)3·5H2O (11.0 mg, 0.0250 mmol), Y(NO3)3·5H2O (82.1 mg, 0.225 mmol), Ga(NO3)3·xH2O (127.9 mg, 0.5 mmol) were dissolved in 21 mL methanol. 6 mL pyridine was added drop wise to this solution, followed by 3 mL H2O. The solution was stirred for 30 seconds and then filtered. Slow evaporation of half of the solution yielded crystalline compound after 2 weeks.![[thin space (1/6-em)]](https://www.rsc.org/images/entities/char_2009.gif) 043.9599 Å3.
043.9599 Å3.
Single-crystal X-ray diffraction
Crystal data for compound 1 were collected at 85(2) K on a Bruker SMART-APEX CCD-based X-ray diffractometer equipped with a low temperature device and fine-focus Mo-target X-ray tube (λ = 0.71073 Å), operated at 1500 W power (50 kV, 30 mA). The frames were integrated with the Bruker SAINT23 software package with a narrow frame algorithm. The data were processed with SADABS24 and corrected for absorption.Crystal data for compound 2 were collected on a Kappa X8 APPEX II Bruker diffractometer with graphite-monochromated Mo Kα radiation (= 0.71073 Å). Crystals were mounted on a CryoLoop (Hampton Research) with Paratone-N (Hampton Research) as cryoprotectant and then flashfrozen in a nitrogen-gas stream at 100 K. The temperature of the crystal was maintained at the selected value (100 K) by means of a 700 series Cryostream cooling device to within an accuracy of ±1 K. The data were corrected for Lorentz polarization, and absorption effects.
Crystal data for compounds 3, 4 and 5 were collected at 85(2) K on an AFC10K Saturn 944+ CCD-based X-ray diffractometer equipped with a Micromax007HF Cu-target microfocus rotating anode (λ = 1.54187 Å), operated at 1200 W power (40 kV, 30 mA). The data were processed with CrystalClear 2.0 and corrected for absorption.25
All structures were solved and refined with the SHELXTL (version 6.12) software package.26 All non-hydrogen atoms were refined anisotropically. Hydrogen atoms are placed in their idealized positions. Additional details are provided in Table 1.
| 1 | 2 | 3 | 4 | 5 | |
|---|---|---|---|---|---|
| a R 1 = Σ(‖Fo| − |Fc‖)/Σ|Fo|. b wR2 = [Σ[w(Fo2 − Fc2)2]/Σ[w(F°)2]]1/2; w = 1/[σ2(Fo2) + (mp)2 + np]; p = [max(Fo2,0) + 2Fc2]/3 (m and n are constants); σ = [Σ[w(Fo2 − Fc2)2]/(n − p)]1/2. | |||||
| Mol formula | Ga4Gd2C94H93.62N15O31.31 | Ga4Tb2C94H93N15O31 | Ga4Dy2C94H93N15O31 | Ga4Er2C93H91N15O31 | Ga4Y2C94H93N15O31 |
| fw (g mol−1) | 2527.80 | 2525.55 | 2532.71 | 2528.21 | 2385.53 |
| Cryst syst/space group | Monoclinic, C2/c | Monoclinic, C2/c | Monoclinic, C2/c | Monoclinic, C2/c | Monoclinic, C2/c |
| T (K) | 85(2) | 100(1) | 85(2) | 85(2) | 85(2) |
| Wavelength (Å) | 0.71073 | 0.71073 | 1.54178 | 1.54178 | 1.54178 |
| a (Å) | 25.233(5) | 25.1697(6) | 25.1638(18) | 25.1476(5) | 25.1053(18) |
| b (Å) | 22.054(4) | 22.1217(6) | 22.1781(4) | 22.1380(4) | 22.1794(4) |
| c (Å) | 17.997(4) | 17.9895(5) | 18.0649(3) | 18.0285(13) | 18.0733(3) |
| α (deg) | 90 | 90 | 90 | 90 | 90 |
| β (deg) | 99.09(3) | 99.3020(10) | 99.353(7) | 99.177(7) | 99.377(7) |
| γ (deg) | 90 | 90 | 90 | 90 | 90 |
| V (Å3) | 9889.3(3) | 9884.8(5) | 9947.7(8) | 9908.3(8) | 9929.1(8) |
| Z | 4 | 4 | 4 | 4 | 4 |
| Density, ρ (g cm−3) | 1.698 | 1.697 | 1.691 | 1.695 | 1.596 |
| Abs coeff., μ (mm−1) | 2.486 | 2.462 | 9.839 | 4.949 | 3.460 |
| F(000) | 5060 | 5056 | 5063 | 5048 | 4848 |
| θ range for data collection (deg) | 1.59–25.44 | 1.59–30.67 | 3.44–68.23 | 3.45–68.24 | 3.44–68.25 |
| Limiting indices | −30 ≤ h ≤ 30, | −30 ≤ h ≤ 36, | −27 ≤ h ≤ 29 | −30 ≤ h ≤ 30, | −30 ≤ h ≤ 30, |
| −26 ≤ k ≤ 26, | −31 ≤ k ≤ 31, | −26 ≤ k ≤ 26 | −26 ≤ k ≤ 26, | −26 ≤ k ≤ 25, | |
| −21 ≤ l ≤ 21 | −25 ≤ l ≤ 25 | −21 ≤ l ≤ 21 | −21 ≤ l ≤ 21 | −21 ≤ l ≤ 21 | |
| Reflns collected/unique | 76![[thin space (1/6-em)]](https://www.rsc.org/images/entities/char_2009.gif) 042/9136 042/9136 |
152![[thin space (1/6-em)]](https://www.rsc.org/images/entities/char_2009.gif) 738/15 738/15![[thin space (1/6-em)]](https://www.rsc.org/images/entities/char_2009.gif) 061 061 |
133![[thin space (1/6-em)]](https://www.rsc.org/images/entities/char_2009.gif) 023/9072 023/9072 |
139![[thin space (1/6-em)]](https://www.rsc.org/images/entities/char_2009.gif) 170/9069 170/9069 |
140![[thin space (1/6-em)]](https://www.rsc.org/images/entities/char_2009.gif) 855/9097 855/9097 |
| Completeness to θ (%) | 99.8 | 99.2 | 99.5 | 99.9 | 100.0 |
| No. of data/restraints/params | 9136/128/745 | 15![[thin space (1/6-em)]](https://www.rsc.org/images/entities/char_2009.gif) 061/70/750 061/70/750 |
9072/92/746 | 9069/76/741 | 9097/175/744 |
| Goodness of fit on F2 | 1.075 | 1.130 | 1.031 | 1.100 | 1.103 |
| Final R indices [I > 2σ(I)] | R 1 = 0.0422 | R 1 = 0.0372 | R 1 = 0.0572 | R 1 = 0.0868 | R 1 = 0.0437 |
| wR2b = 0.1051 | wR2b = 0.0814 | wR2b = 0.1545 | wR2b = 0.2382 | wR2b = 0.1221 | |
| R Indices (all data) | R 1 = 0.0616 | R 1 = 0.0657 | R 1 = 0.0627 | R 1 = 0.0957 | R 1 = 0.0459 |
| wR2b = 0.1206 | wR2b = 0.0980 | wR2b = 0.1591 | wR2a = 0.2574 | wR2b = 0.1238 | |
| Largest diff peak and hole (e− Å−3) | 1.657 and −0.742 | 1.467 and −0.899 | 1.792 and −1.514 | 2.175 and −0.899 | 0.942 and −0.745 |
Magnetic measurements
Variable-temperature susceptibility, variable-field magnetization and ac susceptibility measurements on polycrystalline samples mulled in eicosane were performed on a Quantum Design MPMS SQUID magnetometer. Variable-temperature dc susceptibility measurements were performed at 2000 Oe from 2–300 K. Isothermal magnetization measurements were performed at 2 K from 0–7 T. AC magnetic susceptibility measurements were done at both zero and applied fields (2000 Oe for 3 and 750 Oe for 6) with an ac drive field of 3 Oe at frequencies ranging from 1 to 1488 Hz. Dc susceptibilities were corrected for the sample holder and eicosane and for diamagnetism of constituent atoms using Pascal's constants.Micro-SQUID measurements
Magnetization measurements on oriented single crystals were carried out with an array of micro-SQUIDs.27 The field aligned parallel to the easy-axis of magnetization by the transversal field method.28 Measurements were performed at a temperature range from 0.03 to 5 K in fields up to 1.1 T with sweep rates between 0.008 and 0.280 T s−1.Computational details
Calculations are performed within the crystallographic geometry on the binuclear species where one lanthanide has been replaced by a LuIII diamagnetic ion. Magnetic properties are calculated using first principle methods on a monomeric species by replacing one of the lanthanide by a diamagnetic lutetium of configuration 4f14. Since the two lanthanide atoms are related by an inversion center, there is only one type of monomer. All atoms are described with all electron basis sets ANO-RCC,29 Ln atoms with TZP quality, N and O atoms with DZP quality and other atoms with DZ quality. The excited states of the complexes have been calculated with the SO-CASSCF method using the MOLCAS78 suite of programs (MOLCAS80 for the gadolinium complex).30 The active space consists of n electrons in the 7 4f orbitals for an atom of configuration 4fn. First, a CASSCF (Complete Active Space Self Consistent Field) calculation is performed:31 all the states with the maximal value of the spin are considered in the state average procedure. In the case of gadolinium, all the sextet states are considered in addition to the octuplet ground state. Spin–orbit coupling is evaluated as a state interaction between all CASSCF wave functions by the RASSI (Restricted Active Space State Interaction) method.32 Spin–Orbit (SO) integrals are evaluated within the AMFI approximation.33 The calculation of all the properties is implemented in a local program. g factors are calculated according to ref. 34 even in the case of non-degenerate states (see ESI† for details). The dipolar magnetic interaction is calculated aswhere R is the intermetallic distance, z the intermetallic direction and μ0 the magnetic constant. The exchange interactions are carried by the spin densities and are described by a Heisenberg–Dirac–Van Vleck (HDVV) Hamiltonian
 and
and  are the total and spin momentum operators for site A(B). This scheme has been first proposed by Lines in the 70 s,35 it has been applied to lanthanide complexes by Sutter et al. in 2002 (ref. 36) and since 2007, is applied in the group of Chibotaru37 A local modification of MOLCAS was used to generate natural spin orbitals (NSOs) from SO-CASSCF calculations38 (see ESI†).
Results and discussion
Synthesis and characterization
The flexible multidentate ligand salicylhydroxamic acid (H3shi) has been used in the synthesis of numerous metallacrown complexes,18 including several single-molecule magnets.6,20,21 Both predictable structure types (such as 9-MC-3, 12-MC-4) as well as compounds with unpredictable molecular geometry can be synthesized with H3shi by adjusting reaction and solvent conditions, allowing for isolation and study of a wide array of multinuclear metallacrown complexes. Pyridine (which acts as a base, a solvent and a ligand) has unique properties, which have resulted in several metallacrown complexes with both previously known and new structure types.21,39 This multipurpose solvent aids in crystallization by forming π-interactions and coordinates to metal sites, forming structures whose architectures are directed by π-interactions and steric effects. Here, the reaction of H3shi, Ga(NO3)3·xH2O and Ln(NO3)·xH2O a 4![[thin space (1/6-em)]](https://www.rsc.org/images/entities/char_2009.gif) :
:![[thin space (1/6-em)]](https://www.rsc.org/images/entities/char_2009.gif) 2
2![[thin space (1/6-em)]](https://www.rsc.org/images/entities/char_2009.gif) :
:![[thin space (1/6-em)]](https://www.rsc.org/images/entities/char_2009.gif) 1 stoichiometric ratio in a solution of methanol, pyridine and water followed by slow evaporation of solvent afforded neutral macrocyclic complexes (Scheme 1) with the general formula [Ga4Ln2(shi3−)4(Hshi2−)2(H2shi)2(C5H5N)4(CH3OH)(H2O)]·3C5H5N·2CH3OH·3H2O. The structures of compounds 1–5 were determined by X-ray crystallography to be isostructural and crystallize in the monoclinic C2/c space group (Table 1). Slight differences in the composition of bound and lattice solvents were observed across the series of complexes. Compound 6 was determined to have the same unit cell parameters and is isostructural to 3 and 5 (Y2Ga4). It was synthesized with 10% DyIII and 90% YIII in solution. Statistically speaking, such a reaction would form crystals composed of 81% Y2Ga4 (diamagnetic), 18% DyYGa4 and 1% Dy2Ga4 (3).
1 stoichiometric ratio in a solution of methanol, pyridine and water followed by slow evaporation of solvent afforded neutral macrocyclic complexes (Scheme 1) with the general formula [Ga4Ln2(shi3−)4(Hshi2−)2(H2shi)2(C5H5N)4(CH3OH)(H2O)]·3C5H5N·2CH3OH·3H2O. The structures of compounds 1–5 were determined by X-ray crystallography to be isostructural and crystallize in the monoclinic C2/c space group (Table 1). Slight differences in the composition of bound and lattice solvents were observed across the series of complexes. Compound 6 was determined to have the same unit cell parameters and is isostructural to 3 and 5 (Y2Ga4). It was synthesized with 10% DyIII and 90% YIII in solution. Statistically speaking, such a reaction would form crystals composed of 81% Y2Ga4 (diamagnetic), 18% DyYGa4 and 1% Dy2Ga4 (3).
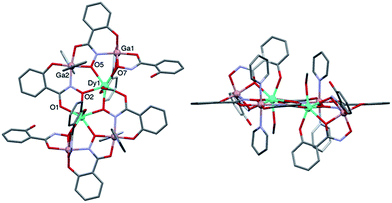
As a representative example, the structure of compound 3 (Fig. 1) can be described as a centrosymmetric μ2-oxo bridged di-lanthanide core surrounded by four peripheral GaIII ions. In the core moiety of the asymmetric unit, one DyIII and two GaIII ions are chelated by four fully and partially deprotonated ligands and coordinated by pyridine and methanol or water solvent molecules. In Fig. 1, Dy1 is chelated by the carbonyl (O1) and hydroximate oxygens (O2) of an in-plane shi3− and by the carbonyl (O7) and phenoxide oxygens of an out-of-plane Hshi2−. The symmetry-generated hydroximate oxygen O2a also coordinates to Dy1, to form a Dy2(μ2-OR)2 core. Hydroximate oxygens from an in-plane shi3− (O5) and Hshi2− (O11) also coordinate, bridging Dy1 to Ga2a and Ga1, respectively. Dy1 is capped by a disordered water (O510) or methanol (O500, C500) with shared occupancy, to complete the coordination sphere around Dy1 which can be described as having distorted 8-coordinate trigonal dodecahedral geometry (Table S1†). The four outer GaIII cations, with roughly octahedral geometry, surround the two central DyIII ions and are ligated by fully and partially deprotonated H3shi. Four fully deprotonated shi3− and two H2shi− coordinate the four GaIII and two DyIII ions to form the molecular plane (Fig. 1, left), with two doubly deprotonated Hshi2− pointing above and below the plane (Fig. 1, right).
Static magnetic studies and theoretical calculations
For complexes, the variable-temperature dc susceptibility measurements were performed at an applied field of 2000 Oe from 2 to 300 K (Fig. S3†).; the variable-field magnetization measurements were performed at 2 K from 0 to 7 T (Fig. S3†). Globally, the general behavior of all compounds is consistent with other lanthanide complexes reported in the literature.17,22,40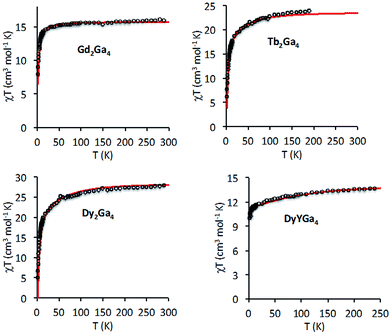 | ||
| Fig. 2 Temperature dependence of the χT product for complexes 1, 2, 3 and 6. The solid lines correspond to the best fit (see text). | ||
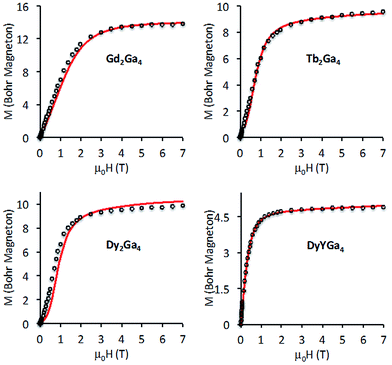 | ||
| Fig. 3 Magnetization vs. applied field at 2 K for complexes 1, 2, 3 and 6. The solid lines correspond to the best fit (see text). | ||
Gd2Ga41
The room temperature χT value for 1 (GdIII: 8S7/2, 15.9 cm3 K mol−1) is in good agreement with the expected value for two non-interacting GdIII ions. Upon cooling, χT is almost constant down to T = 10 K and then slightly decreases to reach a value of 7.8 cm3 mol−1 K at 2 K. This decrease is probably due to an intramolecular antiferromagnetic exchange coupling between the two GdIII ions. The M = f(μ0H) curve increases with the applied magnetic field and reaches saturation (13.8 Bohr Magneton) at 7 T. It is possible to fit the susceptibility and the magnetization data (see Fig. 2 and 3) using a model based on the spin Hamiltonian H = −JSGd1 × SGd2 + gßHzSz. The best fit parameters are g = 1.98 and J = −0.16 cm−1, where g is the Lande factor and J the interaction parameter between the local S = 7/2 spins of the GdIII ions. This value is in agreement with those reported in the literature for a dinuclear μ-oxo GdIII with a similar geometry.41 The GdIII ion has no first order angular momentum and almost a negligible zero field splitting. In such a case, the dipolar interaction is expected to be very weak. Thus, the antiferromagnetic interaction found experimentally is due, mainly, to exchange and splits the low-lying spin states S = 0 to 7 by an energy equal to 4.48 cm−1 (JS(S + 1)/2), with |J| = 0.16 cm−1 and S = 7/2 (see Table S2 and S3†).§Tb2Ga42, Dy2Ga43 and DyYGa46
The χT product and the field dependent magnetization at 2 K for 6 (Fig. 2 and 3) have the behavior expected for a mononuclear DyIII complex (6H15/2, C = 14.17 cm3 K mol−1). Ab initio calculations allows for the determination of the energy spectrum and the associated gi values (Table S4†) (i = 1, 2 and 3 are the principal directions of the g tensor with 1 corresponding to the largest value). The ground state corresponds to MJ = ±15/2, with one very large g1 = 19.85 (g2 = 0.08, g3 = 0.04),¶ indicating an easy axis of the magnetization as depicted in Fig. 4 (left). The magnetization axis forms an angle of 79° with the Dy–Dy axis and is very close to the plane containing the DyIII ions and the bridging oxygen atoms. The experimental magnetic data can be reproduced using the MJ energy spectrum determined from ab initio calculations, which confirms the nature of the ground level (MJ = ±15/2) and the fact that the diluted compound mainly contains the paramagnetic DyYGa4 species.The χT product for 2 and 3 have the usual behavior expected for TbIII and DyIII ions (7F6 ground state C = 11.82 cm3 mol−1 K for an isolated TbIII); it slowly diminishes from 300 K to around 50 K and then decreases more abruptly. This behavior is due to the thermal depopulation of excited MJ sublevels and may also be caused by an antiferromagnetic interaction between the lanthanide ions. The magnetization measured at 2 K presents a sigmoidal shape at low applied magnetic fields with an inflection point around 0.5 T, which is the signature of the presence of an antiferromagnetic coupling within the two compounds. It is worth noting that the magnetization vs. field curve of 6 does not possess an inflection point and its χT product value at 2 K (10.8 cm3 mol−1 K) is larger than that of 3 (2.6 cm3 mol−1 K computed per 1 DyIII), which confirms that the inflection point in 3 is due to intra- and not to intermolecular antiferromagnetic interaction. In order to determine the value of the inflection point more accurately in the M = f(μ0H) curve, we measured the magnetization at very low temperature on a single crystal of 3 using an array of micro-squids with the magnetic field parallel to the anisotropy axis of the crystal. The curves at T = 1 and 0.03 K show sharp steps and a crossing point at μ0H = 0.51 T (Fig. S1†).
The sharp steps are the result of the crossover from an antiparallel (antiferromagnetic: AF) to a parallel (ferromagnetic: F) alignment of the anisotropic moments of the two DyIII ions. The field value of the crossing point allows for computation of the energy difference ΔE (ΔE = g1 × β × μ0H = 19.47 × 0.496 × 0.51) between the AF and the F states and was found equal to 4.9 cm−1. The magnetic dipolar interaction between the two DyIII ions (Table S5†), determined by ab initio calculations of the isolated ion shows that the minimum energy is obtained when the magnetization moments are antiparallel, which is expected because the easy magnetization axis is almost perpendicular to the Dy–Dy axis. These calculations lead to an AF–F energy gap of 1.26 cm−1 well below the experimental one extracted from the magnetization data (4.9 cm−1). In order to account for the experimental energy gap, we introduced an additional interaction due to an exchange coupling between the two DyIII ions (see Experimental section). A good fit of the data of 3 is obtained using a Jexc value of −0.29 cm−1 (Fig. 3, S1 and Table S5†). The difference between the calculated and the experimental data at low temperature (Fig. S1†) is the signature of intermolecular dipolar interaction within the crystal that can be observed at such low temperatures.
For the Tb complex 2, the situation is similar to that of the Dy analogue; an easy axis of magnetization is present, where g1 = 17.85 and g2 = g3 = 0 for the MJ = ±6 ground levels (Table S6, see ESI†). It forms an angle of 79° with the Tb–Tb intermetallic axis (Fig. S2†). The computed dipolar interaction leads to a splitting between the AF (ground level) and the F states of 0.5 cm−1, which is not sufficient to reproduce the experimental data (Table S7†). Introducing an additional antiferromagnetic exchange interaction, 2|J|MS2 (J = −0.12 cm−1), increases this energy by 2.7 cm−1 and affords a reasonable fit of the data (Fig. 3 and Table S7†).
Er2Ga45
The χT value at room temperature (22.7 cm3 mol−1 K) corresponds to two isolated ErIII ions (ErIII: 4I15/2, C = 11.5 cm3 K mol−1) (Fig. S3†). Upon cooling, χT slightly decreases and reaches a value of 12.9 cm3 K mol−1 at 2 K, as expected for anisotropic ions. The M = f(μ0H) curve increases sharply between 0 and 1 T and then continuously up to 7 T without reaching saturation (Fig. S3†).No inflection point is present at low magnetic field, which excludes the presence of an antiferromagnetic coupling as for the other compounds. For the ground state, the ab initio calculations give three different g values: g1 = 9.94, g2 = 5.25 and g3 = 0.25 (Table S8†). The magnetization is planar, with two non-equivalent directions. The largest magnetization direction (along g1) is found in a direction forming an angle of 32° with the intermetallic axis and lies almost in the Er2O2 plane (Fig. 4, right).
The magnetization curve, computed from ab initio calculations, does not fit the experimental one. A scaling factor of 1.8 increases the energy of the first excited state and reduces the effect of second order Zeeman interaction (see ESI† for the details of the calculations) and improves the agreement of theoretical and experimental curves, in particular above 1 T. Since the planes of magnetization form a small angle with the intermetallic axis, the dipolar interaction is ferromagnetic. The behavior in the weak field region is reproduced by considering the presence of a supplementary ferromagnetic coupling between the two ions due to exchange (Jexch = +2.4 cm−1) (Table S9 and Fig. S3†). It is worth noting that when the ground state has a small MJ value and the excited states are close to the ground state as in the present case, a very small error in the energies and in the gi values may have a dramatic effect on the shape of the magnetization curve. This is why here, a scaling factor that changes the ground-excited state gap was necessary to better reproduce the magnetic data. In addition, if the ratio between g1 and g2 is different, the shape of the magnetization curve in the low field region is changed. For instance, if g1 is close to g2 (i.e. close to 10, which defines an anisotropic easy plane of magnetization), the experimental curve can be reproduced without considering an additional ferromagnetic exchange interaction between the two ErIII ions.
In summary, the magnetic studies together with theoretical calculations show that there is an easy axis of magnetization for the Dy and the Tb complexes with an intra-molecular dipolar antiferromagnetic interaction, while for Er there is an easy plane of magnetization that leads to a ferromagnetic dipolar interaction between the two ions. Furthermore, an additional interaction due to exchange between the metal ions is necessary to reproduce the experimental data that was found to be antiferromagnetic for the Dy and the Tb complexes and ferromagnetic (or absent) for the Er one. The analysis of the g values of the ground doublets allow us to extract the spin and the orbital contributions to the overall magnetization (Table S10†).
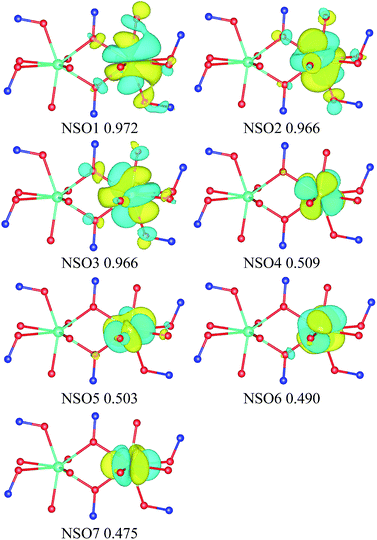
In order to get a qualitative insight into the nature (F or AF) of the exchange interaction between the metal ions and particularly the difference between the Gd, Tb and Dy complexes on one hand and the Er complex on the other hand, we determined the Natural Spin Orbitals (NSOs) for the magnetic axes on one lanthanide site (Fig. 5, S4 and S5, see ESI†). These orbitals permit the determination of the spin magnetization (‘spin density’) for a given direction of the magnetic field. The comparison of the overlap integrals between NSOs on different centers within the binuclear complexes for the Dy and the Er cases show that they are about ten times larger for Dy2Ga4 then for Er2Ga4 (Tables S11, S12 and S13†). Since the overlap integrals between NSOs are directly related to the magnitude of the antiferromagnetic contribution to the exchange interaction,42 one can conclude that such interaction is expected to be much larger for the Dy2Ga4 than for Er2Ga4 as found experimentally. The origin of the difference in behavior between the two complexes may be related to the weaker magnetization density on the bridging oxime ligands for ErIII than for DyIII (Fig. 5, S4 and S5†). It is difficult to draw more quantitative conclusions from this qualitative analysis on the ferromagnetic exchange contribution.
Low temperature micro-squid studies
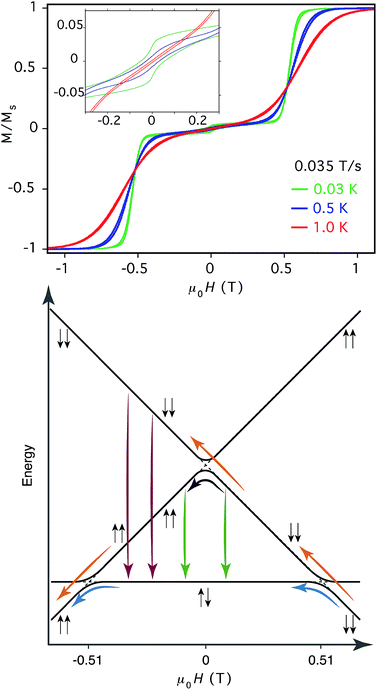
For compound 3, at μ0H = 1 T and T = 0.03 K, the magnetic moment is saturated. Upon decreasing the field with a sweep rate of 0.035 T s−1, the magnetization undergoes a sharp decrease to around 5% of saturation (Fig. 6, top). The M = f(μ0H) curves at different temperatures cross at 0.51 T. An opening of the hysteresis was observed at zero field with a coercive field μ0HC = 540 Oe. Upon decreasing the magnetic field sweep rate from 0.28 to 0.008 T s−1, the coercive field decreases from 678 to 421 Oe indicating the occurrence of quantum tunneling of the magnetization because the width of the hysteresis loop depends on the field sweep rate (Fig. S6†). The sharp step at 0.51 T is the result of crossover from the F to the AF states as explained in the previous section.An opening of the hysteresis loop, at such low temperature where only ground state is populated, has never been observed, to the best of our knowledge, in an antiferromagnetically coupled binuclear Dy2 complex. Since no hysteresis loop can occur when all the molecules are in the antiferromagnetic state (diamagnetic state) and since the excited ferromagnetic one cannot be populated at T = 0.03 K, the presence of the residual 5% magnetization below the step at 0.51 T can be due to the presence of residual molecules in the ferromagnetic state. Actually, at large positive magnetic field, the moments are in the |− −> configuration of the ferromagnetic state. Upon decreasing the field at a given sweep rate, the majority of the molecules undergo a crossover from the ferro- |− −> to the antiferromagnetic (|+ −>; |− +>) state, but a small amount remains in the ferro- |− −> configuration (see Fig. 6, bottom). In order to support the above-proposed mechanism, we first cooled down the sample at zero applied magnetic field. This leads to a state where all Dy-dimers are in the antiferromagnetic ground state. Then, we performed minor hysteresis loops below the critical field for the ferromagnetic state (0.5 T). A typical example is presented in Fig. S6† performed in the ±3000 Oe region. A paramagnetic signal with a small hysteresis is observed, which is probably due to a mononuclear Dy(III) species (2%) that are present in the crystals. Only when the field is larger than the critical field for the ferromagnetic state, a large hysteresis is observed, which is due to molecules that are trapped in the ferromagnetic state.
This results in a residual magnetization below 0.51 T. When the field is driven to zero, a tiny drop in the magnetization is observed (Fig. S7†) that can be assigned to the reversal of the magnetization from the |− −> to the |+ −> (|− +>) configurations by a direct tunneling process (Fig. 6, bottom). The tunneling probability at zero field from |− −> to |+ +> is rather weak but a clear step that is sweep rate dependent can be noticed. Upon decreasing the field to negative values, the reversal of the magnetization occurs probably via a direct transition from the |− −> to the |+ −> (|− +>) configuration. And finally at μ0H = −0.51 T the majority of the molecules that were in the antiferromagnetic |+ −> (|− +>) state undergo the crossover to the |+ +> ferromagnetic one.
Dynamic susceptibility studies
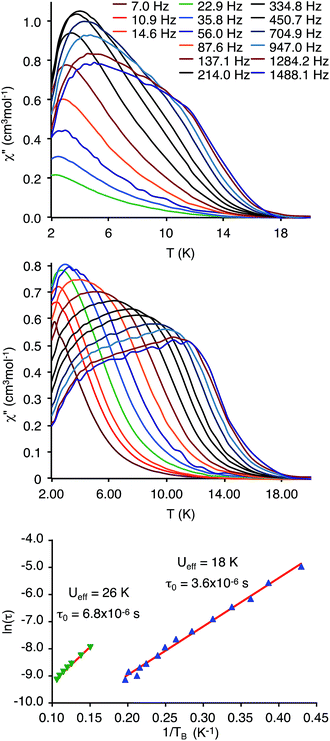
Ac susceptibility measurements may bring complementary information on the dynamics of the magnetization reversal at higher temperatures. A frequency dependence of the out-of-phase component of the susceptibility was observed only for the Dy2 derivative 3 and the Dy diluted one 6, with all other compounds showing no out-of-phase behavior. For compound 3, ac susceptibility measurements were first performed under zero dc applied external field, in the temperature range between 2 and 22 K and frequency range from 1 to 1488 Hz with an ac drive field of 3 Oe (Fig. 7 (top), S8 and S9†).The temperature dependent out-of-phase susceptibility plot (Fig. 7, top) show that upon increasing the frequency of the oscillating field, the temperature of the maxima (TBf) shifts toward high temperatures as expected, while the value of the maxima of the χ′′ signals does not behave as usual. When the frequency increases, it first reaches a maximum intensity at 450 Hz (TB450 = 4.00 K) and then decreases. This behavior is consistent with the fact that the slow relaxation probed corresponds to an excited state that is more and more populated when the temperature of the maximum is shifted upward and is evidence that the relaxation process observed is due to the excited ferromagnetic state that lies at 4.9 cm−1 above the ground non-magnetic one. Assuming an activated relaxation process (τ = τ0![[thin space (1/6-em)]](https://www.rsc.org/images/entities/char_2009.gif) exp(Ueff/kBTB)) in the 2–5 K region, it is possible to fit ln
exp(Ueff/kBTB)) in the 2–5 K region, it is possible to fit ln![[thin space (1/6-em)]](https://www.rsc.org/images/entities/char_2009.gif) τ vs. 1/TB from the out-of phase data, where τ = 1/(2πf) and TB is the temperature of the χ′′ = f(T) curves, and find τ0 = 3.6 × 10⁻⁶ s and Ueff = 18 K (Fig. 7, bottom). The χ′′ = f(T) curves display shoulders at higher temperatures in the 10–14 K region that appear only for frequencies above 500 Hz. In the 10–14 K region, the temperature is larger than the energy due to antiferromagnetic coupling, the coupling can then be neglected and the ions behave as if they were isolated. This second relaxation process can then be assigned to the isolated DyIII ions. The analysis of the data leads to a thermal activated behavior relaxation process with τ0 = 6.8 × 10⁻⁶ s and Ueff = 26 K (Fig. 7, bottom).
τ vs. 1/TB from the out-of phase data, where τ = 1/(2πf) and TB is the temperature of the χ′′ = f(T) curves, and find τ0 = 3.6 × 10⁻⁶ s and Ueff = 18 K (Fig. 7, bottom). The χ′′ = f(T) curves display shoulders at higher temperatures in the 10–14 K region that appear only for frequencies above 500 Hz. In the 10–14 K region, the temperature is larger than the energy due to antiferromagnetic coupling, the coupling can then be neglected and the ions behave as if they were isolated. This second relaxation process can then be assigned to the isolated DyIII ions. The analysis of the data leads to a thermal activated behavior relaxation process with τ0 = 6.8 × 10⁻⁶ s and Ueff = 26 K (Fig. 7, bottom).
The χ′′ = f(ν) curves for different temperatures (Fig. S8†) show only one maximum that shifts to high frequency upon heating. The intensity of the curves follow the behavior observed in Fig. 7i.e. the magnitude of χ′′ increases from 2 to 4.25 K and then decreases, attesting that the relaxation process is due to the excited ferromagnetic state.
The Cole–Cole plots for compound 3 at zero applied dc field were obtained for temperatures between 2 and 11 K (Fig. S10†). The plots have close to an ideal semicircular shape indicating that only a few relaxation processes are present. The semicircles were fitted using a generalized Debye model.43 The fits provided values for the α parameter, which decreased with increasing temperature, from 0.18 at 2 K to 0.032 at 11 K (Fig. S10†). The low α value at high temperatures indicates that only one relaxation process is present. As the temperature is decreased, the α parameter increases because at low temperatures, the tunneling process starts to compete with the activated direct process.
The ac data for compound 3 were also recorded in the presence of an applied 2000 Oe dc field. The same general behavior with two relaxation processes, as for the zero dc field case, is observed, but with some differences in the relative intensities. (Fig. 7 (middle) and S11†). Upon increasing the frequency, the intensity of χ′′ increases and reaches a maximum at 36 Hz (TB36 = 3.0 K), instead of 450 Hz under zero dc field. The high temperature process starts to be observable at 88 Hz instead of 450 Hz when a dc field of 2000 Oe is applied, which is compatible with a process due to the uncoupled DyIII ions.
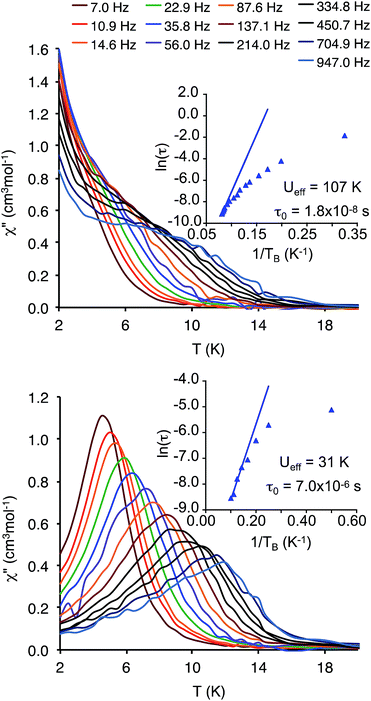
The temperature-dependent out-of-phase ac susceptibility for 6 under zero dc applied field (Fig. 8 top and S12†) revealed a frequency dependent maxima in the 5–15 K temperature range with a tail at low temperature due to quantum tunneling of the magnetization, as is generally observed for DyIII ions.44 This last process can also be observed in the low temperature regime in the frequency-dependent data (Fig. S13†), where the maxima positions are relatively temperature independent. The barrier extracted from the frequency-dependent data for 6 at zero applied dc field is Ueff = 31 K, with a τ0 of 7.0 × 10⁻⁶ s (Fig. 8 top), very close to the high temperature process of the binuclear compound 3 (Ueff = 26 K and τ0 = 76.8 × 10⁻⁶ s), which confirms that the high temperature process in 3 is indeed due to the uncoupled moments. At lower temperature, the relaxation tends to be temperature independent (Fig. 8, top), as expected when the quantum tunneling process dominates.
Applying a dc magnetic field may slow down the tunneling and make other processes more visible. In the presence of an optimal 750 Oe dc field (see ESI, Fig. S14†), the maxima in the χ′′ = f(T) plot for 6 can be observed (Fig. 8, bottom). Quantum tunneling of the magnetization has been mostly quenched as evidenced by the absence of overlapping peaks in the frequency-dependent data (Fig. S15†) and the disappearance of the low temperature tail in the temperature dependent data (Fig. 8).
A linear fit of the high temperature data gives an energy barrier Ueff = 107 K, with τ0 = 1.79 × 10⁻⁸ s (Fig. 8, bottom). As expected, the barrier is much higher than for the zero-field case of 31 K. It is about half the value of the computed energy difference between the ground and the first excited states (153 cm−1 (220 K)) (Table S4†), which is consistent with the persistence of a relaxation by quantum tunneling via the ground state and via the first excited one. The persistence of quantum tunneling is due to the lack of a perfect axial g-tensor (g1 = 19.47, g2 = 0.08 and g3 = 0.04) and thus to a small mixing between the ground and the excited MJ states.
The comparison of the χ′′ curves at 1284 Hz measured at zero and 2000 Oe for 3 and at 750 Oe for 6 (Fig. 9) shows that the maximum of χ′′ = f(T) for 3 and 6 are at the same temperature, which confirms that the high temperature process in 3 is actually due to the isolated DyIII ions.
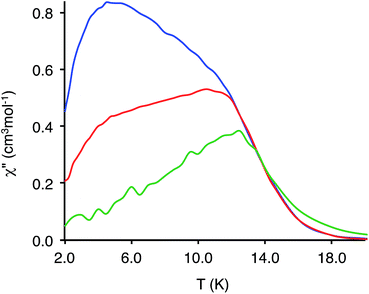 | ||
Fig. 9 Temperature-dependence of the out-of-phase (χ′′) ac susceptibility for 3 in zero dc field ( ), in 2000 Oe dc field ( ), in 2000 Oe dc field ( ) and for 6 in 750 Oe dc field ( ) and for 6 in 750 Oe dc field ( ) at 1284 Hz. ) at 1284 Hz. | ||
In order to check that the relaxation processes are well related to the mononuclear DyY species and not to the presence of large amounts of the Dy2 ones within the crystal, we carried magnetization studies on a single crystal of compound 6 using the micro-squid arrays. The M = f(μ0H) curves in the ±1 T range at different temperatures and sweep rates (Fig. S16 and S17†) of the field are all consistent with a mononuclear Dy(III) ion with a tunneling of the magnetization near zero field and a slower relaxation when a magnetic field is applied, completely consistent with the ac data. A small step is observed close to 0.5 T due to the Dy2 species present in compound 6. The corresponding magnetization is around 6%, which is less than the value expected from statistical distribution (11%), which render the magnetic behavior of compound 6 mainly due to the mononuclear species.
Concluding remarks
Utilizing the metallacrown synthetic approach, we investigated the properties of a family of isostructural Ln2Ga4 complexes, where the LnIII ions are bridged by oxygen atoms forming the diamond-like Ln2O2 core. The experimentally observed antiferromagnetic coupling for the Gd, Tb and Dy containing complexes was shown, using ab initio calculations, to be due to exchange and not to dipolar interaction. For the Er-based complex, no experimental evidence of antiferromagnetic coupling was observed. The analysis of the overlap and the exchange integrals between the NSOs shows that the exchange coupling is about ten times larger for Dy than for Er. The magnetization changes from an easy axis to an easy plane between the Dy and the Er complexes but there is no evidence that this is related to the nature of the exchange interaction.The presence of an easy axis of magnetization for the DyIII within the binuclear species leads to a slow relaxation of the magnetization for Dy2, despite the presence of the antiferromagnetic coupling. Two relaxation processes are observed and assigned to the ferromagnetic excited state and to the uncoupled ions. The uncoupled ions have a slightly larger barrier suggesting that the ferromagnetic coupling between the Ising moments speeds up the relaxation process. The nature of the high temperature process was confirmed by the study of the diluted mononuclear species.
Acknowledgements
This research was supported in part by the National Science Foundation under grant CHE-1361779 and by ANR-13-BS10-0001-03 MolQuSpin. VLP and TM acknowledge the Blaise Pascal International Chair for financial support. F.G. and J.A. acknowledge support Department of Energy, Office of Basic Energy Sciences, Heavy Element Chemistry (DE-FG02-09ER16066). The SQUID facility at the University of Michigan is funded by the National Science Foundation, NSF-MRI grant CHE-1040008.Notes and references
- R. Sessoli, H. Tsai, A. R. Schake, S. Wang, J. B. Vincent, K. Folting, D. Gatteschi, G. Christou and D. N. Hendrickson, J. Am. Chem. Soc., 1993, 115, 1804 CrossRef CAS.
- L. Bogani and W. Wernsdorfer, Nat. Mater., 2008, 7, 179 CrossRef CAS PubMed.
- R. E. P. Winpenny, Angew. Chem., Int. Ed., 2008, 47, 7992 CrossRef CAS PubMed.
- C. M. Zaleski, E. C. Depperman, C. Dendrinou-Samara, M. Alexiou, J. W. Kampf, D. P. Kessissoglou, M. L. Kirk and V. L. Pecoraro, J. Am. Chem. Soc., 2005, 127, 12862 CrossRef CAS PubMed.
- A. M. Ako, I. J. Hewitt, V. Mereacre, R. Clérac, W. Wernsdorfer, C. E. Anson and A. K. Powell, Angew. Chem., Int. Ed., 2006, 45, 4926 CrossRef CAS PubMed; G. Christou, D. Gatteschi, D. N. Hendrickson and R. Sessoli, MRS Bull., 2000, 25, 66 CrossRef; A. L. Barra, A. Caneschi, A. Cornia, F. Fabrizi de Biani, D. Gatteschi, C. Sangregorio, R. Sessoli and L. Sorace, J. Am. Chem. Soc., 1999, 121, 5302 CrossRef.
- C. M. Zaleski, S. Tricard, E. C. Depperman, W. Wernsdorfer, T. Mallah, M. L. Kirk and V. L. Pecoraro, Inorg. Chem., 2011, 50, 11348 CrossRef CAS PubMed.
- D. N. Woodruff, R. E. P. Winpenny and R. A. Layfield, Chem. Rev., 2013, 113, 5110 CrossRef CAS PubMed.
- N. Ishikawa, M. Sugita, T. Ishikawa, S. Koshihara and Y. Kaizu, J. Am. Chem. Soc., 2003, 125, 8694 CrossRef CAS PubMed; V. E. Campbell, R. Guillot, E. Riviere, P.-T. Brun, W. Wernsdorfer and T. Mallah, Inorg. Chem., 2013, 52, 5194 CrossRef PubMed; D.-P. Li, T.-W. Wang, C.-H. Li, D.-S. Liu, Y.-Z. Li and X.-Z. You, Chem. Commun., 2010, 46, 2929 RSC; A. Yamashita, A. Watanabe, S. Akine, T. Nabeshima, M. Nakano, T. Yamamura and T. Kajiwara, Angew. Chem., Int. Ed., 2011, 50, 4016 CrossRef PubMed; A. Watanabe, A. Yamashita, M. Nakano, T. Yamamura and T. Kajiwara, Chem.–Eur. J., 2011, 17, 7428 CrossRef PubMed; N. Zhou, Y. Ma, C. Wang, G. Feng Xu, J.-K. Tang, J.-X. Xu, S.-P. Yan, P. Cheng, L.-C. Li and D.-Z. Liao, Dalton Trans., 2009, 8489 RSC; M. A. AlDamen, J. M. Clemente-Juan, E. Coronado, C. Martí-Gastaldo and A. Gaita-Ariño, J. Am. Chem. Soc., 2008, 130, 8874 CrossRef PubMed.
- L. F. Chibotaru, L. Ungur and A. Soncini, Angew. Chem., Int. Ed., 2008, 47, 4126 CrossRef CAS PubMed.
- R. Boča, Coord. Chem. Rev., 2004, 248, 757 CrossRef PubMed.
- R. J. U. Blagg, L. Ungur, F. Tuna, J. Speak, P. Comar, D. Collison, W. Wernsdorfer, E. J. L. McInnes, L. F. Chibotaru and R. E. P. Winpenny, Nat. Chem., 2013, 5, 673 CrossRef CAS PubMed.
- W. Wernsdorfer, N. Aliaga-Alcalde, D. N. Hendrickson and G. Christou, Nature, 2002, 416, 406 CrossRef PubMed.
- J. D. Rinehart, M. Fang, W. J. Evans and J. R. Long, J. Am. Chem. Soc., 2011, 133, 14236 CrossRef CAS PubMed.
- R. J. Blagg, C. A. Muryn, E. J. L. McInnes, F. Tuna and R. E. P. Winpenny, Angew. Chem., Int. Ed., 2011, 50, 6530 CrossRef CAS PubMed; Y.-N. Guo, G.-F. Xu, P. Gamez, L. Zhao, S.-Y. Lin, R. Deng, J. Tang and H.-J. Zhang, J. Am. Chem. Soc., 2010, 132, 8538 CrossRef PubMed.
- P.-H. Lin, T. J. Burchell, L. Ungur, L. F. Chibotaru, W. Wernsdorfer and M. Murugesu, Angew. Chem., Int. Ed., 2009, 48, 9489 CrossRef CAS PubMed.
- F. Habib and M. Murugesu, Chem. Soc. Rev., 2013, 42, 3278 RSC; F. Tuna, C. A. Smith, M. Bodensteiner, L. Ungur, L. F. Chibotaru, E. J. L. McInnes, R. E. P. Winpenny, D. Collison and R. A. Layfield, Angew. Chem., Int. Ed., 2012, 51, 6976 CrossRef CAS PubMed; M. Nematirad, W. J. Gee, S. K. Langley, N. F. Chilton, B. Moubaraki, K. S. Murray and S. R. Batten, Dalton Trans., 2012, 13711 RSC; K. Katoh, Y. Horii, N. Yasuda, W. Wernsdorfer, K. Toriumi, B. K. Breedlove and M. Yamashita, Dalton Trans., 2012, 13582 RSC.
- S. A. Sulway, R. A. Layfield, F. Tuna, W. Wernsdorfer and R. E. P. Winpenny, Chem. Commun., 2012, 48, 1508 RSC.
- G. Mezei, C. M. Zaleski and V. L. Pecoraro, Chem. Rev., 2007, 107, 4933 CrossRef CAS PubMed.
- C. M. Zaleski, E. C. Depperman, J. W. Kampf, M. L. Kirk and V. L. Pecoraro, Angew. Chem., Int. Ed., 2004, 43, 3912 CrossRef CAS PubMed; C. M. Zaleski, E. C. Depperman, J. W. Kampf, M. L. Kirk and V. L. Pecoraro, Inorg. Chem., 2006, 45, 10022 CrossRef PubMed; A. Deb, T. T. Boron, M. Itou, Y. Sakurai, T. Mallah, V. L. Pecoraro and J. E. Penner-Hahn, J. Am. Chem. Soc., 2014, 136, 4889 CrossRef PubMed.
- C. M. Zaleski, J. W. Kampf, T. Mallah, M. L. Kirk and V. L. Pecoraro, Inorg. Chem., 2007, 46, 1954 CrossRef CAS PubMed.
- I. T. T. Boron, J. W. Kampf and V. L. Pecoraro, Inorg. Chem., 2010, 49, 9104 CrossRef PubMed.
- (a) J. Tang, I. Hewitt, N. T. Madhu, G. Chastanet, W. Wernsdorfer, C. E. Anson, C. Benelli, R. Sessoli and A. K. Powell, Angew. Chem., Int. Ed., 2006, 45, 1729 CrossRef CAS PubMed; (b) X. H. Yi, K. Bernot, F. Pointillart, G. Poneti, G. Calvez, C. Daiguebonne, O. Guillou and R. Sessoli, Chem. Eur. J., 2012, 18, 11379 CrossRef CAS PubMed; (c) F. Pointillart, B. Le Guennic, O. Maury, S. Golhen, O. Cador and L. Ouahab, Inorg. Chem., 2013, 52, 1398 CrossRef CAS PubMed.
- Bruker Analytical X-ray, Madison, WI, 2008.
- G. M. Sheldrick, Program for Empirical Absorbtion Correction of Area Detector Data, Gottingen, Germany, 2008 Search PubMed.
- R. Corporation, Tokyo, Japan.
- G. M. Sheldrick, Acta Crystallogr., Sect. A: Found. Crystallogr., 2008, 64, 112 CrossRef CAS PubMed.
- W. Wernsdorfer, Supercond. Sci. Technol., 2009, 22, 064013 CrossRef.
- W. Wernsdorfer, N. E. Chakov and G. Christou, Phys. Rev. B: Condens. Matter Mater. Phys., 2004, 70, 132413 CrossRef.
- B. O. Roos, R. Lindh, P.-Å. Malmqvist, V. Veryazov, P.-O. Widmark and A. C. Borin, J. Phys. Chem. A, 2008, 112, 11431 CrossRef CAS PubMed; B. O. Roos, R. Lindh, P.-Å. Malmqvist, V. Veryazov and P.-O. Widmark, J. Phys. Chem. A, 2003, 108, 2851 CrossRef PubMed.
- F. Aquilante, L. De Vico, N. Ferré, G. Ghigo, P.-Å. Malmqvist, P. Neogrády, T. B. Pedersen, M. Pitoňák, M. Reiher, B. O. Roos, L. Serrano-Andrés, M. Urban, V. Veryazov and R. Lindh, J. Comput. Chem., 2010, 31, 224 CrossRef CAS PubMed.
- B. O. Roos, P. R. Taylor and P. E. M. Siegbahn, Chem. Phys., 1980, 48, 157 CrossRef CAS.
- P.-Å. Malmqvist, B. O. Roos and B. Schimmelpfennig, Chem. Phys. Lett., 2002, 357, 230 CrossRef CAS.
- B. A. Heß, C. M. Marian, U. Wahlgren and O. Gropen, Chem. Phys. Lett., 1996, 251, 365 CrossRef.
- H. Bolvin, ChemPhysChem, 2006, 7, 1575 Search PubMed.
- M. E. Lines, J. Chem. Phys., 1971, 55, 2977 CrossRef CAS PubMed.
- M. L. Kahn, R. Ballou, P. Porcher, O. Kahn and J.-P. Sutter, Chem.–Eur. J., 2002, 8, 525 Search PubMed.
- S. Petit, G. Pilet, D. Luneau, L. F. Chibotaru and L. Ungur, Dalton Trans., 2007, 4582 RSC.
- F. Gendron, D. Páez-Hernández, F.-P. Notter, B. Pritchard, H. Bolvin and J. Autschbach, Chem.–Eur. J., 2014, 20, 7994 CrossRef CAS PubMed.
- J. Jankolovits, C. M. Andolina, J. W. Kampf, K. N. Raymond and V. L. Pecoraro, Angew. Chem., Int. Ed., 2011, 50, 9660 Search PubMed; S. H. Seda, J. Janczak and J. Lisowski, Inorg. Chem. Commun., 2006, 9, 792 Search PubMed.
- J. r. m. Long, F. Habib, P.-H. Lin, I. Korobkov, G. Enright, L. Ungur, W. Wernsdorfer, L. F. Chibotaru and M. Murugesu, J. Am. Chem. Soc., 2011, 133, 5319 CrossRef CAS PubMed.
- L. E. Roy and T. Hughbanks, J. Am. Chem. Soc., 2006, 128, 568 CrossRef CAS PubMed.
- P. W. Anderson, in Magnetism, ed. G. T. R. Suhl, Academic Press, 1963, p. 25 CrossRef CAS PubMed; J.-J. Girerd, M.-F. Charlot and O. Kahn, Mol. Phys., 1977, 34, 1063 CrossRef CAS PubMed; O. Kahn, Molecular Magnetism, VCH Publishers, Inc., New York, 1993 Search PubMed.
- N. Bontemps, J. Rajchenbach, R. V. Chamberlin and R. Orbach, Phys. Rev. B: Condens. Matter Mater. Phys., 1984, 30, 6514 CrossRef CAS; D. Huser, A. J. v. Duyneveldt, G. J. Nieuwenhuys and J. A. Mydosh, J. Phys. C: Solid State Phys., 1986, 19, 3697 CrossRef.
- J. J. Le Roy, M. Jeletic, S. I. Gorelsky, I. Korobkov, L. Ungur, L. F. Chibotaru and M. Murugesu, J. Am. Chem. Soc., 2013, 135, 3502 CrossRef CAS PubMed.
Footnotes |
| † Electronic supplementary information (ESI) available: Additional magnetic data, additional figures and computational details. CCDC 1020818–1020822. For ESI and crystallographic data in CIF or other electronic format see DOI: 10.1039/c5sc01029b |
| ‡ The successive deprotonation of salicylhydroxamic acid is as follows: H3shi (fully protonated), H2shi− (deprotonation of the hydroximate oxygen), Hshi2− (deprotonation of the hydroximate and phenol oxygens) and shi3− (fully deprotonated). |
| § Theoretical calculations estimate that single ion anisotropy lifts the degeneracy of the local S = 7/2 manifold by 2 cm−1 (Table S2†). The evaluation of the dipolar interaction from ab initio calculations leads to an energy separation between the ground and the highest excited state of about 0.4 cm−1, which is about 10% of the overall separation. |
| ¶ The principal values of the g tensor for all compounds are labeled by 1, 2 and 3 with 1 being the largest and 3 the smallest value; the molecular axes x, y and z; the z axis corresponds to the Ln–Ln intermolecular axis and the x axis lies within the LnOOLn plane, where O are the bridging oxygen atoms. |
| This journal is © The Royal Society of Chemistry 2015 |


