 Open Access Article
A polyion complex sensor array for markerless and noninvasive identification of differentiated mesenchymal stem cells from human adipose tissue†
Shunsuke
Tomita
 *a,
Miho
Sakao
b,
Ryoji
Kurita
a,
Osamu
Niwa
a and
Keitaro
Yoshimoto
*bc
aBiomedical Research Institute, National Institute of Advanced Industrial Science and Technology, 1-1-1 Higashi, Tsukuba, Ibaraki 305-8566, Japan. E-mail: s.tomita@aist.go.jp
bCollege of Arts and Sciences, The University of Tokyo, 3-8-1 Komaba, Meguro, Tokyo 153-8902, Japan. E-mail: ckeitaro@mail.ecc.u-tokyo.ac.jp
cDepartment of Life Sciences, Graduate School of Arts and Sciences, The University of Tokyo, 3-8-1 Komaba, Meguro, Tokyo 153-8902, Japan
First published on 30th June 2015
Abstract
Currently available methods for stem cell evaluation require both prior knowledge of specific markers and invasive cell lysis or staining, hampering the development of stem cell products with assured safety and quality. Here, we present a strategy using optical cross-reactive sensor arrays for markerless and noninvasive identification of differentiated stem cell lineages with common laboratory equipment. The sensor array consists of a library of polyion complexes (PICs) between anionic enzymes and synthetic poly(ethylene glycol)-modified polyamines, which can recognize “secretomic signatures” in cell culture supernatants. Due to the reversible nature of PIC formation, the incubation of diluted culture supernatants with PICs caused enzyme release through competitive interactions between the secreted molecules and the PICs, generating unique patterns of recovery in enzyme activity for individual cell types or lineages. Linear discriminant analysis of the patterns allowed not only normal/cancer cell discrimination but also lineage identification of osteogenic and adipogenic differentiation of human mesenchymal stem cells, therefore providing an effective way to characterize cultured cells in the fields of regenerative medicine, tissue engineering and cell biology.
Introduction
There have been many recent attempts to exploit human stem cells in regenerative medicine, drug discovery, and disease modeling.1 Every step in the process of stem cell product development must be continuously evaluated for potential safety and quality concerns, from the origin of the cells used, through expansion, manipulation, and in some cases preclinical evaluation of the cells, to their eventual engraftment in the host.2For the evaluation of cultured stem cells, genetic and phenotypic analyses based on detecting markers for the specific cell state of interest are currently available, such as histochemistry, quantitative polymerase chain reaction assay (qPCR), and flow cytometry, used singly or in combination.3 However, these methods require (i) prior knowledge of pairs of specific markers and the corresponding antibodies, which are not identified in many situations, and (ii) invasive cell lysis or staining, hampering continuous evaluation of the cells during the manufacturing process. It will therefore be critical for progress in stem cell research and application to develop a general solution for constructing systems that can identify cell states by a noninvasive and simple assay at a desired timing without any information about the markers.
Optical cross-reactive sensor array technology has been employed as an alternative to analytical methods using specific binding pairs, such as antibody/antigen.4 This approach is based on the pattern recognition of unique optical responses, i.e. sample signatures, for individual analytes obtained through cross-reactive, rather than specific, interactions between a library of cross-reactive receptors and analytes. Examples of their use for biological molecules include sensor arrays that can discriminate phosphates,5 saccharides,6 peptides,7 and proteins.8 We have also recently developed sensor arrays consisting of cross-reactive polyion complexes (PICs) for the discrimination of human plasma proteins9 and structurally similar homologous albumins.10 To date, optical cross-reactive sensor arrays have been applied to markerless but invasive discrimination of normal/cancer cells6c,11 and stimulated cell lines8d by recognition of cell surfaces,11a–c,e lysates8d,11d and membrane extracts,6c while noninvasive stem cell identification has yet to be demonstrated.
Various molecules are secreted into the external medium from cultured cells. The entire set of secreted proteins is referred to as “the secretome”, which reflects the functionality and state of a cell in a given environment and at a given time,12 and is regarded as a rich source for the discovery of cancer biomarkers in the biomedical field.13 Secretome analyses have recently been used in the study of mesenchymal stem cells (MSCs) to identify the autocrine/paracrine factors applicable in regenerative medicine.14 MSCs are natural multipotent cells present in bone marrow, adipose, placental, and umbilical tissues, and have important roles in immunomodulation and tissue regeneration. Secretome analysis of MSCs using mass spectrometry and gel electrophoresis enabled the detection of 100–300 proteins or more in the culture supernatants of cells,15 and the components of secreted proteins were modulated by a variety of stimuli,14b including differentiation induction.15,16
Inspired by recent progress in both optical cross-reactive sensor arrays and secretome analysis, we have applied a PIC sensor array to recognize the “secretomic signatures” of culture supernatants for markerless and noninvasive identification of differentiated MSCs using only a standard microplate reader.
Results and discussion
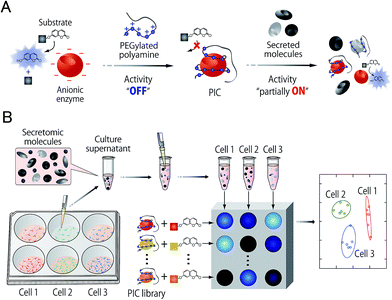
In this study, an optical sensor array-based system was proposed, as shown in Fig. 1. A library of PICs between anionic enzymes and poly(ethylene glycol)-modified (PEGylated) polyamines was used as a source of cross-reactive receptors with the ability to translate the interactions between secreted molecules and PICs into a readable signal. The sensing strategy was based on our recent findings,17 where reversible electrostatic-driven PIC formation between enzymes and PEGylated polyamines was accompanied by decreases in enzyme activity (Fig. 1A). PICs may possess different affinities for secreted molecules in culture supernatants, and therefore incubation of the culture supernatants with PICs would cause enzyme release through competitive interactions (Fig. 1A). Consequently, unique patterns of recovery in enzyme activity for individual cell types or lineages would be generated. A PIC-based library is suited for tuning cross-reactivity to recognize signatures of complex biofluids, as reversible enzyme inhibition generally occurs through PIC formation with counter-charged polymers.17 Enzyme activity is determined from the rate of increase in the concentration of fluorogenic 4-methylumbelliferone, which is catalytically cleaved from the substrates (see Fig. S1†). Therefore, background intensity from biofluids can be neglected. For sample preparation, the total protein concentration of the collected culture supernatants was first determined by the Bradford assay. The supernatants were then diluted for normalization, so that it was possible to recognize the unique secretomic signatures of each cell type or lineage regardless of the density of the cultured cells (Fig. 1B).To achieve recognition of the secretomic signatures, we considered that potential candidate PICs possessing a variety of cross-reactivities toward secretomic molecules were required, and therefore we combined our previous strategies for the construction of PICs—using the naturally occurring structural diversity of enzymes9 and the artificial structural diversity of PEGylated polyamines10— in the preparation of six PICs between three anionic enzymes (GAO, GEC, and LAN; Fig. 2A) and two synthesized structurally different PEGylated polyamines based on quaternized poly(ethylene glycol)-block-poly(N,N-dimethylaminoethyl methacrylate) (PEG-b-QPAMA) (P1: hydrophilic and P2: hydrophobic and aromatic; Fig. 2B). As previously constructed PIC libraries discriminated proteins based predominantly on the electrostatic signatures of the proteins,9 LAN was selected for the PIC library to provide binding affinity toward hydrophobic molecules, which is expected from its peculiar capacity to adsorb on any hydrophobic interface.19 By the titration of PEGylated polyamines with enzymes (Fig. S1† and 3), a PIC library for the analysis of culture supernatants was newly prepared. Note that higher hydrophobicity of the R groups in the PEGylated polyamines had a greater effect on the decrease in activity of all the enzymes, but differences in the inhibitory effect between P1 and P2 differed depending on the enzymes, indicating that the use of both enzymes and PEGylated polyamines with different hydrophobicity is effective to increase the cross-reactivity in PIC libraries.
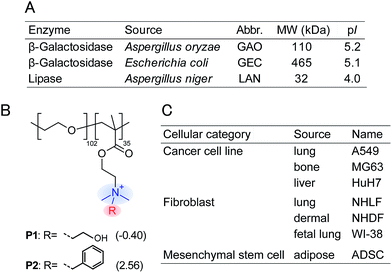 | ||
Fig. 2 Properties of (A) anionic enzymes, (B) PEGylated polyamines, and (C) human cells used in this study. log![[thin space (1/6-em)]](https://www.rsc.org/images/entities/char_2009.gif) P values of the R groups in the PEGylated polyamines are shown in parentheses, and these values were calculated by the program ALOPGs.18 P values of the R groups in the PEGylated polyamines are shown in parentheses, and these values were calculated by the program ALOPGs.18 | ||
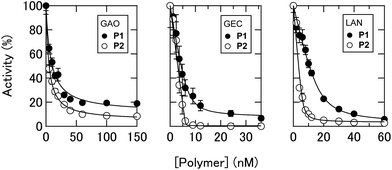 | ||
| Fig. 3 Changes in enzyme activities. Titration of PEGylated polyamines with 0.5 nM GAO, 0.2 nM GEC, and 10 nM LAN in 10 mM MOPS (pH 7.0) with 5% chemically defined serum-free CDCHO medium. | ||
As a proof-of-concept study, we first chose three different human cancer cell lines (Fig. 2C): A549 (lung), MG63 (bone), and HuH7 (liver). After a 16 hour incubation of each cell line seeded at 2.25 × 10⁴ cells per cm2 in DMEM supplemented with 10% fetal bovine serum, the medium was changed to a chemically defined serum-free CDCHO medium. The culture supernatants were collected after 48 hours of incubation. These supernatants contained the following concentrations of proteins: 13.0 ± 3.0 μg mL−1 for A549, 22.7 ± 1.5 μg mL−1 for MG63, and 24.8 ± 7.2 μg mL−1 for HuH7 (the values are the averages of six parallel measurements with ±1 S.D.). Diluted culture supernatants of 5.0 μg mL−1 proteins were then mixed with a PIC library in 10 mM MOPS (pH 7.0), providing increases in the enzyme activities (Fig. 4A, the raw data of all the PICs are shown in Table S1†). The enzyme activity patterns were found to be reproducible and were likely to be characteristic of each cell type.
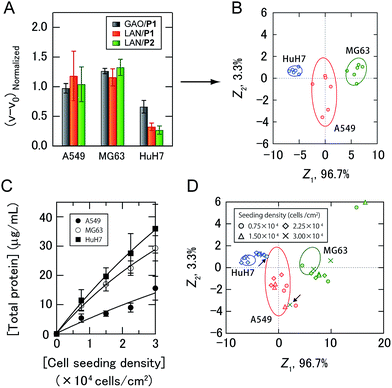 | ||
| Fig. 4 Sensing of human cancer cell lines. (A) Enzyme activity patterns for the culture supernatants from three cancer cell lines seeded at 2.25 × 10⁴ cells per cm2. Each normalized value represents the average of six parallel measurements with 1 S.D. (details are shown in Table S1†). (B) Discriminant score plot of the first two discriminant functions. The ellipses represent the confidence intervals (±1 S.D.) for the individual cancer cell lines. (C) Total protein concentrations of the culture supernatants with different seeding densities. The values are the averages of four parallel measurements with ±1 S.D. (D) The effects of cell seeding density on pattern generation. Discriminant scores of the enzyme activity patterns for the three kinds of cancer cell lines with various seeding densities were calculated using the first two discriminant functions obtained from the training data. The ellipses are the same as those shown in (B), and the arrows indicate the misclassified samples. | ||
The generated data points (6 PICs × 3 cancer cell lines × 6 replicates) were subjected to linear discriminant analysis (LDA), which is a routinely used chemometric method for dimensional reduction to construct a set of orthogonal dimensions for describing the data, providing information on classification ability and a graphical output, which is useful for gaining insight into the clustering of the response data.4a The classification accuracy was initially calculated with the Jackknife classification procedure20 to evaluate the discriminant capability of each PIC set as shown in Table S2† and investigate the mechanisms for sample discrimination. Accuracies of 56–89% using only one PIC were observed, whereas 100% accuracy was achieved using a combination of three PICs (GAO/P1, LAN/P1, and LAN/P2) (Table S2†). The first two discriminant scores, Z1 and Z2, were plotted to visualize how LDA clustered the patterns generated by the three PICs (Fig. 4B). The discriminant scores were calculated using the discriminant function Zk, which is a linear combination of the descriptor variables with the greatest discriminating ability:
| Zk = a1x1 + a2x2 + ⋯ + anxn + C |
As secreted molecules are partly responsible for intercellular communication,12,21 it can be assumed that the seeding density of the cells affects pattern generation. Therefore, we examined whether our strategy could be used to identify cancer cell lines even when they were seeded at different densities. The total protein concentrations of the culture supernatants of cancer cells seeded at densities of 0.75 to 3.00 × 10⁴ cells per cm2 were fitted by nonlinear least-squares, as the linear approximations were slightly deviated with increasing seeding density of the cells (Fig. 4C), suggesting the influence of intercellular communications on the secretome. Newly obtained test data for the diluted culture supernatants collected from three kinds of cancer cells with different seeding densities were classified based on the shortest Mahalanobis distances to the aforementioned training data of three groups seeded at 2.25 × 10⁴ cells per cm2. Of the 33 diluted culture supernatants, only two samples were incorrectly identified (MG63 at 3.00 × 10⁴ cells per cm2 and HuH7 at 0.75 × 10⁴ cells per cm2), affording an identification accuracy of 94% (Table S3†). To visualize the differences between the test and training data, the test data were transformed into discriminant scores according to the first two discriminant functions, and plotted on the same 2D space as in Fig. 4B (Fig. 4D). Interestingly, no systematic trend was found when changing the seeding density of the cancer cell lines. These results indicated that the ability of the PIC sensor array to discriminate cell types did not depend on the cell seeding density. Therefore, analysis using a PIC sensor array can be carried out at any arbitrary time even if the cells proliferate and change their density in a culture experiment. Taken together, our strategy allowed markerless and noninvasive classification of cancer cell lines with a broad range of densities in the culture by recognizing the unique secretomic signatures of the culture supernatants. In addition, by use of the standard curves shown in Fig. 4C, the cell densities at the time of seeding could be estimated (Table S3†).
Neoplastic cell transformation and contamination by cancerous cells are important issues in cell culture. Our strategy also addressed this issue; only two PICs successfully discriminated culture supernatants from lung-derived normal (NHLF and WI38) and cancerous cells (A549) with different seeding densities (see ESI Section 3†).
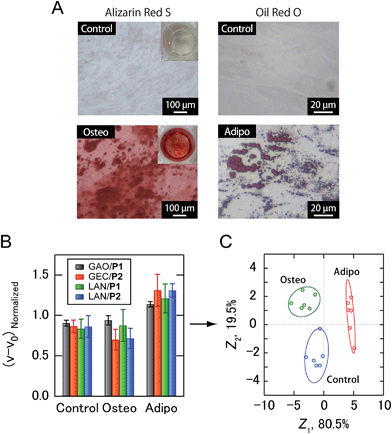
Building upon the noninvasive discrimination of normal/cancer cells using the PIC sensor array, we focused on the differentiation of human MSCs, which have recently attracted attention for regenerative medicine due to their availability and potentially beneficial characteristics, including the ability to differentiate into a variety of different cell types.22 At present, the guided differentiation of MSCs is limited because the mechanisms governing the transition from uncommitted MSCs to differentiated cells have yet to be characterized in sufficient detail.22a In addition, traditional invasive assays can evaluate cultured cells only once, making it difficult to continue further differentiation induction even if stem cells are not yet differentiated. Therefore, the efficacy and cost of developing MSC-based products would be improved if the differentiation of cells could be identified using culture supernatants. In this study, human adipose-derived stem cells (ADSCs) were selected as target MSCs. After osteogenic and adipogenic induction of ADSCs for 21 days (Fig. 5A), culture supernatants prepared in a CDCHO medium after 48 hours of incubation were collected. The culture supernatants of the ADSC-derived cells were diluted to a concentration of 5.0 μg mL−1 protein, and then analyzed (Fig. 5B). The combination of four PICs (GAO/P1, GEC/P2, LAN/P1, LAN/P2) showed 100% accuracy via Jackknife classification (Fig. 5C and Table S4†), and 83% accuracy was observed in a blind test (15 of 18) (Table S5†).
It should be noted that PIC libraries consisting of only one type of enzyme (e.g., GAO/P1 and GAO/P2) or only one type of PEG-b-QPAMA (e.g., GAO/P1, GEC/P1, and LAN/P1) were not capable of both discriminating the cancer cell lines (Table S2†) and identifying ADSC differentiation (Table S4†), suggesting the effectiveness of the combined use of the naturally occurring structural diversity of enzymes and the artificial structural diversity of PEGylated polyamines. In addition, LAN-containing PICs played a significant role in discriminating the secretomic signatures of the culture supernatants in both cases (Fig. 4 and 5). We have recently reported that electrostatic interaction was the main driving force for generating response patterns for plasma proteins when hydrophilic anionic enzymes were used to construct PIC libraries.9 To obtain more diverse response patterns, we have next used synthetic PEGylated polyamines with different hydrophobicities as PIC sources, enabling the discrimination of homologous albumins with very close resemblances in pI.10 Taking the importance of hydrophobicity into account, in this study, we added highly hydrophobic LAN to the PIC sources. Despite numerous secretome studies, very little has been reported on the differences in the abundance of secreted proteins and their physicochemical properties between cell types. However, LAN are expected to interact particularly well with hydrophobic secreted proteins in the culture supernatants, presumably resulting in the generation of unique responses that are different from those of GAO and GEC.
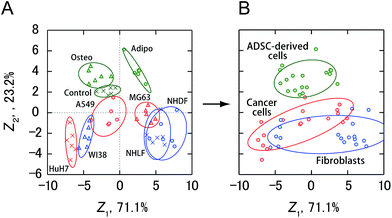
Finally, the activity patterns of all the cells were combined and analyzed to evaluate whether they were generally indicative of cellular categories. Meta-analysis of this study showed that cancer cells, fibroblasts, and ADSC-derived cells were clustered separately with some overlap between cancer cells and fibroblasts (Fig. 6 and S2†), indicating a potential correlation between the cellular categories and the activity patterns reflecting the secretomic molecules. Furthermore, ADSCs and fibroblasts were successfully discriminated with 100% accuracy using a combination of only two PICs (GAO/P1 and LAN/P2) (Fig. S4A and B†), while discrimination of these cells based on morphological properties is not trivial due to the spindle-shaped fibroblast-like morphology of ADSCs. We also identified cancer cells and ADSC-derived cells with an accuracy of 100% using LAN/P1 and LAN/P2 in combination (Fig. S4C and D†), which is an indication of the applicability of our system for identifying neoplastic transformation of stem cells.
Conclusions
We have applied a PIC sensor array for markerless and noninvasive discrimination of human cell types and lineage identification of differentiated stem cells. PIC sensor arrays for the analysis of complex culture supernatants were newly constructed based on both the naturally occurring structural diversity of enzymes and the artificial structural diversity of PEGylated polyamines. PIC sensor arrays successfully recognized the phenotypic differences within the secretomic signatures in culture supernatants of the respective cells regardless of seeding density. The proposed array sensing system is the first secretome-based approach that enables markerless and noninvasive identification of mesenchymal stem cell differentiation. Markerless identification with noninvasiveness is the most significant feature of our PIC sensor array. Traditional biomarker-based methods for endpoint cell evaluation require prior knowledge of specific markers and the corresponding antibodies, which have not been identified in many situations. In addition, as our PIC sensor array does not need cell lysis or staining, evaluated cells can be used for other purposes or cell culture can be continued without damaging the cells. The statistical processing can be automated by the use of analytical software, and therefore this approach will provide an effective way to characterize cultured cells with common laboratory equipment, such as in the stepwise evaluation of the degree of stem cell differentiation and the prediction of lineage fates.Acknowledgements
We would like to thank Dr Shuji Takahashi (Graduate School of Science, Hiroshima University) and Dr Tsuyoshi Minami (Graduate School of Science and Engineering, Yamagata University) for fruitful comments. This work was supported by a Grant-in-Aid for JSPS Young Scientists (B, 26810074), and Scientific Research (B, 24350037).Notes and references
- (a) D. Rajamohan, E. Matsa, S. Kalra, J. Crutchley, A. Patel, V. George and C. Denning, BioEssays, 2013, 35, 281 CrossRef CAS PubMed; (b) M. B. Murphy, K. Moncivais and A. I. Caplan, Exp. Mol. Med., 2013, 45, e54 CrossRef PubMed; (c) V. Tabar and L. Studer, Nat. Rev. Genet., 2014, 15, 82 CrossRef CAS PubMed.
- D. G. Halme and D. A. Kessler, N. Engl. J. Med., 2006, 355, 1730 CrossRef CAS PubMed.
- O. Adewumi, B. Aflatoonian, L. Ahrlund-Richter, M. Amit, P. W. Andrews, G. Beighton, P. A. Bello, N. Benvenisty, L. S. Berry, S. Bevan, B. Blum, J. Brooking, K. G. Chen, A. B. Choo, G. A. Churchill, M. Corbel, I. Damjanov, J. S. Draper, P. Dvorak, K. Emanuelsson, R. A. Fleck, A. Ford, K. Gertow, M. Gertsenstein, P. J. Gokhale, R. S. Hamilton, A. Hampl, L. E. Healy, O. Hovatta, J. Hyllner, M. P. Imreh, J. Itskovitz-Eldor, J. Jackson, J. L. Johnson, M. Jones, K. Kee, B. L. King, B. B. Knowles, M. Lako, F. Lebrin, B. S. Mallon, D. Manning, Y. Mayshar, R. D. McKay, A. E. Michalska, M. Mikkola, M. Mileikovsky, S. L. Minger, H. D. Moore, C. L. Mummery, A. Nagy, N. Nakatsuji, C. M. O'Brien, S. K. Oh, C. Olsson, T. Otonkoski, K. Y. Park, R. Passier, H. Patel, M. Patel, R. Pedersen, M. F. Pera, M. S. Piekarczyk, R. A. Pera, B. E. Reubinoff, A. J. Robins, J. Rossant, P. Rugg-Gunn, T. C. Schulz, H. Semb, E. S. Sherrer, H. Siemen, G. N. Stacey, M. Stojkovic, H. Suemori, J. Szatkiewicz, T. Turetsky, T. Tuuri, S. van den Brink, K. Vintersten, S. Vuoristo, D. Ward, T. A. Weaver, L. A. Young and W. Zhang, Nat. Biotechnol., 2007, 25, 803 CrossRef CAS PubMed.
- (a) P. Anzenbacher Jr, P. Lubal, P. Bucek, M. A. Palacios and M. E. Kozelkova, Chem. Soc. Rev., 2010, 39, 3954 RSC; (b) J. R. Askim, M. Mahmoudi and K. S. Suslick, Chem. Soc. Rev., 2013, 42, 8649 RSC.
- (a) G. V. Zyryanov, M. A. Palacios and P. Anzenbacher Jr, Angew. Chem., Int. Ed., 2007, 46, 7849 CrossRef CAS PubMed; (b) Z. Yao, X. Feng, W. Hong, C. Li and G. Shi, Chem. Commun., 2009, 4696 RSC; (c) A. M. Mallet, Y. Liu and M. Bonizzoni, Chem. Commun., 2014, 50, 5003 RSC.
- (a) N. Y. Edwards, T. W. Sager, J. T. McDevitt and E. V. Anslyn, J. Am. Chem. Soc., 2007, 129, 13575 CrossRef CAS PubMed; (b) S. H. Lim, C. J. Musto, E. Park, W. Zhong and K. S. Suslick, Org. Lett., 2008, 10, 4405 CrossRef CAS PubMed; (c) K. L. Bicker, J. Sun, M. Harrell, Y. Zhang, M. M. Pena, P. R. Thompson and J. J. Lavigne, Chem. Sci., 2012, 3, 1147 RSC; (d) S. G. Elci, D. F. Moyano, S. Rana, G. Y. Tonga, R. L. Phillips, U. H. F. Bunz and V. M. Rottelo, Chem. Sci., 2013, 4, 2076 RSC.
- (a) T. Zhang, N. Y. Edwards, M. Bonizzoni and E. V. Anslyn, J. Am. Chem. Soc., 2009, 131, 11976 CrossRef CAS PubMed; (b) S. Rochat, J. Gao, X. Qian, F. Zaubitzer and K. Severin, Chem.–Eur. J., 2010, 16, 104 CrossRef CAS PubMed; (c) S. A. Minaker, K. D. Daze, M. C. Ma and F. Hof, J. Am. Chem. Soc., 2012, 134, 11674 CrossRef CAS PubMed.
- (a) M. De, S. Rana, H. Akpinar, O. R. Miranda, R. R. Arvizo, U. H. F. Bunz and V. M. Rotello, Nat. Chem., 2009, 1, 461 CrossRef CAS PubMed; (b) O. R. Miranda, H. T. Chen, C. C. You, D. E. Mortenson, X. C. Yang, U. H. F. Bunz and V. M. Rotello, J. Am. Chem. Soc., 2010, 132, 5285 CrossRef CAS PubMed; (c) H. Pei, J. Li, M. Lv, J. Wang, J. Gao, J. Lu, Y. Li, Q. Huang, J. Hu and C. Fan, J. Am. Chem. Soc., 2012, 134, 13843 CrossRef CAS PubMed; (d) D. Zamora-Olivares, T. S. Kaoud, K. N. Dalby and E. V. Anslyn, J. Am. Chem. Soc., 2013, 135, 14814 CrossRef CAS PubMed; (e) D. Zamora-Olivares, T. S. Kaoud, J. Jose, A. Ellington, K. N. Dalby and E. V. Anslyn, Angew. Chem., Int. Ed., 2014, 53, 14064 CrossRef CAS PubMed; (f) L. Motiei, Z. Pode, A. Koganitsky and D. Margulies, Angew. Chem., Int. Ed., 2014, 53, 9289 CrossRef CAS PubMed.
- S. Tomita and K. Yoshimoto, Chem. Commun., 2013, 49, 10430 RSC.
- S. Tomita, T. Soejima, K. Shiraki and K. Yoshimoto, Analyst, 2014, 139, 6100 RSC.
- (a) A. Bajaj, O. R. Miranda, I. B. Kim, R. L. Phillips, D. J. Jerry, U. H. F. Bunz and V. M. Rotello, Proc. Natl. Acad. Sci. U. S. A., 2009, 106, 10912 CrossRef CAS PubMed; (b) A. Bajaj, O. R. Miranda, R. Phillips, I. B. Kim, D. J. Jerry, U. H. F. Bunz and V. M. Rotello, J. Am. Chem. Soc., 2010, 132, 1018 CrossRef CAS PubMed; (c) K. El-Boubbou, D. C. Zhu, C. Vasileiou, B. Borhan, D. Prosperi, W. Li and X. J. Huang, J. Am. Chem. Soc., 2010, 132, 4490 CrossRef CAS PubMed; (d) S. Rana, A. K. Singla, A. Bajaj, S. G. Elci, O. R. Miranda, R. Mout, B. Yan, F. R. Jirik and V. M. Rotello, ACS Nano, 2012, 6, 8233 CrossRef CAS PubMed; (e) X. Yang, J. Li, H. Pei, Y. Zhao, X. Zuo, C. Fan and Q. Huang, Anal. Chem., 2014, 86, 3227 CrossRef CAS PubMed.
- K. J. Brown, C. A. Formolo, H. Seol, R. L. Marathi, S. Duguez, E. An, D. Pillai, J. Nazarian, B. R. Rood and Y. Hathout, Expert Rev. Proteomics, 2012, 9, 337 CrossRef CAS PubMed.
- (a) P. Dowling and M. Clynes, Proteomics, 2011, 11, 794 CrossRef CAS PubMed; (b) T. B. Schaaij-Visser, M. de Wit, S. W. Lam and C. R. Jimenez, Biochim. Biophys. Acta, 2013, 1834, 2242 CrossRef CAS PubMed.
- (a) A. J. Salgado, R. L. Reis, N. J. Sousa and J. M. Gimble, Curr. Stem Cell Res. Ther., 2010, 5, 103 CrossRef CAS; (b) H. K. Skalnikova, Biochimie, 2013, 95, 2196 CrossRef PubMed.
- (a) S. Zvonic, M. Lefevre, G. Kilroy, Z. E. Floyd, J. P. DeLany, I. Kheterpal, A. Gravois, R. Dow, A. White, X. Wu and J. M. Gimble, Mol. Cell. Proteomics, 2007, 6, 18 CrossRef CAS PubMed; (b) J. M. Kim, J. Kim, Y. H. Kim, K. T. Kim, S. H. Ryu, T. G. Lee and P. G. Suh, J. Cell. Physiol., 2013, 228, 216 CrossRef CAS PubMed.
- C. Chiellini, O. Cochet, L. Negroni, M. Samson, M. Poggi, G. Ailhaud, M. C. Alessi, C. Dani and E. Z. Amri, BMC Mol. Biol., 2008, 9, 26 CrossRef PubMed.
- (a) S. Ganguli, K. Yoshimoto, S. Tomita, H. Sakuma, T. Matsuoka, K. Shiraki and Y. Nagasaki, J. Am. Chem. Soc., 2009, 131, 6549 CrossRef CAS PubMed; (b) S. Tomita, L. Ito, H. Yamaguchi, G. Konishi, Y. Nagasaki and K. Shiraki, Soft Matter, 2010, 6, 5320 RSC; (c) S. Tomita and K. Shiraki, J. Polym. Sci., Part A: Polym. Chem., 2011, 49, 3835 CrossRef CAS PubMed; (d) T. Kurinomaru, S. Tomita, S. Kudo, S. Ganguli, Y. Nagasaki and K. Shiraki, Langmuir, 2012, 28, 4334 CrossRef CAS PubMed.
- I. V. Tetko, J. Gasteiger, R. Todeschini, A. Mauri, D. Livingstone, P. Ertl, V. A. Palyulin, E. V. Radchenko, N. S. Zefirov, A. S. Makarenko, V. Y. Tanchuk and V. V. Prokopenko, J. Comput.-Aided Mol. Des., 2005, 19, 453 CrossRef CAS PubMed.
- G. Fernandez-Lorente, C. Ortiz, R. L. Segura, R. Fernandez-Lafuente, J. M. Guisan and J. M. Palomo, Biotechnol. Bioeng., 2005, 92, 773 CrossRef CAS PubMed.
- B. G. Tabachnick and L. S. Fidell, Using Multivariate Statistics, Allyn & Bacon, Needham Heights, MA, 4th edn, 2001 Search PubMed.
- X. Zeng, P. Yang, B. Chen, X. Jin, Y. Liu, X. Zhao and S. J. Liang, Proteomics, 2013, 89, 51 CrossRef CAS PubMed.
- (a) H. Mizuno, M. Tobita and A. C. Uysal, Stem Cells, 2012, 30, 804 CrossRef CAS PubMed; (b) S. Wang, X. Qu and R. C. Zhao, J. Hematol. Oncol., 2012, 5, 19 CrossRef CAS PubMed.
Footnote |
| † Electronic supplementary information (ESI) available: Experimental procedures, titration of PEGylated polyamines with enzymes, schematic representation for the sensing procedure, response profiles, LDA, and discrimination of human lung-derived cells. See DOI: 10.1039/c5sc01259g |
| This journal is © The Royal Society of Chemistry 2015 |

