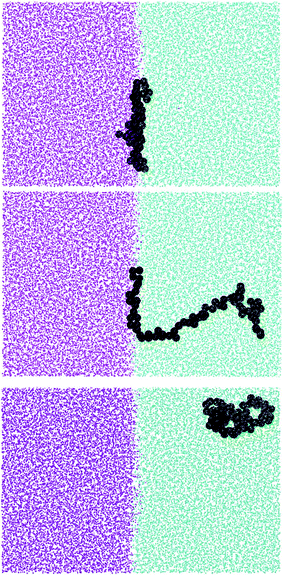
Thermodynamics of linear and star polymers at fluid interfaces†
Tseden
Taddese
a,
Paola
Carbone
*a and
David L.
Cheung
bc
aSchool of Chemical Engineering and Analytical Science, The University of Manchester, Oxford Road, Manchester M13 9PL, UK. E-mail: paola.carbone@manchester.ac.uk
bDepartment of Chemistry, University of Warwick, Coventry, CV4 7AL, UK. E-mail: david.cheung@strath.ac.uk
cDepartment of Pure and Applied Chemistry, University of Strathclyde, Glasgow, G1 1XL, UK
First published on 21st October 2014
Abstract
Performing molecular dynamics simulations on model systems we study the structural changes and thermodynamic stability of polymers of varying topology (linear and star-shaped) at interface between two liquids. We find that homopolymers are attracted to the interface in both good and poor solvent conditions showing that they are surface active molecules even though not amphiphilic. In most cases changing polymer topology had only a minor effect on the desorption free energy. A noticeable dependence on polymer topology is only seen for relatively high molecular weight polymers at interface between two good solvents. Examining separately the enthalpic and entropic components of the desorption free energy suggests that its largest contribution is the decrease in the enthalpic part of interfacial free energy caused by the adsorption of the polymer at the interface. Finally we propose a simple method to qualitatively predict the trend of the interfacial free energy as a function of the polymer molecular weight.
1. Introduction
The behaviour of polymers at a liquid–liquid interface has become increasingly technologically important in recent years. For example, many of the self-assembly processes involving macromolecules occur at such interfaces1,2 and the stability of micro- and nano-emulsions are determined by an efficient migration of polymers (or surfactants) towards the boundaries between the two solvents. Chemical reactions can also be carried out at a liquid–liquid interface, as for example in some types of polymerisation reactions (typically a condensation reaction)3 or to functionalise the macromolecule itself.4 Moreover, one of the most common chemical processes used to produce polymer nanoparticles especially for medical applications − the solvent displacement method − exploits the varying solubility of polymers in different solvents. The process involves the diffusion of the polymer chains from a good solvent, where the polymer initially dissolves, to a non-solvent where the nanoparticles are formed.5,6 Finally, polymer-based drug nanocarriers (either nanoparticles or micelles) are becoming increasingly popular in drug delivery. Therefore their behaviour at fluid interfaces (such as a lipid/water boundary) should be properly understood in order to predict their biological activity.7,8As organic synthesis advances it is becoming possible to create macromolecules with more complex architectures than simple linear polymers, including star or ring polymers and dendrimers.9 In particular star polymers have attracted particular attention due to their unique structure and relatively easy synthetic route.9 They show a range of different behaviours, both in bulk solution and at interfaces, and have found use in areas such as organic electronics10 and drug delivery.11 The use of hyper-branched polymers in interfacial science is also becoming popular, as it is generally thought that the presence of side chains should enhance the adhesion and mobility of polymers on interfaces (mainly solid). However, it has recently been shown that the interfacial adhesion of branched polymers is significantly improved only if a complicated topology of the macromolecule is coupled with a strong molecular bond with the surface.12
While the behaviour of polymers at solid interfaces has been extensively studied,13,14 the behaviour of polymers at fluid interfaces has been less thoroughly investigated, despite its technological importance. In fact, the adsorption of polymers at a liquid–liquid interface is different from that at a solid/liquid one as the macromolecule penetrates both phases proportionally to their solubility. Furthermore, if the two solvents are immiscible, it is expected that the presence of the polymer lowers the interfacial tension by screening the unfavourable interactions between the two solvents.15 The few theoretical works present in the literature support this idea. Halperin and Pincus16 have used a mean field approach to investigate a ternary system of a monodisperse polymer at a liquid–liquid interface and found that homopolymers may indeed be attracted to the interface. The authors suggested that responsible for this attraction was the presence of the polymer monomers between the two solvents which lowered the free energy of the system. Along with theoretical work, computer simulations can also help in understanding the thermodynamic stability of nano-objects at fluid interfaces and correlate it with the structural changes occurring in the system. For example, recent simulations of a model system have shown that uniform dendrimers interact strongly with liquid–liquid interfaces.17 The interaction is similar to that previously found for nanoparticles;18 specifically the interaction range is significantly larger than it would be expected from simple consideration of the dendrimer size and the desorption free energy was similar to that calculated for nanoparticles of comparable size. Moreover, when the dendrimer is functionalised with end groups with different affinities for the two solvent components the interfacial stability increases. The stability also increased when a core–shell structure was considered. The dendrimer also undergoes significant changes in shape, going from spherical in bulk solution, to disk-like at the interface, and adopting an elongated cigar-like structure at intermediate separations. These studies also demonstrated that the use of a generic bead-spring model for such simulations can provide results relevant to experimental systems (for example the observed shape change in the bead-spring dendrimer model was similar to that seen in atomistic simulations of PAMAM dendrimers at the air–water interface19) opening the possibility of developing a generic theoretical framework valid for any macromolecular system irrespectively of its chemical composition.
The aim of this work is to investigate how the interfacial stability of polymers is affected by the molecular weight and the topology of the chain. Moreover, we seek a relation which could predict the tendency of a polymer to diffuse into one of the two solvents as a function of its molecular weight and solvent quality. As in previous work17 we use molecular dynamics simulations employing a bead-spring representation of the polymer and model the solvent as a binary Lennard-Jones mixture. Different lengths of linear polymers are studied in order to investigate the effect of molecular weight on the adsorption strength. Star polymers of different functionalities are also modelled to address the effect of polymer topology on the interfacial adsorption. By keeping the number of beads in the star polymers constant we aim to isolate the effect of changing the polymer topology, whilst changing the polymer–solvent interactions allows us to study how the interfacial behaviour is affected by the solvent quality.
Following this introduction we outline the simulation model and methodology employed in this work. We then present the results, focusing first on the interaction between polymer and interface as a function of chain topology and size and solvent quality. Next we will discuss the separate contributions to the stability of macromolecules at liquid interfaces, and examine the relationship between the properties of polymers in bulk solution and their adsorption. Finally we present some conclusions and possible avenues for further work.
2. Model and methodology
In order to determine the effect of topology on the adsorption of polymers at a liquid–liquid interface, simulations were performed on both linear and star polymers. For the linear polymer chain model, the number of monomers was varied from 25 to 90. A comparison was then made with four star polymer models with the same (or similar) number of monomers as two linear ones. Within the star polymer models, the functionality was also varied: while the total number of monomers was kept constant their arrangement and the number and length of arms varied. For the remainder of this paper the linear polymers will be referred to as Lx, (where x is the number of monomers) and the star polymers as NyLx (where y is the number of arms and x is the arm length). The models used in the simulations are summarised in Table 1.| Model label | N totm | N a | N am |
|---|---|---|---|
| L25 | 25 | 1 | — |
| L40 | 40 | 1 | — |
| L50 | 50 | 1 | — |
| L60 | 60 | 1 | — |
| L70 | 70 | 1 | — |
| L80 | 80 | 1 | — |
| L90 | 90 | 1 | — |
| N4L6 | 25 | 4 | 6 |
| N6L4 | 25 | 6 | 4 |
| N11L6 | 67 | 11 | 6 |
| N6L11 | 67 | 6 | 11 |
As in previous work the simulated systems consisted of a single polymer solvated in a binary mixture.17 The solvent was modelled as a two-component liquid, interacting through a cut and shifted Lennard-Jones potential.
 | (1) |
![[thin space (1/6-em)]](https://www.rsc.org/images/entities/char_2009.gif) 000 solvent beads (12
000 solvent beads (12![[thin space (1/6-em)]](https://www.rsc.org/images/entities/char_2009.gif) 000 of each component) were used but for the longest polymer chain a larger box of around 40
000 of each component) were used but for the longest polymer chain a larger box of around 40![[thin space (1/6-em)]](https://www.rsc.org/images/entities/char_2009.gif) 000 solvent beads were used, in order to avoid interaction with the period image. Throughout this paper, all the simulation results are reported in LJ reduced units. The values of the potential well depth, ε, the diameter of the bead, σ, and the solvent bead mass, m, are used to define the system units for the energy, length and mass respectively. The reduced temperature and pressure, T*and P*, are given by T* = kBT/ε and P* = (σ3/ε)P and the timescale is given by τ = (mσ2/ε)1/2 where kB is the Boltzmann constant, T is the absolute temperature and P is the pressure.
000 solvent beads were used, in order to avoid interaction with the period image. Throughout this paper, all the simulation results are reported in LJ reduced units. The values of the potential well depth, ε, the diameter of the bead, σ, and the solvent bead mass, m, are used to define the system units for the energy, length and mass respectively. The reduced temperature and pressure, T*and P*, are given by T* = kBT/ε and P* = (σ3/ε)P and the timescale is given by τ = (mσ2/ε)1/2 where kB is the Boltzmann constant, T is the absolute temperature and P is the pressure.
The polymer chain was modelled as a bead-and-spring model. Non-bonded interactions between the polymer beads and between the polymer and solvent particles were also modelled using the Lennard-Jones function of eqn (1). For the intra-chain (polymer–polymer) interactions a cutoff of rc = 21/6σ was used, while for polymer–solvent interactions two different cutoff distances were employed, depending on whether the solvent solvating the polymer was good or poor (rc = 2.5σ and rc = 21/6σ respectively). Note that in all cases the interactions between the polymer and both solvent components are identical, i.e. at an interface between two poor or two good solvents.
The polymer topology was maintained through a harmonic potential (Vbond)
 | (2) |
The free energy profile (or potential of mean force) was determined using the umbrella sampling technique (US).20 The simulations were started with the polymer fully solvated in one of the bulk phases; using the steered molecular dynamics (SMD) method the polymer was then moved towards the interface along a reaction path normal to the interface (z). The starting US configurations were then taken from the SMD trajectories. In each US window the distance between the centre of mass (CoM) of the polymer and solvent component A was restrained in the z direction using a harmonic potential
 | (3) |
All simulations were performed using the GROMACS simulation package version 4.5.4 (ref. 21) in the NPT ensemble with reduced temperature and pressure of T* = 1 and P* = 1 respectively. Temperature and pressure were controlled using a Nose–Hoover thermostat and barostat,22 with relaxation times of 0.5τ for both temperature and pressure. A timestep of 0.005τ was used throughout. Periodic boundary conditions were applied in all three directions.
3. Results
3.1 Effect of the polymer molecular weight, topology and solvent quality on the polymer–interface interaction and polymer structure
Shown in Fig. 1 are the free energy profiles for the linear and star polymer models (the labels used are as given in Table 1) in poor solvent (Fig. 1(a) and (b)) and good solvent (Fig. 1(c) and (d)), while Table 2 reports the values of free energy (FE) of desorption along with their standard errors. In all cases the polymer–interface interaction is attractive, showing that even chemically homogeneous polymers are interfacially active. It should be noted here that the two solvents are chemically identical, so the difference in free energy represents the propensity of the polymer chain to reside at the interface rather than in bulk. The fact that the polymer adsorbs at the interface between two good solvents is in agreement with previous theoretical and simulation work on dendrimers and nanoparticles. The approximately parabolic shape of the free energy profile would give rise to approximately Gaussian polymer concentration profiles, in agreement with the work of Halperin and Pincus.16 Generally nanoparticles or polymers may be expected to adsorb on the interface if the interfacial tension between the polymer and the solvent is lower than that between the two solvent components.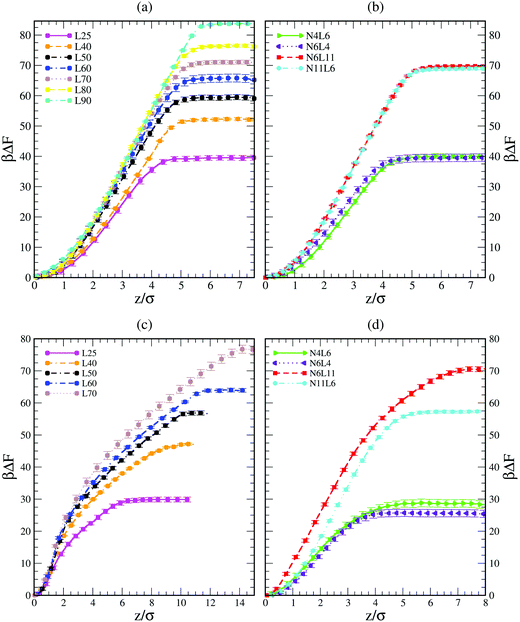 | ||
| Fig. 1 Free energy profiles for linear polymer and star polymer models in poor (a and b) and good solvent (c and d). Labels are explained in Table 1. | ||
| Model | FEcalc/kBT | |
|---|---|---|
| Poor solvent | Good solvent | |
| L25 | 39.5 ± 0.8 | 29.6 ± 0.8 |
| L40 | 51.9 ± 0.6 | 47.0 ± 0.3 |
| L50 | 59.1 ± 0.9 | 56.4 ± 0.7 |
| L60 | 65.4 ± 1.3 | 64.0 ± 0.6 |
| L70 | 70.7 ± 0.6 | 76.5 ± 1.2 |
| L80 | 76.3 ± 0.5 | — |
| L91 | 83.2 ± 0.2 | — |
| N4L6 | 40.1 ± 0.8 | 28.5 ± 1.1 |
| N6L4 | 39.4 ± 1.2 | 25.3 ± 1.2 |
| N11L6 | 68.6 ± 0.4 | 56.9 ± 0.4 |
| N6L11 | 69.4 ± 0.2 | 70.3 ± 0.8 |
 | (4) |
| Rg2 = tr(R2) = λ12 + λ22 + λ32 | (5) |
 ) and their components along the x, y and z axis (
 with α = β) for selected linear and star polymers in poor solvent as a function of the polymer–interface distance (for clarity only the largest molecular weight models are reported but all the other models show the same behaviour, see Fig. S1a in the ESI†). As expected, irrespectively of the polymer topology (or molecular weight; see ESI in Fig. S1† the polymer overall size changes only slightly with polymer–interface separation. Close to the interface the molecule radius of gyration is slightly higher than in bulk, due to the swelling of the polymer in the low density interfacial region, and starts to decrease towards the bulk value at around z = 4–5σ (depending on the polymer Mw). The larger values of Rg observed for the polymer near the interface may also arise due to the different geometries adopted by the molecules – in general rods and disks have larger radii of gyration than spheres of the same volume. Indeed the polymer assumes such non-spherical shapes because along the interface there is a thin region characterized by lower solvent density (see also below) which accommodates the polymer. For distances above ≈5σ, the molecule size becomes stable and reaches its bulk values (reported in Table S1† for all the linear polymers investigated).
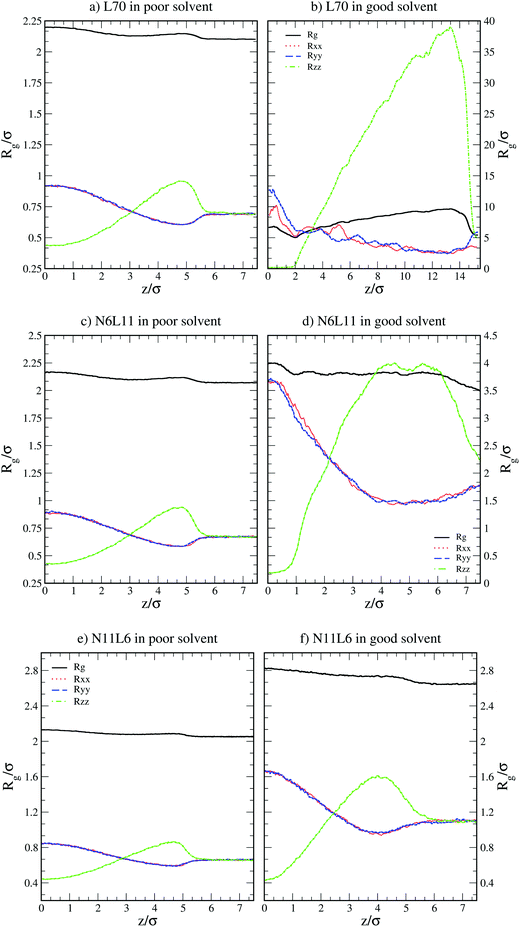 | ||
| Fig. 2 Radius of gyration (Rg) and its components in the x, y and z directions (Rxx, Ryy and Rzz) for linear polymer L70 and star polymers homologues N6L11 and N11L6 in poor and good solvents. | ||
More insight into the change in the 3D shape of the macromolecule can be gained by looking at the three different components of the radius of gyration: Rxx, Ryy and Rzz (Fig. 2). The plot shows that at the interface the macromolecule assumes a disk-like shape (Rzz ≪ Rxx = Ryy). Moving away from the interface, the polymer changes shape stretching towards the interface (Rzz > Rxx = Ryy) until it takes the unperturbed globular conformation (Rzz = Rxx = Ryy) when in bulk. These changes in the macromolecule shape can be quantified by calculating the structural parameters K1 and K2 (ref. 23) defined as K1 = (〈λ2〉 + 〈λ3〉)/(〈λ1〉 + 〈λ2〉) and K2 = (〈λ1〉 + 〈λ3〉)/(〈λ1〉 + 〈λ2〉) where λ1 ≥ λ2 ≥ λ3. Fig. 3 reports the values of K1 and K2 as a function of the distance from the interface for L70 and the corresponding star polymers, N6L11 and N11L6.
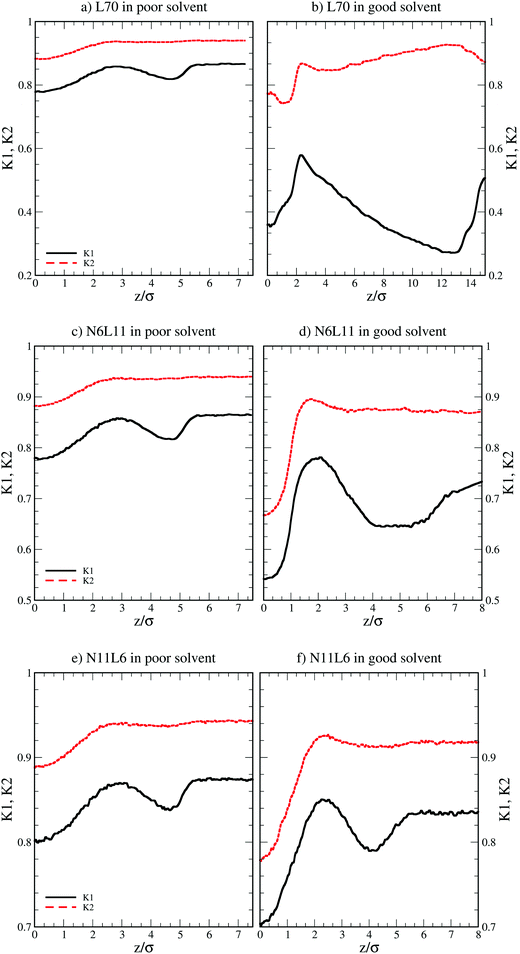 | ||
| Fig. 3 Structural parameters K1 and K2 for linear polymer L70 and star polymer homologues N6L11 and N11L6 in poor and good solvent. | ||
As expected the change in molecule shape is only subtle but it is now possible to observe that the value of z at which the maximum in the Rzz occurs corresponds to the separation at which the polymer changes from approximately spherical (K1 = K2 = 1) to a more elongated shape (an infinite thin rod corresponds to K1 = 0 and K2 = 1). Due to the compact shape of the macromolecules, their free energy profiles are very similar to that found for nanoparticles;18,24 specifically the interaction is relatively long-ranged (larger than the polymer Rg), in part due to broadening of the interface by thermal capillary waves, and the free energy increases smoothly before plateauing when in the bulk. As it will be discussed later, the similarity between the free energy profiles of polymers of different topologies originates from the fact that the molecule adopts a compact shape, screening the internal monomers from the solvent. Therefore, only the external monomers, those exposed to the solvent interactions, contribute to the calculated FE values. Finally, it can be seen that in the bulk solution the radius of gyration for the different linear polymers increases with the polymer Mw (see table S1 in the ESI†), following the scaling law Rg ∝ Mvw, with a Flory exponent ν = 0.33 in agreement with the theory.25
3.2 Calculated desorption free energy
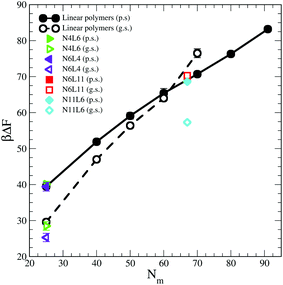
The influence of the macromolecules conformational freedom on their stability at the interface is highlighted in Fig. 5, where the values of desorption free energies reported in Table 2 are plotted against the polymer Mw. As expected, the FE of desorption increases with the polymer Mw, with this trend being more evident in good solvent than in poor solvent. As already noted, the length and number of arms in the star polymers affect the corresponding FE values only in good solvent and only for high Mw polymers. Moreover, since in good solvent the FE values increases more rapidly with the polymer Mw, for a long enough linear polymer chain, the FE of desorption in good solvent overtakes the value obtained for the same polymer in poor solvent. A similar effect can be also noticed for the star polymers where, when the arms are long enough (namely for N6L11) the desorption FE becomes comparable with that obtained in poor solvent for same Mw.In order to understand the desorption strength it is useful to decompose it into separate contributions. In particular three contributions may be calculated: (i) the change in the interfacial area between the two solvent components and the resulting change in interaction energy, (ii) the change in polymer–solvent interaction energy between the polymer in bulk solution and at the interface, and (iii) the change in polymer entropy.
The first contribution (change in interfacial area between the two solvents) has often been invoked to understand the adsorption of colloids and nanoparticles onto fluid interfaces. In this case the free energy of the colloid at the interface is often expressed as26
| FE = γ12A12 + γ1PA1P + γ2PA2P | (6) |
| ΔFi = γ12A12 + γiPAP − (γ12A′12 + γ1PA1P + γ2PA2P) | (7) |
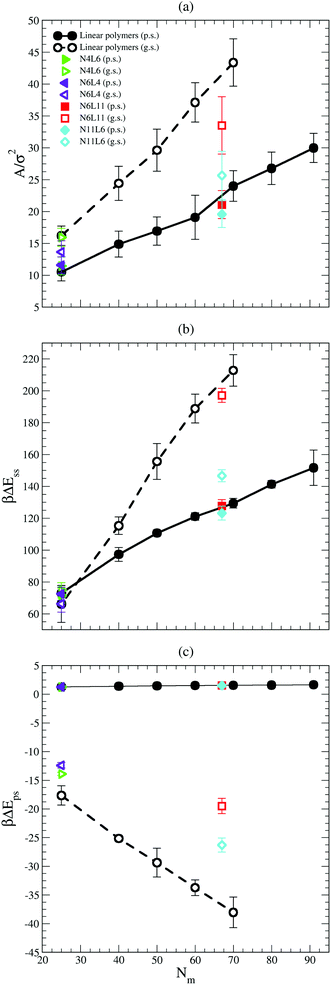
The values of the interfacial area (Aint) occupied by each polymer are shown in Fig. 6(a). This area is calculated as reported in ref. 19 where the simulation box is sliced perpendicular to the z axis and the van der Waals area occupied by the polymer beads belonging to the slice associated with the solvent–solvent interface (z = 0) is calculated. To calculate the area, a 2D grid is built around the portion of the molecule in contact with the interface. The area occupied by the polymer is estimated from the number of grid points (on the interface) that lie within 1σ of a polymer bead and the mesh of the grid is tuned until the resulting area converges. As expected the area occupied by the polymer at the interface is larger in good solvent than in poor solvent, and it increases with the polymer Mw. The larger the polymer interfacial area is, the higher the effective screening of the unfavourable interactions between the two solvents (which are responsible of the positive desorption FE values obtained in both solvent cases) becomes. Indeed the trend in interfacial area reported in Fig. 6(a) correlates with the fact that the FE increases with the polymer Mw faster in good solvent than in poor one. The effect of the polymer topology can be as well understood from Fig. 6(a). In good solvent star polymers with short arms (N6L4 and N11L6) show a lower interfacial area compared with their linear homologues and this effect becomes more apparent for larger Mw.
The importance of the screening effect mentioned above is even more clear in Fig. 6(b) which shows that the major enthalpic contribution to the desorption free energy is given by the solvent–solvent interaction (ΔEss). Indeed, for both poor and good solvent cases the difference in intermolecular energy is positive (i.e. the system favours configurations with the polymer at the interface) and of the order of hundreds of kBT. The values of ΔEss also follow the same trend with the polymer Mw and topology as that shown by the FE, increasing with the number of monomers along the chain for the linear polymers and with the length of the arm for the star ones. Finally, as in the FE case, ΔEss increases with the polymer Mw more rapidly in good solvent than in poor solvent. The values obtained for ΔEss are, however, higher than the calculated FE, indicating that other contributions reducing the stability of the polymer at the interface play a role.
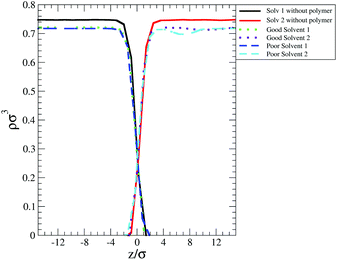
One of these contributions is the difference in polymer–solvent interaction energy (ΔEps) between polymers in bulk solution and at the interface shown in Fig. 6(c). In poor solvent ΔEps is small (of the order of kBT) and positive while in the good solvent ΔEps is of the order of tens of kBT and is negative. These results can be understood observing that at the interface the solvent density is lower than in bulk (see Fig. 7) and therefore the number of polymer–solvent contacts are minimised when the polymer is absorbed at the interface. The density profiles in Fig. 7 show the expected sigmoidal behaviour for an interface broadened by thermal capillary waves.
In poor solvent this reduction in the number of contacts leads to a slight stabilisation of the polymer at the interface. Instead in good solvent, it leads to an increase of the energy of the system which prefers to have the polymer surrounded by the highest possible number of solvent beads and therefore favours the configuration where the polymer is placed in bulk. In good solvent ΔEps shows indeed an opposite trend with the polymer Mw and topology than that shown by the values of the FE: ΔEps decreases with the number of monomers (i.e. the higher is the Mw, the less favourable is the configuration where the polymer is at the interface) and with the number of arms (N11L6 is the polymer with the lowest ΔEps (−26.3 kBT) among the star polymers).
The contribution from the entropy change is harder to estimate than the previous terms. Assuming that the polymer translational entropy change is negligible, the change in entropy due to the adsorption of the chain into the interface is mainly due to a change in its conformational entropy (Sc). Knowing all the possible microstates (i.e. configurations) accessible to the polymer chain, the value of Sc can be evaluated using the Gibbs entropy equation
| Sc = −kB∑P(R)lnP(R) | (8) |
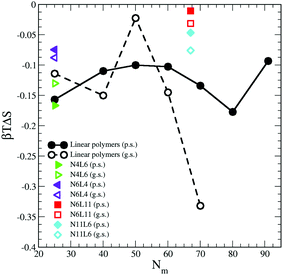 | ||
| Fig. 8 Change in polymer conformational entropy. Data for the poor (p.s.) and good (g.s.) solvents denoted by filled and open symbols respectively. | ||
For both poor and good solvents, it is expected that the solvent entropy will increase when the polymer is at the interface, which as we will see in the next section, seems to be the case.
3.3 Prediction of the desorption free energy from bulk simulations
Computationally, the prediction of the FE values for processes involving macromolecules is very time consuming. Each configuration featuring the polymer chain at a specific spatial position needs to be simulated for a long time in order to collect enough data to obtain FE values with small statistical uncertainty. Experimentally the collection of thermodynamic data such as partition coefficients or solubility parameters for polymer solutions is also time consuming and it is a common practice to resort to contribution theory methods. This involves measuring a specific thermodynamic property for a small molecule that resembles the polymer monomer and the same property is estimated for the polymer assuming additivity.28 Although this procedure is attractive since it is simple and the data for small organic molecules are often widely available, the approach does not always provide accurate results.29 Indeed the assumption that all monomers of the polymer chain contribute equally to the polymer properties is not always correct. Our FE data suggests that this is not true, especially for a polymer dissolved in poor solvents. Here monomers which are buried inside the polymer ‘blob’ do not interact with the solvent molecules and therefore do not contribute to the calculated FE. Indeed if the FE values reported in Table 1 are normalised by the number of polymer monomers, it is not possible to obtain a constant value indicating that not all the monomers contribute to the desorption FE. Here, we attempt to predict the FE values obtained with the umbrella sampling technique using data available from short simulations of polymers in bulk solution.Firstly we combine the separate contributions calculated in the previous section. We then obtain the following equation
| ΔFpred = ΔH − TΔS = γ12Aint + ΔEps − TΔSp | (9) |
In this relation we neglect the change in solvent configurational entropy (ΔSs), which we haven't calculated. Our predicted FE values therefore contain the contribution coming from the solvent–solvent interaction screened by the presence of the polymer (γ12Aint) where Aint is the polymer interfacial area (Fig. 6(a) and γ12 = 1.54 kBTσ−2 is the interfacial tension calculated from the difference between the normal and transverse pressures (γ12 = (L/2) (PN − PT)), the polymer–solvent enthalpic contribution (ΔEps) (Fig. 6(c)) and the polymer conformation entropy change (ΔSp) (Fig. 8). In Fig. 9 the value of the predicted (using eqn (9)) desorption free energy are plotted against the polymer Mw. As it can be seen the predicted FE values are consistently smaller than the calculated one. The difference between the calculated and predicted FE values increases with the polymer Mw and is larger in the good solvent than in the poor solvent. The underestimation of the FE obtained from eqn (9) might therefore be ascribed to the neglected contribution of the solvent entropy, which seems to play a crucial role in the determination of the FE values. Although eqn (9) cannot quantitatively predict the FE values, it can qualitatively predict their dependence with the chain topology and, less accurately, on the Mw. Indeed, the predicted FE values in poor solvent are not affected by the polymer topology, and the dependence on the length of the polymer arms is only visible in good solvent (although we should notice that the predicted values underestimate this dependence). The FE increases with the polymer Mw but this increase is less than calculated from simulation, in particular for the good solvent case.
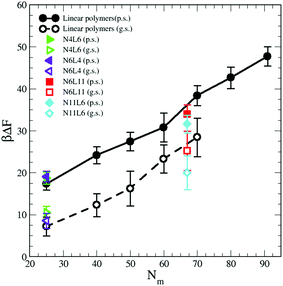 | ||
| Fig. 9 Predicted adsorption free energy for the star and linear polymers using eqn (9). Data for poor (p.s.) and good solvent (g.s.) denoted by filled and open symbols respectively. | ||
Considering that the magnitude of the FE of desorption depends on the interaction between the polymer and the solvent, another approach that can be followed to predict its trend is to take into account the polymer solvent accessible surface area (SASA). A dependence on the SASA may be expected, as only the polymer beads near the surface will contribute to the polymer solvent interaction and the number of surface beads is reasonably approximated by the SASA. This approach is akin to that used to develop implicit solvent models for biological macromolecules and more recently applied also on model polyelectrolytes where the SASA values are used to calculate the solvation free energy.30,31
We then calculate the SASA for each polymer (linear and star) in bulk of both good and poor solvents using a probe with a radius identical to that of the solvent bead using the analytical method proposed by Eisenhaber et al.32 and implemented in the program g_sas of GROMACS.21 The resulting SASA values are reported against the corresponding FE data in Fig. 10 where the values of the FE calculated for a single bead in both solvents and the corresponding SASA (calculated analytically) are also reported. As can be seen there is a perfect correlation between the values of SASA and those of the corresponding desorption FE for all systems simulated irrespectively to the topology of the polymer. The predicted FE using this approach can be therefore calculated as
| ΔFpred = ΔFb × SASA | (10) |
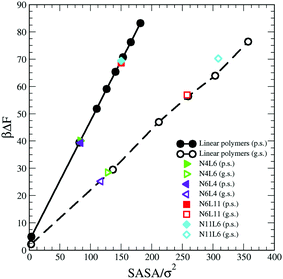 | ||
| Fig. 10 Solvent Accessible Surface Area (SASA) calculated for polymer models reported in Table 1 against the corresponding calculated free energy values. Data for poor (p.s.) and good (g.s.) solvent denoted by filled and open symbols respectively. | ||
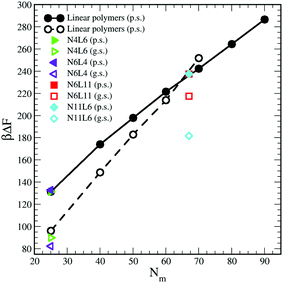 | ||
| Fig. 11 Predicted free energy values calculated using eqn (10). Data for poor (p.s.) and good solvent (g.s.) denoted by filled and open symbols respectively. | ||
4. Summary and conclusions
The understanding of the behaviour of macromolecules near fluid interfaces is vital in order to control and design new interfacial processes such as those occurring in foams or emulsions. Very little it is known on the thermodynamics of these interfacial systems and on the effect that the topology of the macromolecules has on their stability. By means of a simplified model we have been able to start to reveal the basic thermodynamic contributions to the polymer adsorption strength and correlate them to the polymer structural properties.We found that in all the cases analysed the homopolymer acts as surface active molecule, showing a propensity to reside at the interface. In common with nanoparticles and dendrimers this demonstrates that, irrespectively to the nature of the solvent, explicit amphiphilicity is not necessary for surface active species.
We noticed that the desorption free energy increases with the polymer molecular weight in both poor and good solvents but in the latter this increase is more rapid than in the former. For high molecular weight linear polymers this increase leads to a desorption free energy which is higher in good solvent than in poor solvent. Moreover we observed that the polymer topology affects the interfacial stability of the macromolecule only in good solvent and for star polymers with long arms.
We explain these findings in terms of polymer structural changes. Calculating the three components of the radius of gyration along the x, y and z axes and the eigenvalues of the gyration tensor, we find that the polymer chain undergoes few conformational changes moving away from the interface. These conformational changes are more evident in good solvent than in poor one. In both cases these structural changes act to decrease the interfacial area between the two immiscible solvents. In particular, in good solvent, when at the interface, the polymer occupies as much area as possible helped also by an increased conformational freedom due to a reduced solvent density. Away from the interface the chain extends and assumes a two domain structure where one of the domains is still in contact with the interface. Similar structural changes, although less evident, occur also in poor solvent and it is possible to correlate them to the free energy profiles.
In order to determine the factors that control the adsorption strength at the interface, we have evaluated different contributions to the desorption free energy. The largest contribution arises from the decrease in interfacial area between the two immiscible liquids caused by the adsorption of the polymer at the interface. This is similar to the mechanism by which nanoparticles adsorb at liquid interfaces. The stability of the polymer at the interface is counterbalanced, in good solvent, by the favourable interactions between the polymer and the solvent in bulk, leading to a significant decrease in free energy. We also showed that the polymer conformational entropy represents a very small contribution to the total free energy of the system. Our results show that the propensity of the chain to move towards the interface depends on the polymer–solvent interfacial tensions (in this case assumed to be the same). It is therefore probable that those values together with the solvent–solvent interfacial tension are critical for the polymer adsorption to occur. For nanoparticles or colloids adsorption at liquid interfaces is expected when γ12 ≥ |γ1P − γ2P| (neglecting line tension). It is worth noticing that since the model employed assumes extreme dilution (one non-interacting chain) we expect that at high polymer concentration, where polymer monolayer can be formed, the chain conformational entropy plays a greater role in the stability of the system.
Finally, we attempted to predict the desorption FE using data obtained from bulk simulations. We found that the solvent entropy seems to be a major contributor to the desorption FE and predictions neglecting this term lead to an underestimation of its value. If we instead use the data related to the polymer solvent accessible surface area calculated in bulk, the predicted FE (although the actual numbers are higher than the calculated values), follow the expected trend with the polymer Mw and topology. This opens the possibility of devising a novel and simple method to predict the stability of polymers at fluid interfaces without performing time consuming calculations. Work to investigate the applicability of this method to chemically detailed systems is currently on going.
Acknowledgements
This work was partially funded by the Leverhulme Trust (ECF/2010/2054). Computational facilities for this work were provided by the Centre for Scientific Computing, University of Warwick and the Computer Shared Facility, University of Manchester.References
- C. N. R. Rao, G. U. Kulkarni, V. V. Agrawal, U. K. Gautam, M. Ghosh and U. Tumkurkar, J. Colloid Interface Sci., 2005, 289, 305–318 CrossRef CAS PubMed.
- L. Hu, M. Chen, X. Fang and L. Wu, Chem. Soc. Rev., 2012, 41, 1350–1362 RSC.
- P. W. Morgan, Interfacial Polymerization, John Wiley & Sons, Inc, 2011 Search PubMed.
- K. Landfester, Angew. Chem., Int. Ed., 2009, 48, 4488–4507 CrossRef CAS PubMed.
- D. Quintanar-Guerrero, E. Allemann, H. Fessi and E. Doelker, Drug Dev. Ind. Pharm., 1998, 24, 1113–1128 CrossRef CAS PubMed.
- N. Di Pasquale, D. L. Marchisio, P. Carbone and A. A. Barresi, Chem. Eng. Res. Des., 2013, 91, 2275–2290 CrossRef CAS PubMed.
- M. Redhead, G. Mantovani, S. Nawaz, P. Carbone, D. C. Gorecki, C. Alexander and C. Bosquillon, Pharm. Res., 2012, 29, 1908–1918 CrossRef CAS PubMed.
- S. Nawaz, M. Redhead, G. Mantovani, C. Alexander, C. Bosquillon and P. Carbone, Soft Matter, 2012, 8, 6744–6754 RSC.
- K. Inoue, Prog. Polym. Sci., 2000, 25, 453–571 CrossRef CAS.
- X. Guo, M. Baumgarten and K. Mullen, Prog. Polym. Sci., 2013, 38, 1832–1908 CrossRef CAS PubMed.
- J. N. Liu, H. E. Duong, M. R. Whittaker, T. P. Davis and C. Boyer, Macromol. Rapid Commun., 2012, 33, 760–766 CrossRef CAS PubMed.
- S. Kienle, M. Gallei, H. Yu, B. Zhang, S. Krysiak, B. N. Balzer, M. Rehahn, A. D. Schluter and T. Hugel, Langmuir, 2014, 30, 4351–4357 CrossRef CAS PubMed.
- K. Johnston and V. Harmandaris, Macromolecules, 2013, 46, 5741–5750 CrossRef CAS.
- R. D. Priestley, C. J. Ellison, L. J. Broadbelt and J. M. Torkelson, Science, 2005, 309, 456–459 CrossRef CAS PubMed.
- R. A. L. Jones and R. W. Richards, Polymers at surfaces and Interfaces, Cambridge University Press, 2006 Search PubMed.
- A. Halperin and P. Pincus, Macromolecules, 1986, 19, 79–84 CrossRef CAS.
- D. L. Cheung and P. Carbone, Soft Matter, 2013, 9, 6841–6850 RSC.
- D. L. Cheung and S. A. F. Bon, Phys. Rev. Lett., 2009, 102, 066103–066107 CrossRef.
- S. Nawaz and P. Carbone, J. Phys. Chem. B, 2011, 115, 12019–12027 CrossRef CAS PubMed.
- S. Kumar, D. Bouzida, R. H. Swendsen, P. A. Kollman and J. M. Rosenberg, J. Comput. Chem., 1992, 13, 1011–1021 CrossRef CAS.
- B. Hess, C. Kutzner, D. van der Spoel and E. Lindahl, J. Chem. Theory Comput., 2008, 4, 435–447 CrossRef CAS.
- H. J. C. Berendsen, J. P. M. Postma, W. F. van Gusteren, A. Di Nola and J. R. Haak, J. Chem. Phys., 1984, 81, 3684–3690 CrossRef CAS PubMed.
- V. A. Ivanov, M. R. Stukan, V. V. Vasilevskaya, W. Paul and K. Binder, Macromol. Theory Simul., 2000, 9, 488–499 CrossRef CAS.
- D. L. Cheung, J. Chem. Phys., 2011, 135, 51704 CrossRef PubMed.
- M. Rubinstein and R. H. Colby, Polymer Physics, Oxford University Press, 2003 Search PubMed.
- F. Bresme and M. Oettel, J. Phys.: Condens. Matter, 2007, 19, 413101–413134 CrossRef.
- S. R. Euston, Biomacromolecules, 2010, 11, 2781–2787 CrossRef CAS PubMed.
- B. A. Miller-Chou and J. L. Koenig, Prog. Polym. Sci., 2003, 28, 1223–1270 CrossRef CAS.
- B. C. Lee and R. P. Danner, AIChE J., 1996, 42, 837–849 CrossRef CAS.
- J. Kleinjung and F. Fraternali, Curr. Opin. Struct. Biol., 2014, 25, 126–134 CrossRef CAS PubMed.
- G. Reddy and A. Yethiraj, J. Chem. Phys., 2010, 132, 74903–74907 CrossRef PubMed.
- F. Eisenhaber, P. Lijnzaad, P. Argos, C. Sander and M. Scharf, J. Comput. Chem., 1995, 16, 273–284 CrossRef CAS.
Footnote |
| † Electronic supplementary information (ESI) available. See DOI: 10.1039/c4sm02102a |
| This journal is © The Royal Society of Chemistry 2015 |

