 Open Access Article
Templated blue phases
Miha
Ravnik
*abc and
Jun-ichi
Fukuda
b
aFaculty of Mathematics and Physics, University of Ljubljana, Jadranska 19, 1000 Ljubljana, Slovenia. E-mail: miha.ravnik@fmf.uni-lj.si
bResearch Institute for Sustainable Chemistry, National Institute of Advanced Industrial Science and Technology (AIST), 1-1-1 Higashi, Tsukuba 305-8565, Japan. E-mail: fukuda.jun-ichi@aist.go.jp
cJozef Stefan Institute, Jamova 39, 1000 Ljubljana, Slovenia
First published on 17th September 2015
Abstract
Cholesteric blue phases of a chiral liquid crystal are interesting examples of self-organised three-dimensional nanostructures formed by soft matter. Recently it was demonstrated that a polymer matrix introduced by photopolymerization inside a bulk blue phase not only stabilises the host blue phase significantly, but also serves as a template for blue phase ordering. We show with numerical modelling that the transfer of the orientational order of the blue phase to the surfaces of the polymer matrix, together with the resulting surface anchoring, can account for the templating behaviour of the polymer matrix inducing the blue phase ordering of an achiral nematic liquid crystal. Furthermore, tailoring the anchoring conditions of the polymer matrix surfaces can bring about orientational ordering different from those of bulk blue phases, including an intertwined complex of the polymer matrix and topological line defects of orientational order. Optical Kerr response of templated blue phases is explored, finding large Kerr constants in the range of K = 2–10 × 10−9 m V−2 and notable dependence on the surface anchoring strength. More generally, the presented numerical approach is aimed to clarify the role and actions of templating polymer matrices in complex chiral nematic fluids, and further to help design novel template-based materials from chiral liquid crystals.
1 Introduction
Soft materials including polymers, liquid crystals, colloids and amphiphiles are promising candidates for bottom-up nanotechnology because many of them self-assemble to form nanostructures with specific ordering and periodicity. One notable example is cholesteric blue phases (BPs) exhibited by liquid crystals with strong chirality.1–3 Cholesteric BPs are three-dimensionally ordered phases comprising a complex network of topological line defects of orientational order (disclination lines), and orientational structures known as the double-twist cylinders in which twist distortions are present along all directions perpendicular to the cylinder axis. Three thermodynamically stable cholesteric BPs are known between the high-temperature isotropic phase and the low-temperature chiral nematic (or cholesteric) phase. Two BPs known as BP I and BP II possess cubic symmetry, whereas the third BP (BP III) is believed to be amorphous.4 The lattice constant of cubic BPs is typically a few hundred nanometres, on the order of the wavelength of visible light. Owing to this periodic ordering, cholesteric BPs have attracted considerable interest as photonic materials; their photonic band structures were discussed theoretically,5–7 and lasing in cholesteric BPs has been reported.8,9Liquid crystals are important components of current display and beyond-the-display technology.10 The relevance of blue phases as optical materials rose with the development of wide-temperature range blue phase materials, firstly in 2002 by introducing a photo-polymerised polymer matrix into blue phases,11 and later in 2005 by developing blue phase bi-mesogenic materials.12 Optical switching modes and photonic applications of blue phases are now being developed, including optical filters, optical attenuators, phase modulators, tunable lenses, and laser sources.13–18 And in all these applications, the major approach for stabilising and realising optical and photonic elements from blue phases is by polymer/particle doping19–21 and by photopolymerisation.22,23
Recently, it was demonstrated experimentally24–26 that the polymer matrix introduced into a cholesteric BP could serve as a template for BP ordering of an achiral nematic liquid crystal that cannot exhibit cholesteric BPs by itself. Templated BPs of an achiral liquid crystal are advantageous over conventional BPs as they allow for use of already developed far more diverse and superior-property materials (i.e. chemical compounds), since the complex three-dimensional ordering of the phase is assured by the template matrix and not by the molecular details of the liquid crystalline fluid. For example, for blue phase display applications, high dielectric anisotropy and low viscosity materials are desirable as they assure low operating voltage and fast switching times, but it is not easy to design liquid crystals that meet these criteria and simultaneously exhibit BPs. And, templated blue phases of achiral nematics can easily achieve both. Therefore, understanding the response of BPs to doping is not only scientifically but also technologically important. A semi-quantitative analysis showed that the stabilisation of BPs could be accounted for by the replacement of energetically costly disclination core regions by a polymer matrix.27 The templating behaviour strongly suggests that the BP ordering of the host liquid crystal is imposed by the surfaces of the polymer matrix via the surface anchoring mechanism. And the idea of this paper is to explore and demonstrate the role of different anchoring regimes that can be imposed by the polymer matrix on the host nematic fluid.
In this study, we explore the templated blue phases I and II infiltrated with an achiral nematic liquid crystal, considering three distinct (anchoring) regimes at the template matrix: (i) blue phase I or II surface memorised anchoring, (ii) homoeotropic (perpendicular) anchoring, and (iii) degenerate planar anchoring. By using numerical modelling based on the Landau-de Gennes free energy, we replace the liquid crystal regions with reduced orientational order – the defect lines – with the polymer matrix and explore how the surface anchoring imposed by the template matrices changes the orientational ordering of the nematic. We show that only sufficiently high surface anchoring interaction assures blue-phase-type orientational ordering, whereas weak surface anchoring results in homogeneous nematic-like profiles. We further demonstrate that matrix surfaces which impose homeotropic or degenerate planar anchoring give rise to intriguing disclination structures intertwined with the polymer matrix. The optic response of different templated blue phases is investigated by considering the electro-optic Kerr effect, where different regimes of macroscopic optical isotropy and anisotropy are observed. Characteristic Kerr constants are calculated, showing that they strongly depend on the type and strength of the surface anchoring of the template matrix.
2 Modelling and theory
Templated blue phases are distinct for their mesoscopic variation of molecular order, and a strong approach for modelling of such materials is by a phenomenological free energy minimisation technique.28–30 The local molecular order is described by nematic order parameter tensor Qij, which encompasses the general (chiral and achiral) orientational ordering of nematic molecules and the formation of topological defects, both central in the blue phase-based liquid crystalline materials. Tensorial invariants of Qij are used to construct the bulk free energy density of a chiral (blue phase) nematic fluid fB: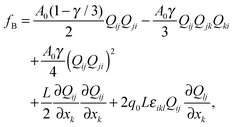 | (1) |
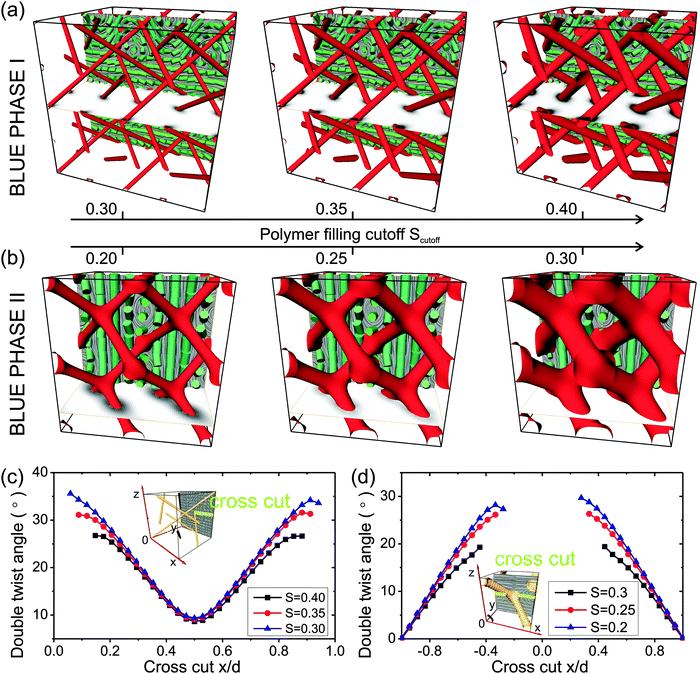
The templated blue phases are a hybrid material where both the template matrix and the nematic orientational profile need to be considered. We approach their structure by using a two stage calculation. In Stage 1, we first calculate the full equilibrium orientational profile of the bulk blue phase I or II (with no template) and then identify the blue phase defect regions as corresponding to the polymer template. The cut-off interface of the template is set by the isosurface of constant nematic degree of order (Scutoff) – see red regions in Fig. 1a and b. Such an allocation of the template can be justified in the view of recent experiments, where the polymers get attracted exactly into the defect regions to minimise the distorted volume of the chiral nematic, eventually forming the template.24,25,27 In Stage 2, the surface anchoring is implemented at the surface of the template, and the surrounding fluid is set as a regular (non-chiral) nematic by taking q0 = 0. Under these new boundary conditions, now imposed by the template matrix, and taking non-chiral nematic, the nematic Q tensor profile is again equilibrated.
The template matrix can impose two types of molecular alignment (anchoring) at the surface: (i) uniform alignment along one distinct direction such as perpendicular to the surface (homeotropic) or along the surface, and (ii) degenerate alignment within the surface plane. The anchoring is described by introducing uniform and degenerate surface free energy density at the matrix surface, funiS = Wuni(Qij − Q0ij)2/2 and fdegS = Wdeg(![[Q with combining tilde]](https://www.rsc.org/images/entities/i_char_0051_0303.gif) ij −
ij − ![[Q with combining tilde]](https://www.rsc.org/images/entities/i_char_0051_0303.gif) ⊥ij)2, respectively. Here, Q0ij is the surface imposed nematic order parameter tensor and projected tensors
⊥ij)2, respectively. Here, Q0ij is the surface imposed nematic order parameter tensor and projected tensors ![[Q with combining tilde]](https://www.rsc.org/images/entities/i_char_0051_0303.gif) ij and
ij and ![[Q with combining tilde]](https://www.rsc.org/images/entities/i_char_0051_0303.gif) ⊥ij are defined according to ref. 31 and 32. In the following, three distinct surface alignment regimes will be considered, as most relevant for typical experimental regimes: (i) uniform inplane anchoring with memorised blue phase director pattern, (ii) uniform homeotropic anchoring and (iii) degenerate planar anchoring. For the uniform inplane anchoring with memorised blue phase, we take the director of the non-templated blue phase (as calculated in Stage 1 of the calculation) and use it as the easy-direction of the uniform anchoring implemented through the anchoring tensor Q0ij. Actually, it is exactly this blue phase memorised uniform inplane anchoring which seems the most desirable in the view of applications of the templated blue phases, as it effectively fully retains the optical properties of un-templated blue phases. Finally, more generally, it is important to notice that the three anchoring regimes correspond to three very different templated blue phase materials, each with different mesophase and optical properties.
⊥ij are defined according to ref. 31 and 32. In the following, three distinct surface alignment regimes will be considered, as most relevant for typical experimental regimes: (i) uniform inplane anchoring with memorised blue phase director pattern, (ii) uniform homeotropic anchoring and (iii) degenerate planar anchoring. For the uniform inplane anchoring with memorised blue phase, we take the director of the non-templated blue phase (as calculated in Stage 1 of the calculation) and use it as the easy-direction of the uniform anchoring implemented through the anchoring tensor Q0ij. Actually, it is exactly this blue phase memorised uniform inplane anchoring which seems the most desirable in the view of applications of the templated blue phases, as it effectively fully retains the optical properties of un-templated blue phases. Finally, more generally, it is important to notice that the three anchoring regimes correspond to three very different templated blue phase materials, each with different mesophase and optical properties.
The optical response of the templated blue phases to an external electric field – the Kerr effect – is determined by calculating the Kerr constant K.33,34 The coupling between the nematic orientational profile and the external electric field Ei is incorporated via the dielectric free energy volume density fdiel = −ε0εmicaEiQijEj/3, where εmica is the low-frequency microscopic nematic dielectric anisotropy. Effectively, the Kerr constant measures the emergent macroscopic birefringence Δn of the material and characterises the average optical response of typically multiple blue phase cells (Δn is not (!) the difference between the ordinary and extraordinary refractive index). In the Kerr effect, the birefringence is proportional to the square of the electric field E, as:
| Δn = λKE2 | (2) |
 | (3) |
![[small epsilon, Greek, macron]](https://www.rsc.org/images/entities/i_char_e0c6.gif) is the average dielectric permittivity, εmola = εmol‖ − εmol⊥ is the molecular dielectric anisotropy at optical frequencies, and the integration is performed over the whole volume V of the unit cell of the templated blue phase. The average dielectric permittivity tensor
is the average dielectric permittivity, εmola = εmol‖ − εmol⊥ is the molecular dielectric anisotropy at optical frequencies, and the integration is performed over the whole volume V of the unit cell of the templated blue phase. The average dielectric permittivity tensor ![[small epsilon, Greek, macron]](https://www.rsc.org/images/entities/i_char_e0c6.gif) ij is then diagonalised, and the difference between the (square-rooted) eigenvalues corresponds to the macroscopic birefringence Δn. Notably, we should comment that for some specific BP templated structures under the electric field (with homeotropic and planar degenerate anchoring) we observe also that all three eigenvalues of the average permittivity tensor become nondegenerate, indicating biaxial optical response rather than the uniaxial Kerr effect. Also, we should comment that Pockels effect was observed in some templated blue phase systems, i.e. linear dependence of induced birefringence on external electric field.23
ij is then diagonalised, and the difference between the (square-rooted) eigenvalues corresponds to the macroscopic birefringence Δn. Notably, we should comment that for some specific BP templated structures under the electric field (with homeotropic and planar degenerate anchoring) we observe also that all three eigenvalues of the average permittivity tensor become nondegenerate, indicating biaxial optical response rather than the uniaxial Kerr effect. Also, we should comment that Pockels effect was observed in some templated blue phase systems, i.e. linear dependence of induced birefringence on external electric field.23
The following numerical parameters are used in calculations. In Stage 1, to generate the blue phase template matrices, we use single elastic constant L = 2.5 × 10⁻¹¹ N, nematic bulk material parameter A0 = 1.02 × 10⁻⁵ J m−3, and (p0 = 0.651 μm, γ = 3.857) for BP I and (p0 = 0.590 μm, γ = 3) for BP II, which corresponds to equilibrium unit cell size of aBPI = 680 nm for BP I and aBPII = 360 nm for BP II. These values are kept the same in all calculations. In Stage 2, to calculate the orientational profile of (achiral) nematic templated blue phases, we use single elastic constant L = 2.5 × 10⁻¹¹ N, nematic bulk material parameter A0 = 1.02 × 10⁻⁵ J m−3, q0 = 0, and γ = 3.857 for templated BP I and γ = 3 for templated BP II. For Kerr constant calculations, the electric field is applied along the vertical principal unit cell direction (i.e. along the edge of the unit cell, z direction) and material parameters εmica = 10, ![[small epsilon, Greek, macron]](https://www.rsc.org/images/entities/i_char_e0c6.gif) = 2.46, and εmola = 1.07 are used. The parameter values are chosen to correspond to typical values of an achiral nematic such as 5CB and the typical value of cubic blue phases I and II.
= 2.46, and εmola = 1.07 are used. The parameter values are chosen to correspond to typical values of an achiral nematic such as 5CB and the typical value of cubic blue phases I and II.
3 Results
3.1 Templated blue phases with blue phase memorised surface anchoring
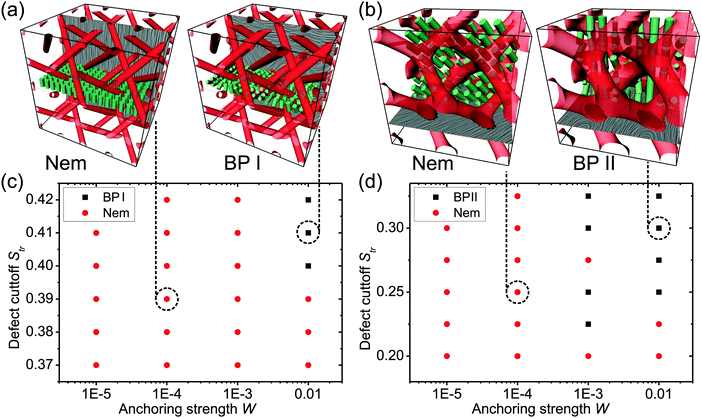
The two main variabilities of templated blue phases are their polymer filling fraction and the polymer matrix-to-liquid crystal interaction, i.e. the surface anchoring at the matrix surface. Fig. 1 and 2 show the (nonchiral) nematic profiles stabilised by the memorised anchoring of BP I and BP II at the polymer matrix surfaces. In both nematic templated blue phase I and blue phase II, the three-dimensional profile of (achiral) nematic almost perfectly reproduces the three-dimensional orientational director pattern of (chiral) blue phases with no template. For example, in Fig. 1a and b, one can clearly find the well known stacks of double-twist cylinders characteristic for blue phases, but now importantly formed by achiral nematic under the confinement of the polymer matrix. The exact polymer filling cut-off value – effectively, the thickness of the templated network – is also observed to have only a small effect on the actual director profile of the double twist cylinders which roughly remain of the same profile (Fig. 1c and d).The nematic profile within templated blue phases with blue phase memorised surface anchoring exhibits two distinct ordering regimes (i.e. two ordering states) depending on the polymer filling cut-off and the anchoring strength at the nematic-to-polymer–matrix interface, as shown in Fig. 2. At higher anchoring strengths, the BP-like profiles are imposed by the memorised surface anchoring. However, if the anchoring is rather weak, the nematic ignores the template surface imposed pattern and aligns into a homogeneous director state with regions of reduced degrees of order close to surfaces with conflicting alignment. Such confinement-induced transitions into a homogeneous director state are well known, e.g. from nematic droplets35 where bulk nematic elasticity (scales as ∝R, where R is the droplet size) overcomes the surface anchoring effects (scale as ∝R2) in small droplets (R → 0).
3.2 Templated blue phases with homeotropic surface anchoring
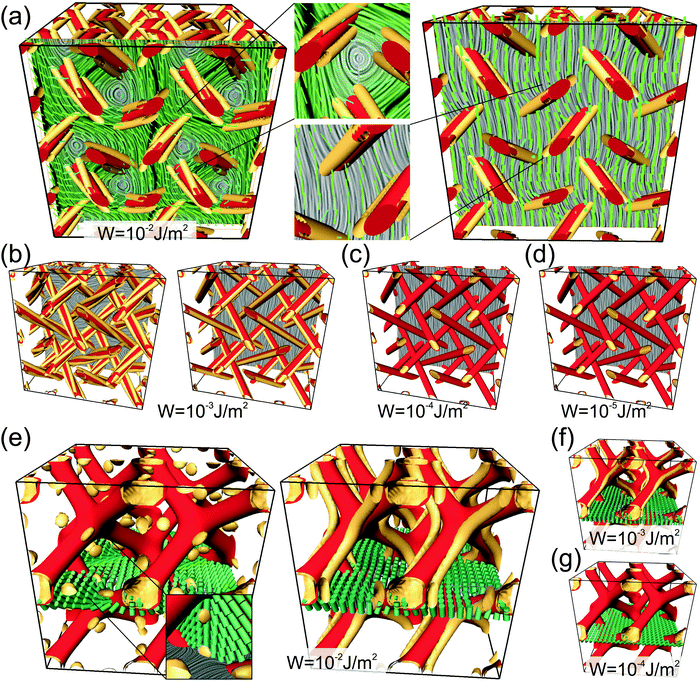
Nematic templated blue phases with homeotropic (perpendicular) surface anchoring at the nematic-to-template interface are explored as an idea to achieve novel optical response from the same templated material, changing only the functionalisation of the surface. The actual realisation of homeotropic anchoring at the interface between the template matrix and nematic could possibly be achieved by smart material design, including (i) the choice of material used to form the matrix, such as the type of polymer, (ii) the liquid crystal used to infiltrate the matrix, and (iii) the addition of material-compatible surfactants that impose homeotropic anchoring. Some of the above-mentioned approaches are reported in ref. 36–38.Fig. 3 shows nematic profiles formed within the homeotropic template of blue phase I (Fig. 3a–d) and of blue phase II (Fig. 3e–g). Notably, in templated blue phase I, at higher anchoring strengths, we observe a bistability of two patterns (Fig. 3a and b). The first pattern is reminiscent of the blue-phase director profile (Fig. 3a and b, left panel), whereas the second corresponds to a homogeneously aligned nematic perturbed with the presence of the template (Fig. 3a and b, right panel). The characteristic fingerprint of these two patterns is a trio – for blue phase-like – or a pair – for nematic-like – of −1/2 disclination lines which encircle the template network.
In templated blue phase II, we also see the formation of two distinct nematic profiles: (i) profile with bulk point defects (Fig. 3e, left panel) and (ii) structure with a pair of defect lines following the template (Fig. 3e, left panel). Their emergence and (meta)stability is strongly dependent on the anchoring strength. The profile with point defects is characterised by strong 3D variation of the nematic director, whereas the profile with a pair of disclinations exhibits an aligned (homogeneous-like) director which is perturbed by the template surface. The rough aligning direction is observed to typically coincide with the symmetry directions of the template matrix (e.g. see Fig. 3e), i.e. such as along the edge of the unit cell cube.
The distinct number of defect lines compensating for the homeotropic profiles imposed by the blue phase I and blue phase II templates is conditioned by the topology of the general nematic field (reminiscent of far-field). As the general topology of three-dimensional nematic fields of blue phase-like pattern is difficult to determine because of unclosed defect networks, simple observations based on the winding number invariant in distinct geometrical cross-sections (i.e. planes) can be made (for more on topology of nematics, please see ref. 39). For the nematic-like profile, the director is topologically equivalent to a homogeneous far field; thus locally two winding number −1/2 disclinations are needed to compensate for the surface-imposed pattern which is equivalent to a +1 disclination. Differently, in the regimes with three −1/2 disclinations, the defect lines compensate not only for the distortion imposed by the template (of +1 winding number) but effectively, also the profile imposed by the double twist cylinders, which – although not having a singular director – are equivalent to +1 defect lines.
3.3 Templated blue phases with degenerate planar surface anchoring
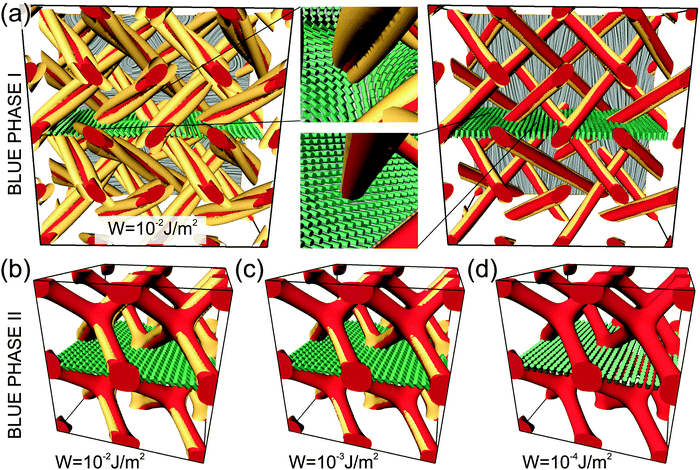
As the third experimentally relevant surface functionalisation we consider templated blue phases with planar degenerate surface anchoring. Again, similarly as for homeotropic templated blue phases, such inplane anchoring could emerge or be created by smart selection of LC, matrix materials, and surfactants.Nematic profiles of templated blue phases with degenerate planar anchoring are shown in Fig. 4. For the blue phase I template, we observe a trio or a pair of surface defect lines (Fig. 4a left and right, respectively), which topologically, are generalisation of boojum defects. In order to compensate for the director variation imposed by the double twist cylinders, the relative angle of the surface defect trio is rotated by an angle of 60° and for the pair of defect lines by an angle of 90° as compared to the defect positions of the bulk disclinations in homeotropic templated blue phases (Fig. 3). For the blue phase II template with planar anchoring (Fig. 4b–d), a roughly homogeneous nematic profile is observed which is perturbed by the surface. Notably, for the blue phase II template, the general director direction within the unit cell is always aligned along one of the template arms (i.e. along the body diagonal of the unit cell cube, see green cylinders in Fig. 4b) in order to minimise the nematic distortion. Namely, such a director orientation allows for the template arms which are parallel to the director to be free of surface defects.
3.4 Kerr effect of templated blue phases
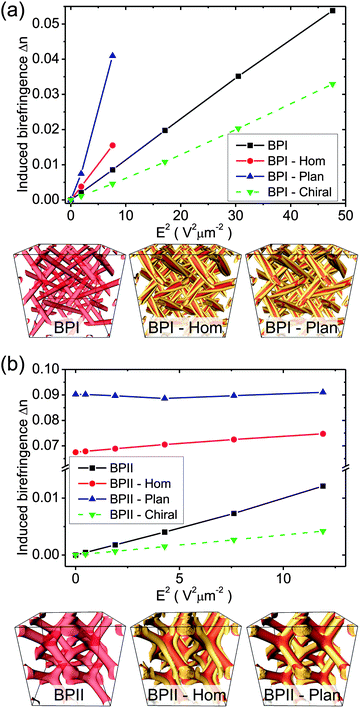
A major interest in blue phases is for their application as optical materials, in particular as materials with a large Kerr effect.40,41 Therefore, the presented templated blue phases are analysed in the view of their Kerr response, i.e. we calculate their induced birefringence Δn upon applying an external electric field. The homogeneous electric field is applied along the direction of the vertical edge of the cubic unit cell (z direction, see Fig. 5).
Fig. 5 shows the Kerr response of templated blue phases for all three types of their surface anchoring: (i) blue phase memorised surface anchoring (Section 3.1), (ii) homeotropic anchoring (Section 3.2), and (iii) degenerate planar anchoring (Section 3.3). For templated blue phase I (Fig. 5), linear dependence of induced birefringence Δn on the square of electric field (E2) is observed, indicating the Kerr behaviour. The following Kerr constants (for the wavelength of light λ = 500 nm) are extracted: KBP![[thin space (1/6-em)]](https://www.rsc.org/images/entities/char_2009.gif) I = 2.28 × 10⁻⁹ m V−2, KBP
I = 2.28 × 10⁻⁹ m V−2, KBP![[thin space (1/6-em)]](https://www.rsc.org/images/entities/char_2009.gif) I
I![[thin space (1/6-em)]](https://www.rsc.org/images/entities/char_2009.gif) Hom = 4.08 × 10⁻⁹ m V−2 and KBP
Hom = 4.08 × 10⁻⁹ m V−2 and KBP![[thin space (1/6-em)]](https://www.rsc.org/images/entities/char_2009.gif) I
I![[thin space (1/6-em)]](https://www.rsc.org/images/entities/char_2009.gif) Plan = 10.98 × 10⁻⁹ m V−2. These values are notably larger as compared to the Kerr constant of templated blue phase I with memorised blue phase I anchoring and infiltrated with chiral nematic KBP
Plan = 10.98 × 10⁻⁹ m V−2. These values are notably larger as compared to the Kerr constant of templated blue phase I with memorised blue phase I anchoring and infiltrated with chiral nematic KBP![[thin space (1/6-em)]](https://www.rsc.org/images/entities/char_2009.gif) I
I![[thin space (1/6-em)]](https://www.rsc.org/images/entities/char_2009.gif) chiral = 1.38 × 10⁻⁹ m V−2 (green dashed line in Fig. 5a), indicating that the effectively larger rigidity of chiral nematic allows only for relatively weaker optical response upon the applied external field. For templated blue phase II, the calculations of the effective (induced) birefringence reveal that both the two stable homeotropic- and planar-anchoring structures (see bottom panels in Fig. 5) are optically anisotropic, even at the zero external electric field. This inherent effective macroscopic optical anisotropy (averaged over the whole unit cell) originates from the actual structure of the nematic profile. In contrast, the templated profile with blue phase II memorised surface profile gives clear Kerr response with a Kerr constant of KBPII = 2.02
chiral = 1.38 × 10⁻⁹ m V−2 (green dashed line in Fig. 5a), indicating that the effectively larger rigidity of chiral nematic allows only for relatively weaker optical response upon the applied external field. For templated blue phase II, the calculations of the effective (induced) birefringence reveal that both the two stable homeotropic- and planar-anchoring structures (see bottom panels in Fig. 5) are optically anisotropic, even at the zero external electric field. This inherent effective macroscopic optical anisotropy (averaged over the whole unit cell) originates from the actual structure of the nematic profile. In contrast, the templated profile with blue phase II memorised surface profile gives clear Kerr response with a Kerr constant of KBPII = 2.02![[thin space (1/6-em)]](https://www.rsc.org/images/entities/char_2009.gif) ×
×![[thin space (1/6-em)]](https://www.rsc.org/images/entities/char_2009.gif) 10−9 m V−2. The Kerr constant of the templated blue phase II with blue phase II memorised surface profile and infiltrated with chiral nematic is calculated to be KBPII = 0.707
10−9 m V−2. The Kerr constant of the templated blue phase II with blue phase II memorised surface profile and infiltrated with chiral nematic is calculated to be KBPII = 0.707![[thin space (1/6-em)]](https://www.rsc.org/images/entities/char_2009.gif) ×
×![[thin space (1/6-em)]](https://www.rsc.org/images/entities/char_2009.gif) 10−9 m V−2 (slope of the green dashed line shown in Fig. 5b), again indicating that chiral nematic gives weaker optical response compared to achiral nematic when infiltrating templated blue phases. The calculated values of Kerr constants are in the range of the Kerr constants of non-templated standard blue phases – but interestingly somewhat larger. For example, Kerr constants of K = 3.7 × 10⁻¹⁰ m V−2
10−9 m V−2 (slope of the green dashed line shown in Fig. 5b), again indicating that chiral nematic gives weaker optical response compared to achiral nematic when infiltrating templated blue phases. The calculated values of Kerr constants are in the range of the Kerr constants of non-templated standard blue phases – but interestingly somewhat larger. For example, Kerr constants of K = 3.7 × 10⁻¹⁰ m V−2![[thin space (1/6-em)]](https://www.rsc.org/images/entities/char_2009.gif) 40 and K = 5 × 10⁻¹⁰ m V−2
40 and K = 5 × 10⁻¹⁰ m V−2![[thin space (1/6-em)]](https://www.rsc.org/images/entities/char_2009.gif) 42 are reported in the literature for polymer stabilised blue phases, and K = 10–100 × 10−10 m V−2
42 are reported in the literature for polymer stabilised blue phases, and K = 10–100 × 10−10 m V−2![[thin space (1/6-em)]](https://www.rsc.org/images/entities/char_2009.gif) 42 for amorphous blue phases.33 Our calculated results – i.e. the largest Kerr response for planar degenerate anchoring – could be interpreted from the perspective that planar degenerate anchoring allows for freedom in director rotations than memorised anchoring and homeotropic anchoring, which results in a larger Kerr constant in the BP I case, and larger spontaneous birefringence in the BP II case.
42 for amorphous blue phases.33 Our calculated results – i.e. the largest Kerr response for planar degenerate anchoring – could be interpreted from the perspective that planar degenerate anchoring allows for freedom in director rotations than memorised anchoring and homeotropic anchoring, which results in a larger Kerr constant in the BP I case, and larger spontaneous birefringence in the BP II case.
The optical response of templated blue phases is observed to also notably depend on the strength of the surface anchoring. Selected results are given in Table 1, where the surface anchoring strength W at the interface between the nematic and the template matrix is varied. As a general trend, we find that – if the selected blue phase pattern remains (meta)stable and does not decay into another lower free-energy structure when changing the anchoring (e.g. see phase diagrams in Fig. 2) – by decreasing the surface anchoring strength the Kerr constant increases. For example, in templated blue phase I with homeotropic anchoring, reducing the anchoring strength from W = 0.01 J m−2 to W = 0.001 J m−2 increases the Kerr constant by 20%. Similarly, in templated blue phase II with memorised blue phase II anchoring, the change in the anchoring strength from W = 0.01 J m−2 to W = 0.001 J m−2 increases the Kerr constant by 70%. In templated blue phases infiltrated with chiral nematic, even larger range of variability in the Kerr constants can be achieved via tuning the anchoring (see Table 1, BP I Chiral and BP II Chiral) because the structures are stable over a larger range of anchoring strengths. Qualitatively, the observed trend of increasing Kerr constants by reducing anchoring – under conditions that the blue phase patterns remain stable and do not transform into another pattern – could be explained by noticing that weaker anchoring effectively allows for stronger reorientations of the nematic – also close to the template surface. Therefore, when exposed to a given external electric field, larger optical response can emerge and in turn a larger Kerr constant.
| Templated blue phase | Anchoring strength (J m−2) | Kerr constant K (10−9 m V−2) |
|---|---|---|
| BP I Hom | 0.01 | 4.08 |
| 0.001 | 5.08 | |
| BP I Chiral | 0.01 | 1.38 |
| 0.001 | 1.73 | |
| 0.0001 | 2.58 | |
| BP II | 0.01 | 2.02 |
| 0.001 | 3.42 | |
| BP II Chiral | 0.01 | 0.71 |
| 0.001 | 0.92 | |
| 0.0001 | 1.35 | |
Finally, more broadly, we have demonstrated the possibility of enhancing the Kerr effect by modifying and optimising the type and strength of the surface anchoring as imposed by the templating polymer matrix.
4 Conclusion
In conclusion, templated nematic-filled cubic blue phases I and II with different surface functionalisation – blue phase memorised, homeotropic and degenerate planar – are explored, finding multiple optically different and distinct structures. For blue phase memorised surfaces, the nematic profiles emerge strongly similar to profiles of bulk (non-templated) blue phases. For homeotropic surfaces, structures with trios or pairs of bulk defect lines emerge. And for degenerate planar surfaces, surface defect lines are observed, which are topological generalisations of surface boojum defects. The stability and metastability of the structures are shown to be strongly dependent on the anchoring strength at the template–nematic interface. From a more broad perspective, the observed profiles are also interesting examples of complex topology, such as the coupled disconnected periodic surface and bulk defect patterns that could be used to explore the general properties of topology of fields.The different templated blue phases are shown to work as diverse optical Kerr materials, with Kerr constants of large typical values of K = 2–10 × 10−9 m V−2 for wavelength of light λ = 500 nm. The Kerr constants of selected blue phase profiles – if remaining (meta)stable – are shown to increase by decreasing the surface anchoring at the template–nematic interface. Selected profiles are also shown to inherently attain effective macroscopic optical anisotropy, the characteristic very different from typically expected blue phase-originating materials (that are macroscopically optically isotropic). More broadly, this work is motivated by designing novel optical anisotropy-based materials, and clearly already a simple variability in surface functionalisation of templated blue phases is shown to open a new route to novel fascinating optical soft materials.
Acknowledgements
The authors thank the Japan Society for the Promotion of Science (JSPS) whose Invitation Fellowship Program enabled M.R. to stay at National Institute of Advanced Industrial Science and Technology (AIST) and to initiate this work. J.F. is supported by JSPS Grant-in-Aid (KAKENHI) for Scientific Research (C) (Grant No. 25400437), and the Cooperative Research Program of “Network Joint Research Center for Materials and Devices”. M.R. also acknowledges funding from Slovenian Research Agency Programme P1-0099, research project Z1-5441 and EU FP7 MC CIG grant FREEFLUID.References
- D. C. Wright and N. D. Mermin, Rev. Mod. Phys., 1989, 61, 385 CrossRef CAS.
- P. P. Crooker, in Chirality in liquid crystals, ed. H.-S. Kitzerow and C. Bahr, Springer, Berlin, 2001, ch. 7 Search PubMed.
- H. Kikuchi, Struct. Bonding, 2008, 128, 99 CrossRef CAS.
- O. Henrich, K. Stratford, M. E. Cates and D. Marenduzzo, Phys. Rev. Lett., 2011, 106, 107801 CrossRef CAS.
- R. M. Hornreich, S. Shtrikman and C. Sommers, Phys. Rev. E: Stat. Phys., Plasmas, Fluids, Relat. Interdiscip. Top., 1993, 47, 2067 CrossRef CAS.
- Y. Ogawa, J. Fukuda, H. Yoshida, A. Fujii and M. Ozaki, Opt. Lett., 2013, 38, 3380 CrossRef PubMed; Y. Ogawa, J. Fukuda, H. Yoshida and M. Ozaki, Opt. Express, 2014, 22, 3766 CrossRef PubMed.
- M. Stimulak and M. Ravnik, Soft Matter, 2014, 10, 6339 RSC.
- W. Cao, A. Muñoz, P. Palffy-Muhoray and B. Taheri, Nat. Mater., 2002, 1, 111 CrossRef CAS PubMed.
- S. Yokoyama, S. Mashiko, H. Kikuchi, K. Uchida and T. Nagamura, Adv. Mater., 2006, 18, 48 CrossRef CAS PubMed.
- I. C. Khoo, Prog. Quantum Electron., 2014, 38, 77 CrossRef PubMed.
- H. Kikuchi, M. Yokota, Y. Hisakado, H. Yang and T. Kajiyama, Nat. Mater., 2002, 1, 64 CrossRef CAS PubMed.
- H. J. Coles and M. N. Pivnenko, Nature, 2005, 436, 997–1000 CrossRef CAS PubMed.
- T.-H. Lin, C.-W. Chen and Q. Li, Self-Organized 3D Photonic Superstructure: Blue Phase Liquid CrystalAnisotropic Nanomaterials: Preparation, Properties, and Applications, Springer International Publishing, 2015 Search PubMed.
- D. Xu, J. Yan, J. Yuan, F. Peng, Y. Chen and S. T. Wu, Appl. Phys. Lett., 2014, 105, 011119 CrossRef PubMed.
- Y. Liu, Y. Li and S. T. Wu, Appl. Opt., 2013, 52, 3216–3220 CrossRef PubMed.
- J.-M. Wong, J.-Y. Hwang and L.-C. Chien, Soft Matter, 2011, 7, 7956–7959 RSC.
- S. Hur, et al. , Adv. Mater., 2013, 25, 3002–3006 CrossRef CAS PubMed.
- L. Tian, et al. , Liq. Cryst., 2013, 40, 1446–1454 CrossRef CAS PubMed.
- H. Yoshida, Y. Tanaka, K. Kawamoto, H. Kubo, T. Tsuda, A. Fujii, S. Kuwabata, H. Kikuchi and M. Ozaki, Appl. Phys. Express, 2009, 2, 121501 CrossRef.
- M. Ravnik, G. P. Alexander, J. M. Yeomans and S. Zumer, Proc. Natl. Acad. Sci. U. S. A., 2011, 108, 5188 CrossRef CAS PubMed.
- L.-C. Chien, J. Y. Hwang and J.-M. Wong, Blue phase liquid crystal nanocomposites and devices containing the same, US Pat., 8580144, 2013 Search PubMed.
- D. Xu, F. Peng and S. T. Wu, Polymer-Stabilized Blue Phase Liquid Crystals, Handbook of Visual Display Technology, 2nd edn, 2015 Search PubMed.
- F. Castles, et al. , Nat. Mater., 2014, 13, 817–821 CrossRef CAS PubMed.
- F. Castles, et al. , Nat. Mater., 2012, 11, 599 CrossRef CAS PubMed.
- J. Xiang and O. D. Lavrentovich, Appl. Phys. Lett., 2013, 103, 051112 CrossRef PubMed.
- H. Kikuchi, S. Izena, H. Higuchi, Y. Okumura and K. Higashiguchi, Soft Matter, 2015, 11, 4572 RSC.
- J. Fukuda, Phys. Rev. E: Stat., Nonlinear, Soft Matter Phys., 2010, 82, 061702 CrossRef; J. Fukuda, Phys. Rev. E: Stat., Nonlinear, Soft Matter Phys., 2012, 86, 041704 CrossRef.
- P. G. de Gennes and J. Prost, The Physics of Liquid Crystals, Oxford University Press, Oxford, 2nd edn, 1993 Search PubMed.
- G. Alexander and J. Yeomans, Phys. Rev. E: Stat., Nonlinear, Soft Matter Phys., 2006, 74, 061706 CrossRef CAS.
- M. Ravnik, G. P. Alexander, J. M. Yeomans and S. Zumer, Faraday Discuss., 2010, 144, 159 RSC.
- J. Fournier and P. Galatola, Europhys. Lett., 2005, 72, 403 CrossRef CAS.
- M. Ravnik and S. Zumer, Liq. Cryst., 2009, 36, 1201 CrossRef CAS PubMed.
- K. V. Le, S. Aya, Y. Sasaki, H. Choi, F. Araoka, K. Ema, J. Mieczkowski, A. Jakli, K. Ishikawa and H. Takezoe, J. Mater. Chem., 2011, 21, 2855 RSC.
- M. Lee, S. Hur, H. Higuchi, K. Song, S. Choi and H. Kikuchi, J. Mater. Chem., 2010, 20, 5813 RSC.
- S. Kralj, S. Zumer and D. W. Allender, Phys. Rev. A: At., Mol., Opt. Phys., 1991, 43, 2943 CrossRef.
- A. Martinez, et al. , Nat. Mater., 2014, 13, 258–263 CrossRef CAS PubMed.
- G. Mirri, M. Skarabot and I. Musevic, Soft Matter, 2015, 11, 3347–3353 RSC.
- Y. Xia, F. Serra, R. D. Kamien, K. J. Stebe and S. Yang, Direct mapping of local director field of nematic liquid crystals, 2015 Search PubMed , submitted.
- G. P. Alexander, B. G. Chen, E. A. Matsumoto and R. D. Kamien, Rev. Mod. Phys., 2012, 84, 497 CrossRef CAS.
- Y. Hisakado, et al. , Adv. Mater., 2005, 17, 96 CrossRef CAS PubMed.
- L. Rao, et al. , Appl. Phys. Lett., 2011, 98, 081109 CrossRef PubMed.
- H. Tone, H. Yoshida, S. Yabu, M. Ozaki and H. Kikuchi, Phys. Rev. E: Stat., Nonlinear, Soft Matter Phys., 2014, 89, 012506 CrossRef.
| This journal is © The Royal Society of Chemistry 2015 |

