 Open Access Article
Creative Commons Attribution 3.0 Unported Licence
Novel AuPd nanostructures for hydrogenation of 1,3-butadiene†
Huimei
Chen
ab,
Jiale
Huang
*ac,
Dengpo
Huang
a,
Daohua
Sun
a,
Minhua
Shao
*c and
Qingbiao
Li
abd
aDepartment of Chemical and Biochemical Engineering, College of Chemistry and Chemical Engineering, Xiamen University, Xiamen 361005, PR China. E-mail: cola@xmu.edu.cn; kemshao@ust.hk; Fax: +86-592-2184822; Tel: +86-592-2183088
bEnvironmental Science Research Center, College of the Environment & Ecology, Xiamen University, Xiamen 361005, PR China
cDepartment of Chemical and Biomolecular Engineering, Hong Kong University of Science and Technology, Clear Water Bay, Hong Kong, PR China
dCollege of Chemistry & Life Science, Quanzhou Normal University, Quanzhou 362000, PR China
First published on 8th January 2015
Abstract
Exotic AuPd bimetallic nanoflowers (NFs) are facilely synthesized using a microorganism-mediated, cetyltrimethylammonium chloride (CTAC)-directed method at room temperature. The NFs consist of one-dimensional long pedicels and three-dimensional open horns. The effect of cell dosage and feed concentrations of ascorbic acid (AA), CTAC and metal precursors on the morphology of the bimetallic nanostructures were studied. The results showed that all the obtained materials were alloys with Pd-enriched surfaces. The diameters of the horns decreased, while those of the pedicels increased with increasing the feed concentration of Pd precursor. The presence of Pd precursor was vital for the formation of the nanowire part of the NF structure. Furthermore, the AuPd-NF/microorganism materials exhibited excellent catalytic performance and durability toward the hydrogenation of 1,3-butadiene.
Introduction
Metals have found extensive use in many diverse applications ranging from catalysis to electronics, photonics, information storage, sensing, imaging, medicine, and photography, as well as the generation, conversion, and storage of energy.1 With the development of nanotechnology, the fabrication of metal nanostructures that maximizes the surface area of metals with tunable shapes and properties has been intensively studied in the past decade.1,2 It has been thought that bimetallic nanostructures might outperform the corresponding monometallic nanostructures due to a synergetic effect in catalysis.2 At present, various methods, including co-reduction,2,3 pyrolysis,4 seed-mediated method,5 hydrothermal method,6 and galvanic replacement,7–9 have been developed for fabricating bimetallic nanostructures with various shapes.2,3,6,7,9–14 However, shape control of bimetallic nanostructures based on a versatile strategy still remains challenging.The microbial biosynthesis of metal nanoparticles has been regarded as a novel and viable alternative to chemical and physical methods for the synthesis of metal nanostructures.15–17 It was thought that metal ions could be adsorbed and reduced by the microbial surface, resulting in very small nanoclusters that would gradually grow into metal nanoparticles over the microorganisms.17,18 However, the shape of the metal nanostructures could not be effectively controlled by microorganisms alone. Inspired by the wet chemical synthesis of tunable Au nanorods in the presence of Au seeds;19 herein, we tried a synthesis of microorganism-bound Au nanoparticles with very small size as seeds for the shape control of one-dimensional (1D) gold nanostructures at room temperature. Functional Au-nanowire/microorganism nanocomposites could be obtained with Pichia pastoris cells (PPCs) and Escherichia coli cells (ECCs) in the presence of hexadecyltrimethylammonium bromide (CTAB).20,21 Interestingly, using cetyltrimethylammonium chloride (CTAC) instead of CTAB, this approach could be expanded to the synthesis of chemically difficult-to-synthesize Au nanohorns (Au NHs).22,23 Therefore, the microorganism-mediated, surfactant-directed (MSD) synthesis has been proposed as a new method for the shape control of metal nanostructures at room temperature.
It is well known that binary metal ions can be simultaneously adsorbed by microorganisms. The nanoparticles formed by the reduction of microorganism-bound binary metal ions can act as nuclei for the growth of novel bimetallic nanostructures. The advantage of the MSD approach is that bimetallic nanostructures can be obtained in one pot at room temperature. Furthermore, the problem of metal leaching that occurs in galvanic replacement reactions for synthesizing bimetallic nanostructures can be circumvented. In addition, the bimetallic nanostructures can form application-oriented nano-composites with microorganisms. In terms of these factors, herein, we describe a proof of concept MSD approach to synthesize novel AuPd bimetallic nanoflowers (NFs) consisting of a one-dimensional pedicel and three-dimensional horn in this study. Such NFs have not been reported hitherto, partially due to the extreme difficulty in their synthesis by a pure chemical reduction method. The as-obtained AuPd-NF/microorganism nano-composites can be directly used as an efficient catalyst for the hydrogenation of 1,3-butadiene. This work opens a new avenue to the shape control of novel bimetallic nanostructures, and should find promising applications in catalysis.
Experimental section
Materials and methods
The same Pichia pastoris GS115 cell powder, which was used in our previous work, was employed in this work as well. Chloroauric acid (HAuCl4), palladium chloride (PdCl2), cetyltrimethylammonium chloride (CTAC) and ascorbic acid (AA) were all purchased from Sinopharm Chemical Reagent Co. Ltd. in China. Deionized (DI) water was used throughout this work.Preparation of AuPd bimetallic nanostructures
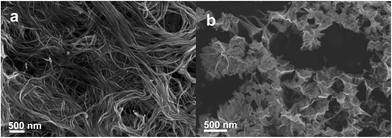
Three steps were adopted in a typical synthesis of AuPd bimetallic nanostructures. First, dried PPCs (0.005 or 0.01 g) were added to 10 mL of aqueous CTAC solution (1.0, 5.0, 10.0 or 15.0 mM) in a flask. Subsequently, aqueous HAuCl4 (48.6 mM, 0.0514 mL) and H2PdCl4 (0.05 M, 0.050 mL) solutions were added to the mixture. Finally, 0.05, 0.1 or 0.5 mL AA (0.1 M) was added to the mixture. The color of the solution turned from orange red to light orange immediately after adding the AA solution. The flask was then placed on a shaker (30 °C, 150 rpm) for 1–24 h. A few precipitates were observed at the bottom of the flasks after 0.5 h of reaction while the colour of the solution turned to black. The final AuPd/PPC samples were centrifuged at 2000 rpm for 10 min and dispersed in 200 μL of deionized water for further characterizations. It should be noted that the aqueous Au and Pd solutions were added into the mixture via three different modes. For Mode A, Au and Pd precursors were simultaneously added into the mixture, and then a 50 min interaction between the cells and metal ions was allowed before the addition of AA. For Mode B, Au precursor was added after the Pd precursor reacted for 50 min. Mode C was the reverse of Mode B.Characterizations of AuPd bimetallic nanostructures
Transmission electron microscopy (TEM) characterization was performed on an electron microscope (Tecnai F30, FEI; Netherlands) with an accelerating voltage of 300 kV. Scanning electron microscopy (SEM) samples of the suspension were fabricated by dropping the suspension onto a clean silicon wafer. SEM observations were carried out on a Hitachi S-4800 SEM system. The sizes of AuPd NFs were measured on the basis of the SEM images.24 After centrifugation, the precipitates were dried at 50 °C in vacuum and used for X-ray diffraction (XRD) and X-ray photoelectron spectroscopy (XPS) analysis, which were performed on a Rigaku Ultima IV X-ray Diffractometer (Rigaku, Japan) and a Quantum 2000 spectrometer using the Al-Kα line as the excitation source, respectively. The binding energy was calibrated by C 1s as the reference energy (C 1s = 284.8 eV). Supernatant solutions were decanted after removing the composites by centrifuging to analyze the Pd(II) and Au(III) concentrations using atomic absorption spectrophotometry (AAS) (Pgeneral, China). The compositions of Au and Pd in the obtained sample dissolved in aqua regia were also analyzed by AAS.Hydrogenation of 1,3-butadiene
The catalytic reactions were carried out at 35 °C in a 1 cm diameter fixed bed flow stainless reactor under atmospheric pressure using a feed concentration of 2.13% 1,3-butadiene, 4.29% H2, and 93.58% N2.25 The temperature was measured using a glass tube covered Cr–Al thermocouple located in the centre of the catalyst bed. The catalyst (15 mg of AuPd/PPC composites) was diluted with 50 mg of quartz sand before being loaded into the reactor with a space velocity of 9230 mL h−1 gcat.−1. The reactor effluent was analyzed online every 20 min within a 2 h period using a gas chromatograph (GC) equipped with an Al2O3 column and a FID detector. The conversion of 1,3-butadiene and its selectivity to butene (trans-2-butene, 1-butene, or cis-2-butene) or butane were calculated.Results and discussion
Synthesis and characterizations of AuPd bimetallic nanoflowers
![[thin space (1/6-em)]](https://www.rsc.org/images/entities/char_2009.gif) :
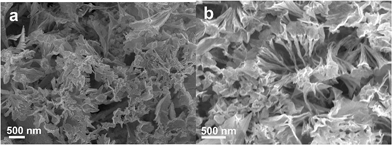
:![[thin space (1/6-em)]](https://www.rsc.org/images/entities/char_2009.gif) 1, Mode A and B) in the presence of AA (1.0 mM), PPCs (5 mg) and CTAC (5.0 mM). The diameters of the pedicels and horns were denoted as dp and dh, respectively. To the best of our knowledge, similar nanostructures have not been reported hitherto. On the basis of Mode A and B, the approximate dh of the as-synthesized NFs was ca. 0.26 ± 0.08 μm (Fig. S1 in ESI†). However, the dp of the NFs by Mode A (31.1 ± 6.9 nm) was considerably larger than that by Mode B (18.8 ± 4.6 nm) (Fig. S1†). As revealed by EDX spectra (Fig. S2†), the local Au/Pd ratio of the NFs was about 1.27. The overall Pd/Au atomic ratio was further determined to be ca. 0.80 by AAS analysis, lower than the initial ratio of 1.0 (Fig. S3†). The reduction potential of [AuCl4]−/Au ([AuCl4]−/Au = +1.002 V vs. standard hydrogen electrode (SHE)) was higher than that of [PdCl4]2−/Pd ([PdCl4]2−/Pd = +0.591 V vs. SHE).26 Thus, AuCl4− is easier to be reduced compared to [PdCl4]2−. As a result, ca. 20% Pd was left in the solution, which greatly reduced Pd leaching compared with galvanic replacement reaction. In contrast to Mode A and B, Mode C led to the formation of nanoparticles (NPs) (74.7 ± 8.8 nm, Fig. S4†) rather than NFs. To prepare the AuPd bimetallic NFs, further characterizations and synthetic study of the NFs were based on the facile Mode A.
1, Mode A and B) in the presence of AA (1.0 mM), PPCs (5 mg) and CTAC (5.0 mM). The diameters of the pedicels and horns were denoted as dp and dh, respectively. To the best of our knowledge, similar nanostructures have not been reported hitherto. On the basis of Mode A and B, the approximate dh of the as-synthesized NFs was ca. 0.26 ± 0.08 μm (Fig. S1 in ESI†). However, the dp of the NFs by Mode A (31.1 ± 6.9 nm) was considerably larger than that by Mode B (18.8 ± 4.6 nm) (Fig. S1†). As revealed by EDX spectra (Fig. S2†), the local Au/Pd ratio of the NFs was about 1.27. The overall Pd/Au atomic ratio was further determined to be ca. 0.80 by AAS analysis, lower than the initial ratio of 1.0 (Fig. S3†). The reduction potential of [AuCl4]−/Au ([AuCl4]−/Au = +1.002 V vs. standard hydrogen electrode (SHE)) was higher than that of [PdCl4]2−/Pd ([PdCl4]2−/Pd = +0.591 V vs. SHE).26 Thus, AuCl4− is easier to be reduced compared to [PdCl4]2−. As a result, ca. 20% Pd was left in the solution, which greatly reduced Pd leaching compared with galvanic replacement reaction. In contrast to Mode A and B, Mode C led to the formation of nanoparticles (NPs) (74.7 ± 8.8 nm, Fig. S4†) rather than NFs. To prepare the AuPd bimetallic NFs, further characterizations and synthetic study of the NFs were based on the facile Mode A.
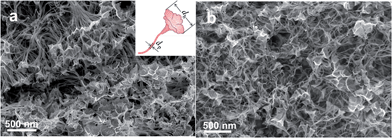 | ||
| Fig. 1 SEM images of AuPd bimetallic nanostructures with a flower-like structure synthesized through (a) Mode A and (b) Mode B. The inset in Fig. 1a indicates a model of AuPd flower-like structure. | ||
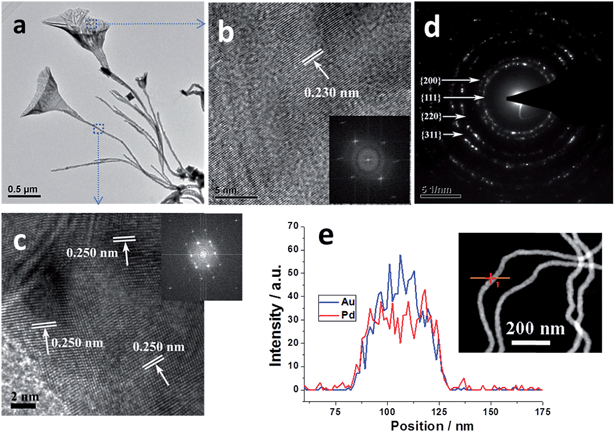
The AuPd NFs prepared on the basis of Mode A were further characterized by TEM, HRTEM, SAED and EDX line profiles. TEM image (Fig. 2a) indicates that the open nanohorns connected with thin pedicels to form a NF structure. HRTEM images (Fig. 2b and c) and the corresponding fast Fourier transform (FFT) pattern (insets in Fig. 2b and c) show that the corresponding blossom and pedicel are polycrystalline with well-defined lattice planes. The d-spacing of the blossom was about 0.230 nm, matching the in-between value of the face-centered cubic (fcc) Au(111) and Pd(111) planes.12,27 Another d spacing for the adjacent lattice fringes of the pedicel was 0.250 nm, which corresponds to the forbidden 1/3{422}.28 Moreover, the common (111) plane could be determined from the pedicel (Fig. S5†). The typical SAED pattern (Fig. 2d) from the AuPd NFs shows Bragg reflections of {111}, {200}, {220} and {311} of fcc AuPd. The EDX elemental line scanning of an individual AuPd nanowire (pedicel) (Fig. 2e) illustrates that they were composed of Au and Pd, demonstrating their bimetallic alloy nature. Subsequently, controlled experiments were further performed to study the effect of CTAC, AA and Pd concentrations, and cell dosage on the morphology of the AuPd NFs.
![[thin space (1/6-em)]](https://www.rsc.org/images/entities/char_2009.gif) :
:![[thin space (1/6-em)]](https://www.rsc.org/images/entities/char_2009.gif) Au ratio on the morphology of nanostructures was investigated. The Pd
Au ratio on the morphology of nanostructures was investigated. The Pd![[thin space (1/6-em)]](https://www.rsc.org/images/entities/char_2009.gif) :
:![[thin space (1/6-em)]](https://www.rsc.org/images/entities/char_2009.gif) Au ratio of X
Au ratio of X![[thin space (1/6-em)]](https://www.rsc.org/images/entities/char_2009.gif) :
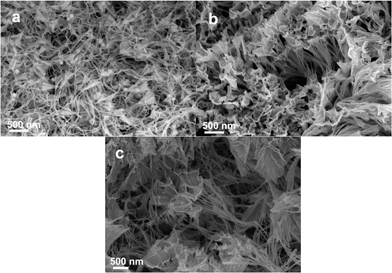
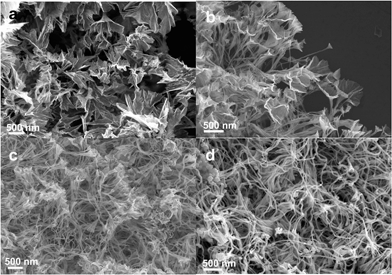
:![[thin space (1/6-em)]](https://www.rsc.org/images/entities/char_2009.gif) 5 (X = 1, 3, 5, 7, 9) was adjusted by changing the Pd precursor concentration while keeping the Au precursor concentration constant. Fig. 7 shows the SEM images of AuPd nanostructures synthesized at different Pd
5 (X = 1, 3, 5, 7, 9) was adjusted by changing the Pd precursor concentration while keeping the Au precursor concentration constant. Fig. 7 shows the SEM images of AuPd nanostructures synthesized at different Pd![[thin space (1/6-em)]](https://www.rsc.org/images/entities/char_2009.gif) :
:![[thin space (1/6-em)]](https://www.rsc.org/images/entities/char_2009.gif) Au ratios, apart from the Pd
Au ratios, apart from the Pd![[thin space (1/6-em)]](https://www.rsc.org/images/entities/char_2009.gif) :
:![[thin space (1/6-em)]](https://www.rsc.org/images/entities/char_2009.gif) Au ratio of 5
Au ratio of 5![[thin space (1/6-em)]](https://www.rsc.org/images/entities/char_2009.gif) :
:![[thin space (1/6-em)]](https://www.rsc.org/images/entities/char_2009.gif) 5 for Fig. 1a. When a small amount of Pd (Pd
5 for Fig. 1a. When a small amount of Pd (Pd![[thin space (1/6-em)]](https://www.rsc.org/images/entities/char_2009.gif) :
:![[thin space (1/6-em)]](https://www.rsc.org/images/entities/char_2009.gif) Au ratio = 1
Au ratio = 1![[thin space (1/6-em)]](https://www.rsc.org/images/entities/char_2009.gif) :
:![[thin space (1/6-em)]](https://www.rsc.org/images/entities/char_2009.gif) 5) was added, petals with rough multi-serrated-like nanobelts were obtained without pedicels (see Fig. 7a). Well-defined NFs structures with long thin pedicels were formed with increasing the Pd
5) was added, petals with rough multi-serrated-like nanobelts were obtained without pedicels (see Fig. 7a). Well-defined NFs structures with long thin pedicels were formed with increasing the Pd![[thin space (1/6-em)]](https://www.rsc.org/images/entities/char_2009.gif) :
:![[thin space (1/6-em)]](https://www.rsc.org/images/entities/char_2009.gif) Au ratio to 3
Au ratio to 3![[thin space (1/6-em)]](https://www.rsc.org/images/entities/char_2009.gif) :
:![[thin space (1/6-em)]](https://www.rsc.org/images/entities/char_2009.gif) 5 (see Fig. 7b). The morphology in Fig. 7b was very similar to that in Fig. 1 (Pd
5 (see Fig. 7b). The morphology in Fig. 7b was very similar to that in Fig. 1 (Pd![[thin space (1/6-em)]](https://www.rsc.org/images/entities/char_2009.gif) :
:![[thin space (1/6-em)]](https://www.rsc.org/images/entities/char_2009.gif) Au ratio = 5
Au ratio = 5![[thin space (1/6-em)]](https://www.rsc.org/images/entities/char_2009.gif) :
:![[thin space (1/6-em)]](https://www.rsc.org/images/entities/char_2009.gif) 5). When further increasing the Pd content, pedicel structures were still retained, while horn-like structures disappeared. Instead, nanoparticles or a two-dimensional broom at the end of wire appeared (see Fig. 7c and d). It was found that the diameters of the horns gradually decreased with increasing the Pd concentrations, i.e. dh were 0.69 ± 0.27 μm, 0.29 ± 0.09 μm and 0.24 ± 0.06 μm (see Fig. S9a–c†) corresponding to Fig. 7a–c, respectively. Conversely, the diameters of the nanowires increased from 27.8 ± 7.3 nm to 34.8 ± 5.5 nm (see Fig. S9d–f†). Therefore, the formation of nanowires was attributed to Pd in this system. In the previous report, Zhu et al. also demonstrated that Pd played a crucial role in forming the nanowire morphology in the alloy nanostructure.9
5). When further increasing the Pd content, pedicel structures were still retained, while horn-like structures disappeared. Instead, nanoparticles or a two-dimensional broom at the end of wire appeared (see Fig. 7c and d). It was found that the diameters of the horns gradually decreased with increasing the Pd concentrations, i.e. dh were 0.69 ± 0.27 μm, 0.29 ± 0.09 μm and 0.24 ± 0.06 μm (see Fig. S9a–c†) corresponding to Fig. 7a–c, respectively. Conversely, the diameters of the nanowires increased from 27.8 ± 7.3 nm to 34.8 ± 5.5 nm (see Fig. S9d–f†). Therefore, the formation of nanowires was attributed to Pd in this system. In the previous report, Zhu et al. also demonstrated that Pd played a crucial role in forming the nanowire morphology in the alloy nanostructure.9
To investigate the structures, valence states and elemental distributions of the prepared materials at different Pd![[thin space (1/6-em)]](https://www.rsc.org/images/entities/char_2009.gif) :
:![[thin space (1/6-em)]](https://www.rsc.org/images/entities/char_2009.gif) Au ratios, XRD, XPS and HAADF-STEM characterizations were carried out. The XRD results (see Fig. 8a) show that the diffraction peaks of different Pd
Au ratios, XRD, XPS and HAADF-STEM characterizations were carried out. The XRD results (see Fig. 8a) show that the diffraction peaks of different Pd![[thin space (1/6-em)]](https://www.rsc.org/images/entities/char_2009.gif) :
:![[thin space (1/6-em)]](https://www.rsc.org/images/entities/char_2009.gif) Au ratios are located between those of pure Au (pdf2 card: 00-002-1095) and Pd (pdf2 card: 01-087-0635), which can be indexed to the (111), (200) and (220) of the fcc structure of Au and Pd. The (111) diffraction peak exhibits a shift from pure Au to pure Pd with increasing the Pd content (see the inset of Fig. 8b). Also, a good linear relationship was found between the diffraction angles and the Pd mole fractions in Fig. 8b. According to Vegard's law, this linear relationship indicated that the prepared AuPd nanostructures were alloy and that the composition of each bimetallic nanostructure was proportional to that of the feeding solution.11,12,29
Au ratios are located between those of pure Au (pdf2 card: 00-002-1095) and Pd (pdf2 card: 01-087-0635), which can be indexed to the (111), (200) and (220) of the fcc structure of Au and Pd. The (111) diffraction peak exhibits a shift from pure Au to pure Pd with increasing the Pd content (see the inset of Fig. 8b). Also, a good linear relationship was found between the diffraction angles and the Pd mole fractions in Fig. 8b. According to Vegard's law, this linear relationship indicated that the prepared AuPd nanostructures were alloy and that the composition of each bimetallic nanostructure was proportional to that of the feeding solution.11,12,29
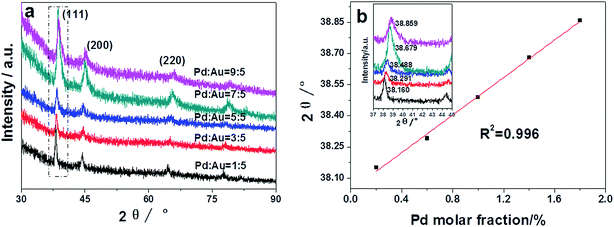 | ||
| Fig. 8 (a) XRD patterns and (b) (111) diffraction peak positions of the AuPd bimetallic nanostructures with different initial AuPd molar ratios. The inset in Fig. 8b shows the XRD patterns in Fig. 8a (rectangle dashed line). | ||
XPS was adopted to study the valence states and surface compositions of Au and Pd at different Pd![[thin space (1/6-em)]](https://www.rsc.org/images/entities/char_2009.gif) :
:![[thin space (1/6-em)]](https://www.rsc.org/images/entities/char_2009.gif) Au ratios. Fig. 9a shows the XPS peaks of Au(0) 4f7/2 and 4f5/2 for the PdAu nanostructures. The binding energies shift gradually to lower energies as the Pd content increases. Interestingly, the binding energies of Pd(0) 3d5/2 and 3d3/2 shift gradually to higher energies with increasing Pd content, as shown in Fig. 9b. The binding energies are summarized in Table S1.† The slight shifts in binding energy indicated the changes in the electronic properties of both Au and Pd on/near the surface of the NF materials, further verifying the formation of the alloy nanostructures.27,30 According to the XPS results, all the AuPd alloy nanostructures have Pd-enriched surfaces (see the last column in Table S1†). That is, the Pd
Au ratios. Fig. 9a shows the XPS peaks of Au(0) 4f7/2 and 4f5/2 for the PdAu nanostructures. The binding energies shift gradually to lower energies as the Pd content increases. Interestingly, the binding energies of Pd(0) 3d5/2 and 3d3/2 shift gradually to higher energies with increasing Pd content, as shown in Fig. 9b. The binding energies are summarized in Table S1.† The slight shifts in binding energy indicated the changes in the electronic properties of both Au and Pd on/near the surface of the NF materials, further verifying the formation of the alloy nanostructures.27,30 According to the XPS results, all the AuPd alloy nanostructures have Pd-enriched surfaces (see the last column in Table S1†). That is, the Pd![[thin space (1/6-em)]](https://www.rsc.org/images/entities/char_2009.gif) :
:![[thin space (1/6-em)]](https://www.rsc.org/images/entities/char_2009.gif) Au ratios of the surfaces were much higher than the actual ratios derived from the AAS measurements. Also, the actual Pd/Au ratio was lower than the theoretical one for each sample (see Fig. S3†). The formation of the Pd-enriched surface of the AuPd alloy nanostructures may be due to the different reduction rates of the Au(III) and Pd(II) species. Considering the reduction potential discussed above, it can be assumed that Au nuclei formed first, then followed up by adding Au and Pd atoms onto the nuclei,11 leading to alloy nanostructures with Pd-enriched surfaces being formed.
Au ratios of the surfaces were much higher than the actual ratios derived from the AAS measurements. Also, the actual Pd/Au ratio was lower than the theoretical one for each sample (see Fig. S3†). The formation of the Pd-enriched surface of the AuPd alloy nanostructures may be due to the different reduction rates of the Au(III) and Pd(II) species. Considering the reduction potential discussed above, it can be assumed that Au nuclei formed first, then followed up by adding Au and Pd atoms onto the nuclei,11 leading to alloy nanostructures with Pd-enriched surfaces being formed.
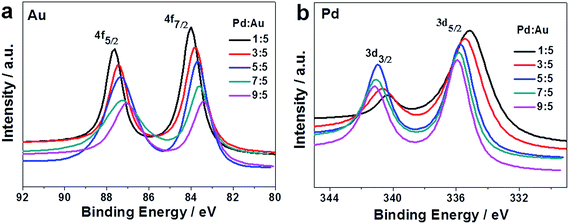 | ||
| Fig. 9 XPS patterns of (a) Au 4f and (b) Pd 3d of the AuPd alloy nanostructures with different initial AuPd molar ratios. | ||
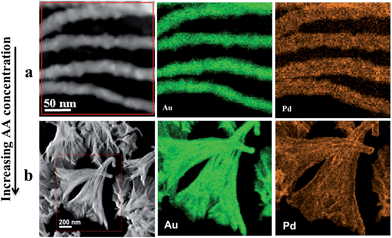
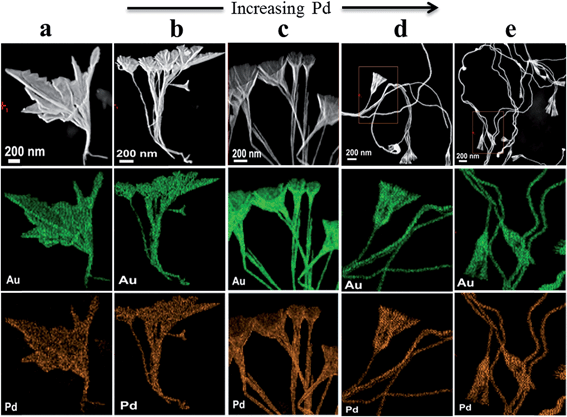
Fig. 10 shows STEM and STEM elemental mapping of AuPd alloy nanostructures at five Pd![[thin space (1/6-em)]](https://www.rsc.org/images/entities/char_2009.gif) :
:![[thin space (1/6-em)]](https://www.rsc.org/images/entities/char_2009.gif) Au ratios, which provide insights into both the morphology and distribution of Au and Pd with increasing Pd concentration. From left to right, shown in Fig. 10a–e are images of the nanostructures with increasing Pd content. From up to down, each colour picture represents the elemental mappings of one nanostructure. It can clearly be seen that, the elements Au (green) and Pd (orange) are uniformly dispersed in the nanostructures. Furthermore, the morphologies are consistent with the SEM results in Fig. 1a and 7.
Au ratios, which provide insights into both the morphology and distribution of Au and Pd with increasing Pd concentration. From left to right, shown in Fig. 10a–e are images of the nanostructures with increasing Pd content. From up to down, each colour picture represents the elemental mappings of one nanostructure. It can clearly be seen that, the elements Au (green) and Pd (orange) are uniformly dispersed in the nanostructures. Furthermore, the morphologies are consistent with the SEM results in Fig. 1a and 7.
Through careful time-resolved TEM studies, the probable growth mechanism of AuPd NFs on the basis of Mode A was studied. When HAuCl4 and PdCl2 were added in the CTAC and PPCs solution, the colour of the solution exhibited an orange red colour at the beginning due to the presence of ligand-substituted anions such as [AuCl4]−, [PdCl4]2−, CTA+–Au(III) or [PdCl4(CTA)2] complexes.31–33 Next, Pd(II) and Au(III) ions were both adsorbed on the cell surface. Fifty minutes of adsorption gave rise to a balanced adsorption rate of Pd(II) and Au(III) of ca. 66% and 37%, respectively (see Fig. S10†). In the meantime, PPCs and CTAC could act as mild reduction agents,17,34 leading to the colour change from orange red to orange, due to the reduction of Au(III) to Au(I). The Au(I) anions and Au(I)–CTAC complex were colourless,22 resulting in the lighter colour of the reaction solution. Upon the addition of AA, the colour of the solution changed to light orange immediately. As shown in Fig. 11a, there are some observable NPs on the cell surface before the addition of AA. It should be noted that CTAC was a very weak reductant at room temperature. Therefore, the NPs largely resulted from the reduction of metal ions with the cells.17,18 The nucleation of AuPd NPs grew quickly and nanowires (pedicels) appeared on the cell surfaces 5 min after the addition of AA. The nanowires preferred to grow at the junction of the two cells (see Fig. 11b). During this period, the colour of the solution changed from light pink to dark black, indicating that most of the Au ions were firstly reduced by PPCs and CTAC, while most of Pd ions were reduced by AA. EDX data showed that both NPs and nanowires contained both Au and Pd elements, and that the percentage Au was higher than that of Pd. The CTA+ was expected to adsorb onto the crystal nucleus and thus promote the anisotropic growth of nanostructures. After 15 min, the three-dimensional horn stretched on the cell surface and the pedicels became longer (see Fig. 11c) owing to the platforms of the PPCs for large-size nanostructures. It was noted that some AuPd NPs tended to adhere to the structures, and these NPs would be consumed via an Ostwald ripening mechanism later on during the formation of the AuPd NFs. With further growth, larger-size AuPd NFs were formed (see Fig. 11d). Eventually, after ∼1 hour, most of the nanostructures evolved into well-defined AuPd NFs (see Fig. 1a) through anisotropic growth with the assistance of CTAC and the Ostwald ripening of small AuPd NPs.
 | ||
| Fig. 11 AuPd nanostructures evolution at different times after the addition of AA: (a) 0 min, (b) 5 min, (c) 15 min and (d) 30 min. The synthesis condition was the same as in Fig. 1a. | ||
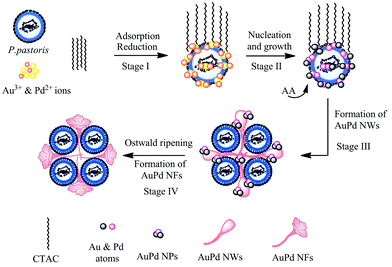
Based on the TEM images, we proposed schematic illustrations for the formation of AuPd NFs, as shown in Fig. 12. First, the interaction of the PPCs with Au(III) and Pd(II) ions for over 50 minutes led to a balanced adsorption of Au and Pd ions onto the PPCs (at Stage I), and some Au(III) were reduced to Au(I). Next, the addition of surplus AA resulted in a further reduction of the adsorbed Au(I) and Pd(II) to form AuPd nuclei, which acted as preferential nucleation sites for the formation of AuPd NPs on PPCs (at Stage II). Then, under the direction of CTAC, the anisotropic growth of AuPd NWs with bud-like structures at the end of wires was preferred (at Stage III). Finally, well-defined AuPd NFs were formed via an Ostwald ripening during the aging of the AuPd NFs (at Stage IV).
![[thin space (1/6-em)]](https://www.rsc.org/images/entities/char_2009.gif) :
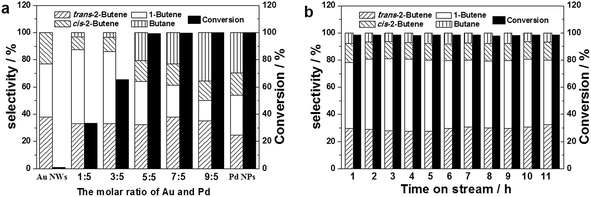
:![[thin space (1/6-em)]](https://www.rsc.org/images/entities/char_2009.gif) 3), the selectivity to total butene and single 1-butene could reach 96.5% and 50%, respectively, though the per-pass conversion efficiency was only 65.4%. However, by further increasing the Pd
3), the selectivity to total butene and single 1-butene could reach 96.5% and 50%, respectively, though the per-pass conversion efficiency was only 65.4%. However, by further increasing the Pd![[thin space (1/6-em)]](https://www.rsc.org/images/entities/char_2009.gif) :
:![[thin space (1/6-em)]](https://www.rsc.org/images/entities/char_2009.gif) Au ratio to 5
Au ratio to 5![[thin space (1/6-em)]](https://www.rsc.org/images/entities/char_2009.gif) :
:![[thin space (1/6-em)]](https://www.rsc.org/images/entities/char_2009.gif) 5, 7
5, 7![[thin space (1/6-em)]](https://www.rsc.org/images/entities/char_2009.gif) :
:![[thin space (1/6-em)]](https://www.rsc.org/images/entities/char_2009.gif) 5 and 9
5 and 9![[thin space (1/6-em)]](https://www.rsc.org/images/entities/char_2009.gif) :
:![[thin space (1/6-em)]](https://www.rsc.org/images/entities/char_2009.gif) 5, the conversion efficiency could reach 100%, and the selectivity to butene was slightly lower. The difference in the selectivity and conversion efficiency can be attributed to the shift of the Pd 3d binding energy of the NFs at different Pd
5, the conversion efficiency could reach 100%, and the selectivity to butene was slightly lower. The difference in the selectivity and conversion efficiency can be attributed to the shift of the Pd 3d binding energy of the NFs at different Pd![[thin space (1/6-em)]](https://www.rsc.org/images/entities/char_2009.gif) :
:![[thin space (1/6-em)]](https://www.rsc.org/images/entities/char_2009.gif) Au ratios (see Fig. 9b). Therefore, the catalytic performance was composition-dependent. Also, the electron density of Pd affected the catalytic performances.37,38 By optimizing the reaction conditions, the selectivity and conversion significantly improved, up to 92.6% and 98.4%, respectively (see Fig. S11†). Additionally, the stability of the AuPd NF catalysts was also evaluated and no loss in conversion or selectivity was observed within a time-on-stream of 11 h (see Fig. 13b). Therefore, the AuPd alloy NFs also possess the desired durability, in addition to excellent catalytic performance.
Au ratios (see Fig. 9b). Therefore, the catalytic performance was composition-dependent. Also, the electron density of Pd affected the catalytic performances.37,38 By optimizing the reaction conditions, the selectivity and conversion significantly improved, up to 92.6% and 98.4%, respectively (see Fig. S11†). Additionally, the stability of the AuPd NF catalysts was also evaluated and no loss in conversion or selectivity was observed within a time-on-stream of 11 h (see Fig. 13b). Therefore, the AuPd alloy NFs also possess the desired durability, in addition to excellent catalytic performance.
Conclusions
In summary, a simple microorganism-mediated, surfactant-directed (MSD) approach was developed to prepare the exotic and closely packed AuPd alloy nanoflowers with composition-dependent catalytic activity for 1,3-butadiene hydrogenation. The alloy structures were further confirmed by HAADF-STEM, EDX, XRD and XPS techniques. The shape of the AuPd alloy nanostructures was influenced by the cell dosages and AA and CTAC concentrations. In particular, CTAC and AA played critical roles in the morphology control. Moreover, the diameters of the pedicels increased, while those of the nanohorns decreased with increasing Pd content. In addition, the Pd element contributed to the formation of the nanowire morphology in the NF structures, and the obtained AuPd/microorganism materials possessed Pd-enriched surfaces. Importantly, the obtained AuPd NFs/microorganism materials exhibited excellent catalytic activity and durability for the hydrogenation of 1,3-butadiene.Acknowledgements
This work was supported by the NSFC projects (no. 21106117 and 21036004). J. H. is grateful to the Fujian Provincial Administration of Civil Service for the Fujian-Hong Kong joint postdoctoral fellowship. M.S. was supported by a startup fund from the Hong Kong University of Science and Technology.Notes and references
- Y. N. Xia, X. H. Xia, Y. Wang and S. F. Xie, MRS Bull., 2013, 38, 335–344 CrossRef CAS.
- B. H. Wu and N. F. Zheng, Nano Today, 2013, 8, 168–197 CrossRef CAS PubMed.
- D. S. Wang and Y. D. Li, Adv. Mater., 2011, 23, 1044–1060 CrossRef CAS PubMed.
- D. H. Sun, V. Mazumder, O. Metin and S. H. Sun, ACS Nano, 2011, 5, 6458–6464 CrossRef CAS PubMed.
- Y. Ding, F. R. Fan, Z. Q. Tian and Z. L. Wang, J. Am. Chem. Soc., 2010, 132, 12480–12486 CrossRef CAS PubMed.
- X. Q. Huang, H. H. Zhang, C. Y. Guo, Z. Y. Zhou and N. F. Zheng, Nanocubes, Angew. Chem., Int. Ed., 2009, 48, 4808–4812 CrossRef CAS PubMed.
- J. Y. Chen, B. Wiley, J. Mclellan, Y. J. Xiong, Z.-Y. Li and Y. N. Xia, Nano Lett., 2005, 5, 2058–2062 CrossRef CAS PubMed.
- X. W. Teng, Q. Wang, P. Liu, W. Q. Han, A. I. Frenkel, W. Wen, N. Marinkovic, J. C. Hanson and J. A. Rodriguez, J. Am. Chem. Soc., 2008, 130, 1093–1101 CrossRef CAS PubMed.
- C. Z. Zhu, S. J. Guo and S. J. Dong, Adv. Mater., 2012, 24, 2326–2331 CrossRef CAS PubMed.
- C. R. Ghosh and S. Paria, Chem. Rev., 2012, 112, 2373–2433 CrossRef PubMed.
- Y. W. Lee, N. H. Kim, K. Y. Lee, K. Kwon, M. Kim and S. W. Han, J. Phys. Chem. C, 2008, 112, 6717–6722 CAS.
- Y. W. Lee, M. Kim, Y. Kim, S. W. Kang, J.-H. Lee and S. W. Han, J. Phys. Chem. C, 2010, 114, 7689–7693 CAS.
- X. Q. Huang, Y. J. Li, Y. Chen, H. L. Zhou, X. F. Duan and Y. Huang, Angew. Chem., Int. Ed., 2013, 125, 6179–6183 CrossRef.
- S. E. Hunyadi and C. J. Murphy, J. Mater. Chem., 2006, 16, 3929–3935 RSC.
- D. T. Tran, I. P. Jones, J. A. Preece, R. L. Johnston, K. Deplanche and L. E. Macaskie, Nanotechnology, 2012, 23, 055701 CrossRef CAS PubMed.
- H. M. Chen, D. H. Sun, X. L. Jing, F. F. Lu, T. Odoom-Wubah, Y. M. Zheng, J. L. Huang and Q. B. Li, RSC Adv., 2013, 3, 15389–15395 RSC.
- L. Q. Lin, W. W. Wu, J. L. Huang, D. H. Sun, N. M. Waithera, Y. Zhou, H. T. Wang and Q. B. Li, Chem. Eng. J., 2013, 225, 857–864 CrossRef CAS PubMed.
- H. M. Chen, D. P. Huang, L. Q. Lin, T. Odoom-Wubah, J. L. Huang, D. H. Sun and Q. B. Li, J. Colloid Interface Sci., 2014, 433, 204–210 CrossRef CAS PubMed.
- N. R. Jana, L. Gearheart and C. J. Murphy, J. Phys. Chem. B, 2001, 105, 4065–4067 CrossRef CAS.
- M. Wang, T. Kong, X. L. Jing, Y. K. Hung, D. H. Sun, L. Q. Lin, Y. M. Zheng, J. L. Huang and Q. B. Li, Ind. Eng. Chem. Res., 2012, 51, 16651–16659 CrossRef CAS.
- H. X. Yang, M. M. Du, T. Odoom-Wubah, J. Wang, D. H. Sun, J. L. Huang and Q. B. Li, J. Chem. Technol. Biotechnol., 2014, 89, 1410–1418 CrossRef CAS.
- M. Wang, T. Odoom-Wubah, H. M. Chen, X. L. Jing, T. Kong, D. H. Sun, J. L. Huang and Q. B. Li, Nanoscale, 2013, 5, 6599–6606 RSC.
- X. L. Jing, D. P. Huang, H. M. Chen, T. Odoom-Wubah, D. H. Sun, J. L. Huang and Q. B. Li, J. Chem. Technol. Biotechnol., 2014, 90 DOI:10.1002/Jctb.4353.
- M. M. Du, G. W. Zhan, X. Yang, H. X. Wang, W. S. Lin, Y. Zhou, J. Zhu, L. Lin, J. L. Huang and D. H. Sun, et al. , J. Catal., 2011, 283, 192–201 CrossRef CAS PubMed.
- F. Lu, D. Sun, J. Huang, M. Du, F. Yang, H. Chen, Y. Hong and Q. Li, ACS Sustainable Chem. Eng., 2014, 2, 1212–1218 CrossRef CAS.
- Y. W. Lee, M. Kim, S. W. Kang and S. W. Han, Angew. Chem., Int. Ed., 2011, 123, 3528–3532 CrossRef.
- J. Chai, F. H. Li, Y. Hu, Q. X. Zhang, D. X. Han and L. Niu, J. Mater. Chem., 2011, 21, 17922–17929 RSC.
- M. Yamamoto, Y. Kashiwagi, T. Sakata, H. Mori and M. Nakamoto, Chem. Mater., 2005, 17, 5391–5393 CrossRef CAS.
- D. H. Sun, G. L. Zhang, X. D. Jiang, J. L. Huang, X. L. Jing, Y. M. Zheng, J. He and Q. B. Li, J. Mater. Chem. A, 2014, 2, 1767–1773 CAS.
- M. L. Wu, D. H. Chen and T. C. Huang, Langmuir, 2001, 17, 3877–3883 CrossRef CAS.
- K. Torigoe and K. Esumi, Langmuir, 1992, 8, 59–63 CrossRef CAS.
- Z. Khan, T. Singh, J. I. Hussain and A. A. Hashmi, Colloids Surf., B, 2013, 104, 11–17 CrossRef CAS PubMed.
- J. W. Zhang, L. Zhang, S. F. Xie, Q. Kuang, X. G. Han, Z. X. Xie and L. S. Zheng, Chem.–Eur. J., 2011, 17, 9915–9919 CrossRef CAS PubMed.
- Y. W. Lee, M. Kim, Z. H. Kim and S. W. Han, J. Am. Chem. Soc., 2009, 131, 17036–17037 CrossRef CAS PubMed.
- J. Goetz, M. Volpe, C. Gigola and R. Touroude, J. Catal., 2001, 199, 338–345 CrossRef CAS.
- A. Sarkany, Z. Zsoldos, G. Stefler, J. Hightower and L. Guczi, J. Catal., 1995, 157, 179–189 CrossRef CAS.
- A. L. Dantas Ramos, P. D. S. Alves, D. A. Aranda and M. Schmal, Appl. Catal., A, 2004, 277, 71–81 CrossRef CAS PubMed.
- J. C. Bertolini, P. Delichere, B. C. Khanra, J. Massardier, C. Noupa and B. Tardy, Catal. Lett., 1990, 6, 215–223 CrossRef CAS.
Footnote |
† Electronic supplementary information (ESI) available: The corresponding histograms of diameter distribution, SEM images, table of XPS peak positions, product conversion and selectivity in 1,3-butadiene hydrogenation, adsorption rates of Au and Pd (1![[thin space (1/6-em)]](https://www.rsc.org/images/entities/char_2009.gif) : :![[thin space (1/6-em)]](https://www.rsc.org/images/entities/char_2009.gif) 1) adsorbed by the PPCs. See DOI: 10.1039/c4ta06226d 1) adsorbed by the PPCs. See DOI: 10.1039/c4ta06226d |
| This journal is © The Royal Society of Chemistry 2015 |

