 Open Access Article
Creative Commons Attribution 3.0 Unported Licence
Low temperature synthesized carbon nanotube superstructures with superior CO2 and hydrogen storage capacity†
Beatrice
Adeniran
and
Robert
Mokaya
*
University of Nottingham, University Park, Nottingham NG7 2RD, UK. E-mail: r.mokaya@nottingham.ac.uk
First published on 26th January 2015
Abstract
Carbon nanotubes (CNTs) may be prepared at a low temperature of 180 °C using carbon tetrachloride as carbon source and ferrocene/Ni as substrate/catalyst. The lowly graphitic CNTs have diameter of 180–300 nm and wall thickness of ca. 25 nm and are arranged into closely networked superstructures with surface area and pore volume of 470 m2 g−1 and 0.39 cm3 g−1, respectively. On activation, the CNT superstructures yield highly porous CNT composites with surface area of 1479–3802 m2 g−1 and pore volume of 0.83–2.98 cm3 g−1. Mild activation generates highly microporous (≥95% microporosity) carbons that retain nanotubular morphology and which exhibit excellent CO2 uptake capacity; up to 4.8 mmol g−1 at 1 bar and 19.5 mmol g−1 at 20 bar and 25 °C, while at 0 °C they store 8.4 mmol g−1 and 25.7 mmol g−1 at 1 and 20 bar, respectively. More severe activation generates activated carbons with surface area and pore volume of up to 3802 m2 g−1 and 2.98 cm3 g−1, respectively, and which possess significant microporosity combined with mesoporosity resulting in exceptional total hydrogen storage of up to 7.5 wt% at −196 °C and 20 bar, rising to 9.7 wt% and 14.9 wt% at 40 bar and 150 bar, respectively, while at room temperature total uptake reaches 4.4 wt%. The porosity of the CNT superstructures can thus be tailored towards CO2 or hydrogen uptake applications.
1. Introduction
There has been continuous scientific and technological interest in carbon nanotubes (CNTs) over the past few years as a result of their remarkable chemical, physical and mechanical properties.1 CNTs may be prepared via several routes including arc-discharge evaporation,2 pyrolysis of hydrocarbons,3 or chemical vapour deposition (CVD).4 Synthesis using these methods affords CNTs with varying levels of crystallinity and graphitisation.2–4 A wide range of potential uses for CNTs in energy applications have been proposed including as electrode materials in supercapacitors5 and for hydrogen storage.6 However, although some early results suggested that CNTs could store large amounts of hydrogen under moderate pressure and room temperature,6 more consistent later studies have shown that the hydrogen storage capacity of CNTs at room or cryogenic temperature is very low, which prevents the practical application of CNTs in hydrogen storage.7,8 On the other hand, despite extensive on-going research efforts in CO2 capture and storage in porous materials, there are hardly any reports on the uptake of CO2 in CNTs and the few studies available are not encouraging.9 The meagre gas (hydrogen or CO2) uptake capacity of CNTs is due to low surface area (typically less than 800 m2 g−1) and poorly developed porous structure that covers a wide pore size distribution.10 Thus, it is of interest to modify the structure and porosity of CNTs in ways that may improve their performance in the storage of energy relevant gases.Several reports have suggested that the presence of defects on CNTs improves their gas storage capacity.11 Defects or cavities on CNT surfaces may not only represent entry points for gases and shorten the diffusion path, but also increase the surface area and pore volume of CNTs.11 One method that has been successfully used to create defects on the surface of nanocarbons is mechanical milling whereby Orimo and co-workers reported that the hydrogen storage capacity of nanostructured graphite prepared by mechanical milling increased with milling time.12 Liu and co-workers13 found that the hydrogen uptake of CNTs milled for 10 h increased by a factor of six to 0.66 wt% at room temperature and pressure of 80–90 bar. Other methods that have been employed to create defects on CNTs include oxidation by oxygen at high temperatures,14 oxidation by alkali-metals and chemical oxidation using nitric acid,15 hydrochloric acid16 and hydrogen peroxide.17 Modification of carbon materials by activation (chemical or physical) is a well-established method to generating highly porous carbons with high surface area and pore volume.18 Activation of CNTs can achieve porosity enhancement by opening the capped ends of individual CNTs and by generating micro cavities on the CNT walls. This is of interest as it is known that the gas storage properties of porous carbons are determined by the nature of the porosity (i.e., overall surface area and pore volume, and extent of micro or mesoporosity).19–21 Therefore, being able to modify or optimise the surface area of CNTs should improve their gas (CO2 and hydrogen) storage capacity. However, there are only a few reports wherein activation has been used to modify the porosity of CNTs.22–28 Available reports include activation of CNTs, which increased surface area from 407 to 650 m2 g−1 by Kim et al.,22 improved surface area of CNTs from 65 to 830 m2 g−1 and pore volume from 0.35 to 1.6 cm3 g−1, wherein most of the volume is in mesopores as observed by Niu et al.,23 and increase in surface area of up to 1670 m2 g−1 observed by Raymund-Piñero et al.24 Highly graphitic CNTs (so-called graphitised nanotubes, GNTs), which typically have surface area of ca. 20–30 m2 g−1 are difficult to activate and even when activated under fairly harsh conditions (at 900 °C and high activating agent/CNT ratio) only reach surface area of ca. 360 m2 g−1.26 Jiang and co-workers have also studied the chemical activation of CNTs with KOH and noted three-fold increase in surface area from 180 m2 g−1 to a modest 511 m2 g−1, while pore volume increased from 0.66 to 0.91 cm3 g−1.27 Heteroatom doping can also be used to improve the activation process as observed by Kim and Park, who prepared nitrogen-containing microporous carbon nanotubes via carbonization of polyaniline coated on silica nanotube composites and then, after silica etching, generated activated carbons with surface area of up to 1958 m2 g−1 compared to 217 m2 g−1 for the raw CNTs.28
Thus, only modest improvements in porosity have been achieved for activated CNTs and to date, there is no report of surface area above 2000 m2 g−1, which is the typical range for activated carbons.8 Raymundo-Piñero and co-workers found that the activation of CNTs with low crystallinity and less graphitisation (i.e., those synthesised at relatively low temperature) afforded the greatest increase in surface area. They concluded that it is possible to produce tubular carbons with varying degrees of crystallinity by modifying the synthesis temperature and that the structural organisation of the resulting carbon is an important parameter to consider when alkali reactants (e.g., KOH) are used as activating reagents.24 Shen et al.11b also observed the formation of CNTs with lower crystallinity at lower synthesis temperature and suggested that there is preferential gas (e.g. hydrogen) adsorption/storage on defects that exist in such lowly crystalline CNT walls. Thus, the chemical activation of carbon nanotube structures with purely (or very nearly) amorphous walls should result in the formation of highly activated carbon materials that may possess the advantages of conventional activated carbons but with preservation of the nanotubular structure. Since it is known that high temperatures generally lead to the formation of crystalline CNTs,29 low temperature synthesis is the best approach towards the synthesis of CNTs with lowly crystalline or amorphous walls. To this end, Bao and co-workers prepared poorly crystalline CNT bundles at 230 °C using hexachlorobenzene as the carbon source.30 Wang and co-workers synthesised multiwalled carbon nanotubes and carbon nanorods at 200 °C from tetrachloroethylene in the presence of metallic catalysts.31 Amorphous CNT bundles have also been prepared by using ferrocene in benzene or carbon tetrachloride via low (<210 °C) temperature synthesis routes.32,33 Herein we report on the preparation, activation and gas storage properties of CNT superstructures synthesised at low temperature. The hydrogen and CO2 uptake properties have been investigated and the trends in textural properties and gas uptake of the activated CNT superstructure are discussed.
2. Experimental section
2.1. Materials synthesis
(1) A portion of the as-synthesised CNT-as product was washed in 15.8 M HNO3 for 24 h in order to remove excess Ni. The resulting acid treated product was recovered by filtration and then washed with distilled water to give pristine CNTs designated as CNT-acid.
(2) A portion of the as-synthesised CNT-as product was washed in ethanol under vigorous stirring with a magnetic stirrer for 24 h. During the stirring, Ni stuck onto the magnetic stirrer and was thus removed leaving behind CNTs as the only solid in the ethanol. The CNTs were recovered by filtration and washed sequentially with ethanol and distilled water to give pristine CNTs designated as CNT-ethanol.
2.2. Material characterisation
Powder XRD patterns of the CNT samples were obtained on a Bruker D8 Advance powder diffractometer using CuKα radiation (λ = 1.5406 Å) and operating at 40 kV and 40 mA. Elemental composition was determined using a Perkin Elmer Optima 2000 DV ICP-OES instrument (metal content analysis), or a CHNS analyzer (Fishons EA 1108). Thermogravimetric analysis was performed on a TA Instruments SDT Q600 analyzer by applying a heating rate of 10 °C min−1 to 1000 °C under static air conditions. Porosity analysis and determination of textural properties was performed by measuring nitrogen sorption isotherms of the CNT samples at −196 °C on a Micromeritics ASAP 2020 sorptometer. Prior to analysis, the CNT samples were evacuated for 12 h at 200 °C under vacuum. The surface area was calculated using the Brunauer–Emmett–Teller (BET) method based on adsorption data in the relative pressure (P/Po) range 0.02 to 0.22. The total pore volume was calculated from the amount of the nitrogen adsorbed at P/Po = 0.99. Micropore surface area and micropore volume were obtained via t-plot analysis. The pore size distributions were obtained via a Non-Local Density Function Theory (NLDFT) method using nitrogen adsorption data. Scanning electron microscopy (SEM) images were recorded using FEI XL30 microscope. Samples were mounted using a conductive carbon double-sided sticky tape and a thin (ca. 10 nm) coating of gold–palladium sputter was deposited onto the samples to reduce the effects of charging. Transmission electron microscopy (TEM) images were obtained on a JOEL 2000-FX electron microscope operating at 200 kV. Small amounts of the sample (<2 mg) were prepared by ultrasonic dispersing of the powder products in ethanol, which was then deposited and dried on a holey carbon film on a copper supported grid.2.3. Gas uptake measurements
CO2 uptake measurements were performed over the pressure range of 0–20 bar on a Hiden intelligent gravimetric analyzer (IGA-003). The carbon samples were outgassed under vacuum at 250 °C before analysis. Then the CO2 uptake isotherms were measured at various temperatures between 0 and 75 °C in the pressure range 0–20 bar. CO2 uptake was also measured using a TA Instruments SDT Q600 analyzer at atmospheric pressure (1.0 bar). Prior to uptake measurements, the carbon samples were heated at a ramp rate of 10 °C min−1 to 250 °C and held for 2 h under a flow of nitrogen gas (flow rate of 50 mL min−1). Thereafter, the sample was allowed to cool down under nitrogen flow to 25 °C and held for 10 min. The uptake measurements were then done under a flow of CO2 (50 mL min−1). Between successive measurements, desorption of CO2 was undertaken by heating the sample to 250 °C under nitrogen gas flowing at a rate of 100 mL min−1.The hydrogen uptake capacity of the carbons was measured by gravimetric analysis with an IGA (Hiden) using 99.9999% purity hydrogen additionally purified by a molecular sieve filter. The hydrogen uptake measurements were performed at −196 °C (in a liquid nitrogen bath) over the pressure range 0 to 20 bar. The samples were outgassed (10−10 bar) under heating at 200 °C overnight before measurement. The hydrogen uptake data was rigorously corrected for the buoyancy of the system and samples. The carbon density used in the buoyancy corrections was determined from helium sorption data obtained using the IGA at a pressure of up to 20 bar at 273 K. The gravimetric measurement gave the excess hydrogen uptake. The total hydrogen uptake was calculated from the measured excess capacity by taking into account the pore volume of the samples and the density of compressed hydrogen at the prevailing temperature and pressure (see ESI†). In all cases the hydrogen uptake (excess or total) is reported as wt% of carbon sample weight.
3. Result and discussion
3.1. Structure and morphology of CNTs
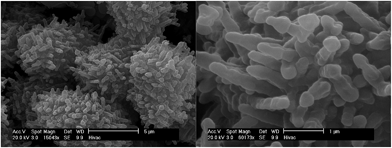
The carbon product yield of our low temperature catalytic reaction can be obtained by calculating the carbon deposit percentage as specified below:34where mcatafter is the mass of the catalyst after reaction, i.e. mass of catalyst + deposited carbon and mcatbefore is the mass of the catalyst initially introduced. Using this method, the product yield before purification was 39%, which is quite a high yield given the low synthesis temperature of 180 °C. To ascertain the morphology of the carbon yield, we obtained SEM and TEM images. The SEM images of the as-synthesised carbon sample (designated as CNT-as) in Fig. 1 show that the generated carbon nanotubes form a tangled and closely packed network that is interconnected or aggregated to form bundles of superstructures. Isolated nanotubes are seldom straight and are not aligned and the majority of the length of each tube is embedded in the tangled network. The surface of the nanotubes appears to be heavily textured with walls that appear to be thick. The tips of the nanotubes are predominantly closed.
The purity of the as-synthesised CNT-as sample, with respect to carbon content, was assessed by performing thermogravimetric analysis. The CNT-as was found to have a residual mass of ca. 20% after carbon burn off (ESI Fig. S1†). The residual mass is due to the presence of inorganic residues (e.g., nickel catalyst) in the sample. The XRD pattern of the as-synthesised (CNT-as) sample (ESI Fig. S1†) exhibits a broad peak at 2θ = 22, which is characteristic of turbostratic/graphitic carbon. The broadness and low intensity of the peak indicates that although the carbon nanotubes have a certain extent of graphitic structure, the walls of the nanotubes are dominated by amorphous carbon. The other peaks at 2θ = 44° and 52° arise from the residual nickel.35 The carbon content of the yield, as determined by elemental analysis is ca. 50 wt% with hydrogen making up ca. 1 wt%.
TEM images of individual nanotubes from sample CNT-as are shown in Fig. 2. The images show that the nanotubes are internally hollow with diameter ranging from 180 nm at the tip of the tubes and increasing to up to 300 nm at the base. The wall thickness is ca. 25 nm for a majority of the tubes. The nanotubes are not straight and this is reflected in the observed textured nature of their surface. It is possible to observe isolated CNTs that are up to 10 mm in length (Fig. 2a). Upon close examination of the nanotube walls, the layers of graphene that are characteristic of crystalline CNTs are not observed, thus confirming that the walls of the present nanotubes are highly disordered and amorphous in nature.
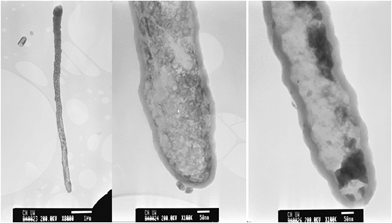 | ||
| Fig. 2 TEM images of as-synthesised (CNT-as) carbon nanotubes. The scale bar is 1 μm in (a) and 50 nm in (b) and (c). | ||
It has previously been shown that atomic iron can be produced from the reduction of ferrocene and can agglomerate into iron clusters and act as nucleation sites for pyrolysis of hydrocarbons.36 In the present case, ferrocene, dissolved in carbon tetrachloride carbon source, is thought to generate iron particles that initiate the anisotropic growth of the carbon nanotubes. The formation of large quantities of NiCl2 (according to XRD pattern, ESI Fig. S1†) suggests that Ni acts as the chlorine-absorbing agent and in preventing the formation of FeCl2 which can hinder the formation of the nanotube structure. It is also possible, especially with the large excess of Ni used, that Ni nanoparticles form and act as substrate for nanotube growth. The relatively low synthesis temperature results in the amorphous nature of the nanotube walls.
As-prepared CNTs usually contain impurities, mainly in the form of metal residues from metal substrates and catalysts. Prior to assessment of the present CNTs and their activation, we carried out some purification via two ways. Firstly, via the use of concentrated nitric acid to dissolve residual metals (Ni and Fe) followed by filtration and subsequent washing with ethanol and distilled water. Alternatively, we used a less destructive physical separation method wherein the as-synthesised (CNT-as) sample was stirred in ethanol with a magnetic stirrer. After 1 h, some metal (Ni and Fe) that adhered to the magnetic stirrer was physically removed and the process repeated until no metal stuck to the magnetic stirrer. The CNT yield was then filtered and washed with ethanol and distilled water. Both purification methods afforded pristine CNTs that completely burnt off in air, leaving behind no residue according to TGA assessment (ESI Fig. S2†), indicating the complete removal of inorganic residues. According to TGA data (ESI Fig. S2†), the ethanol washed sample (CNT-ethanol) was thermally more stable in the temperature range up to 400 °C than the acid washed (CNT-acid) sample. XPS analysis of the surface composition of both CNT-acid and CNT-ethanol samples showed an oxygen content of 8 wt% for ethanol washed and 15 wt% for acid washed nanotubes. The greater number of carbon–oxygen bonds on the acid washed CNT-acid sample is a possible reason for lower thermal stability as the greater surface oxygen atoms can enhance decomposition of the carbon structure. Nevertheless, both samples underwent the greatest mass loss at ca. 500 °C indicating the burning off of the CNTs. The aggregated superstructure morphology of the CNT samples is retained after purification (Fig. 3a) with the main change being the opening up of some of the nanotube tips (Fig. 3b). The diameter of the washed nanotubes is ca. 200 nm with 20–30 nm thick walls that appear to be amorphous (Fig. 3c–e).
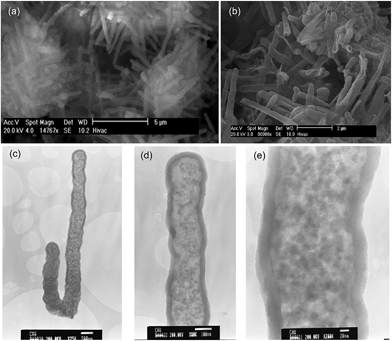 | ||
| Fig. 3 SEM (a and b) and TEM (c–e) images of acid washed CNTs (sample CNT-acid). The scale bar is 200 nm in (c) 100 nm in (d) and 20 nm in (e). | ||
3.2. Chemical activation of the CNTs
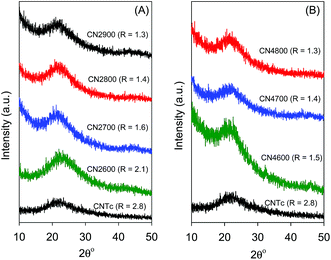
Fig. 4 shows XRD patterns of KOH activated CNTs (at KOH/carbon ratio of 2 and 4). The activated CNT samples exhibit a very broad peak at 2θ = 23, which is assigned to the (002) diffraction of graphitic carbon. The broadness of the peak indicates that the activated samples are predominantly amorphous, although there is some degree of graphitization. An empirical parameter (R), which is defined as the ratio of the height of the (002) Bragg peak to the background, has been used as a measure of the number of carbon sheets arranged as a single layer.37 The background (A) is created by drawing a line connecting the data on either side of the peak and the height of the peak (B) is deduced by drawing a line that is a tangent to the linear background estimate and which intersects the (002) peak in a single point (ESI Fig. S3†). The value of R is then calculated as B/A. It has previously been demonstrated that R decreases as the single-layer content of the carbon increases, such that when R = 1, all graphene layers are randomly distributed as single layers while larger (>1) values of R indicate a higher percentage of graphene sheets stacked in parallel.37,38 As shown in Fig. 4, the R values of the activated CNT samples are lower than that of pristine CNT, which suggests that some degree of graphitization was lost during the activation process. There is also a decrease in the R value at higher activation temperature. The decrease in the value of R towards 1, indicates that there is an increase in the proportion of randomly distributed/oriented graphene sheets, and confirms that KOH activation leads to the breakdown of any aligned structural domains in the CNT superstructure matrix that may have existed prior to activation.Observations from SEM images in Fig. 5 suggest that chemical activation proceeds via generation of large numbers of defects on the surface of the CNTs, which, depending on the extent of activation (i.e., activation temperature and KOH/carbon ratio), can eventually lead to the destruction of the nanotubular structure. The defects generated by activation appear in the form of puckerings and holes on the nanotube walls, which possibly increase the surface area and create new nanochannels that are available for the diffusion of gases and enhanced gas adsorption. It is clear from the SEM images in Fig. 5 that CNT superstructures activated at KOH/carbon ratio of 2 (i.e., CN2T samples) generally retain the nanotubular structure whereas activation at the higher KOH/carbon of 4 (CN4T samples) leads to loss of the tubular structure (ESI Fig. 4†). Regarding the effect of temperature, for CN2T samples, the nanotube structure is not completely lost until activation at 900 °C, while the loss of nanotubular structure is observed for all the CN4T samples regardless of the activation temperature (ESI Fig. S4†). For each series of activated CNxT samples, increasing the activation temperature rapidly increases the number of defects on the nanotube structures. Indeed for sample CN4800, which is activated at the severest conditions, the morphology is similar to that of typical activated carbons.21
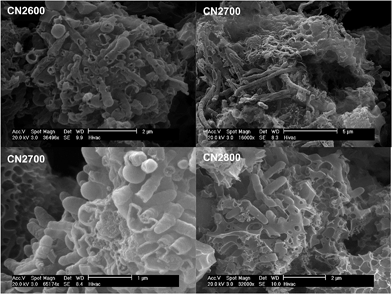 | ||
| Fig. 5 SEM images of activated CN2T samples prepared at KOH/carbon ratio of 2 at various temperatures. | ||
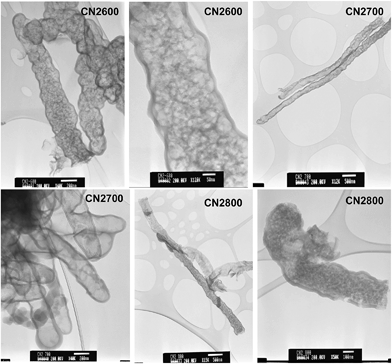
The TEM images in Fig. 6 show that standalone nanotubes and CNT superstructures are still present for activated CNT2 samples. The diameter of the activated nanotubes increases at higher activation temperature and the walls become thinner; for example, a comparison between samples CNT-acid and CN2600 indicates that diameter increases from ca. 160 nm to 400 nm and wall thickness decreases from 25 nm to 17 nm (Fig. 6 and ESI Fig. S5†). For sample CN2800, some of the nanotubes appear to be opening up to plate-like particles. At high magnification it is possible to observe pore channels in the nanotubes (ESI Fig. S5†). For CNT4 samples, no nanotubular features are observed (ESI Fig. S6†). The observed structural changes show that the chemical activation process leads to the unravelling of the nanotube structure and at the right temperature and KOH content, the structural integrity of the pristine CNT sample is compromised.
The nitrogen sorption isotherms of pristine and activated CN2T samples are presented in Fig. 7 and the textural properties are summarised in Table 1. The shapes of the isotherms range from type 1 (associated with microporosity) to type IV (associated with mesoporosity), based on the IUPAC classification. The isotherm of the pristine (CNT-acid) sample is type I with most of the nitrogen uptake occurring at P/Po < 0.02, which indicates the presence of microporosity. The CNT-acid sample exhibits considerable porosity with surface area and total pore volume of 470 m2 g−1 and 0.39 cm3 g−1, respectively. Activation increases the microporosity (sample CN2600 and CN2700), while for samples CN2800 and CN2900 the increase in microporosity is accompanied by generation of mesopores. Indeed, sample CN2900 has a predominantly type IV isotherm signifying high levels of mesoporosity. Activation generates new porosity in the CN2T samples with the extent and nature of the porosity dependent on the activation temperature. As the activation temperature rises from 600 to 800 °C, there is a significant widening of the ‘knee’ of the isotherm, which indicates formation of larger micropores, while activation at 900 °C generates mesopores.
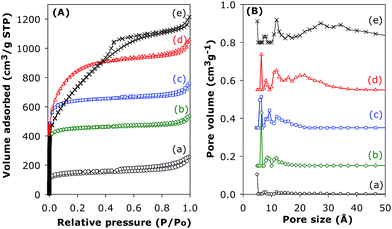 | ||
| Fig. 7 Nitrogen sorption isotherms (A) and pore size distribution curves (B) of (a) CNT-as, and activated CN2T samples; (b) CN2600, (c) CN2700, (d) CN2800 and (e) CN2900. | ||
| Sample | Surface areaa (m2 g−1) | Pore volumeb (cm3 g−1) | Pore sizec (Å) | CO2 uptake (mmol g−1)d | H2 uptakee (wt%) | ||
|---|---|---|---|---|---|---|---|
| 1 bar | 20 bar | Excess | Total | ||||
| a The values in the parenthesis refer to micropore surface area. b The values in the parenthesis refer to micropore volume. c Pore size distribution maxima obtained from NLDFT analysis. d CO2 uptake at 25 °C and various pressures (i.e., 1 bar and 20 bar). e Hydrogen uptake at −196 °C and 20 bar. f Hydrogen uptake at −196 °C and 20 bar obtained on a different instrument (Xemis Hiden). | |||||||
| CNT-acid | 470 (373) | 0.39 (0.18) | 8/12 | 1.4 | |||
| CN2600 | 1479 (1400) | 0.83 (0.67) | 6/9/11 | 4.4 | 12.1 | 3.1 | 3.7 |
| CN2700 | 2102 (1987) | 1.18 (0.95) | 6/9/13 | 4.0 | 15.7 | 4.2 | 5.0 |
| CN2800 | 2925 (2538) | 1.56 (1.18) | 6/8/11/21 | 2.8 | 19.5 | 4.8 | 5.8 |
| CN2900 | 2676 (801) | 1.88 (0.36) | 7/12/27/34 | 2.4 | 18.0 | 4.4 | 5.6 |
| CN4600 | 2051 (1752) | 1.09 (0.82) | 8/12/21 | 3.1 | 3.8 | ||
| CN4700 | 3202 (1106) | 2.14 (0.50) | 8/12/28 | 5.3 | 6.7 | ||
| CN4800 | 3802 (33) | 2.98 (0.22) | 8/12/34 | 2.1 | 13.7 | 5.4 (5.6)f | 7.3 (7.5)f |
Activation of the CNT superstructures at KOH/carbon ratio of 2, and 600 or 700 °C generates activated carbon samples that are microporous; the isotherms for these samples show a steep rise in amount adsorbed at low relative pressures (P/Po), followed by a flattening out, indicating micropore saturation (Fig. 7). The isotherm of the carbon activated at 800 °C suggests the formation of a microporous sample with significant super-microporosity and some small mesopores while the isotherm of the sample activated at 900 °C is type IV with a steep increase in adsorbed nitrogen at low relative pressures as well as a well-developed mesopore filling step. The greater extent of activation at 900 °C induces the creation of mesopores thus widening the pore size distribution. The textural data in Table 1 shows an increase in the surface area from 470 m2 g−1 (for sample CNT-as) to 1479 m2 g−1 for CN2600, 2102 m2 g−1 for CN2700 and a high (for CN2T samples) of 2925 m2 g−1 for CN2800, with increasing activation temperature up to 800 °C, followed by a slight decrease to 2676 m2 g−1 after activation at 900 °C for sample CN2900. On the other hand, the pore volume rises continuously at higher activation temperature from 0.39 cm3 g−1 (for sample CNT-as) to 1.88 cm3 g−1 after activation at 900 °C. It is noteworthy that a very high proportion of the surface area of the activated CN2T samples (i.e., ca. 95% for activation at 600 and 700 °C, and 87% for 800 °C) is from micropores. The proportion of micropore volume is also high at 81% for activation at 600 and 700 °C, and 75% for 800 °C. For sample CN2900, the proportion of micropore surface area and pore volume is lower at 30% and 19%, respectively, which emphasises the mesoporous nature of this sample.
When the KOH/carbon ratio is increased to 4, the resultant activated carbons have isotherms that are either type I (CN4600) or predominantly type IV (CN4700 and CN4800) as shown in Fig. 8. The isotherm of the sample activated at 600 °C exhibits a type 1 isotherm with a relatively sharp ‘knee’ at P/Po between 0.1 and 0.3, which is characteristic of the presence of micropores; thus significant microporosity is retained in sample CN4600. Changes in the shape of the isotherm to type IV at higher activation temperature reveal drastic modification of the pore structure of the activated CN4700 and CN4800 samples. The type IV isotherms are characterised by an initial rise in the amount of nitrogen adsorbed at low relative pressures, followed by a linear increase in adsorption in the P/Po range of 0.1 to 0.4, indicating a shift to larger sized pores. Additionally, hysteresis loops, which are associated with the capillary condensation in mesopores, are present at P/Po up to 0.9 and they become more pronounced after activation at 800 °C. These highly activated CN4T samples exhibit very high surface area of up to 3802 m2 g−1 and pore volume of up to 2.98 cm3 g−1 for sample CN4800. These values are comparable to the highest values that have been reported for highly activated carbons.39 This is the first time such high values have been reported for activated carbon generated from nanotubular structures. It is noteworthy that sample CN4800 is almost entirely mesoporous while the proportion of microporosity in the other CN4T samples varies from a high of 84% for CN4600 to 35% for CN4700. The proportion of micropore volume is 75% and 23% for CN4600 and CN4700, respectively. The textural data of CN4T samples in Table 1 shows a decrease in the micropore surface area as the overall surface area increases at higher activation temperature. This trend suggests that the evolution of high surface areas is first from the formation of multiple defects on the carbon nanotubes and opening of closed tip surfaces to produce micropores. As the activation temperature rises, gradual widening of these micropores occurs to generate mesopores. As the maximum surface area is approached, the structural integrity of the carbon nanotube is completely lost owing to the collapse of nanotube walls. The overall variations in the textural data show that it is possible to generate a suite of activated carbons covering the range from highly microporous (CN2600, CN2700) to entirely mesoporous (CN4800) by careful choice of activating conditions.
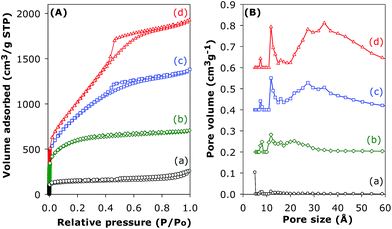 | ||
| Fig. 8 Nitrogen sorption isotherms (A) and pore size distribution curves (B) of (a) pristine (CNT-as) sample and activated CN4T samples; (b) CN4600, (c) CN4700 and (d) CN4800. | ||
The pore size distribution curves of sample CNT-acid and the activated CN2T series samples are shown in Fig. 7B and ESI Fig. S7.† The porosity of sample CN2600 is made up mostly of narrow micropores of size below 7 Å. There exists a small proportion of larger micropores of size between 8 and 13 Å, whose proportion gradually increases for CN2T samples activated at higher temperature (CN2700, CN2800 and CN2900). Indeed, the CN2900 sample activated at 900 °C hardly exhibits the pore size maxima at ca. 6 Å, and a new pore maximum at 13 Å becomes more pronounced along with the development of a broader pore size distribution at larger pore sizes. For the CN4T samples (Fig. 8B and ESI Fig. S8†), although a minor proportion of pores of size ca. 7–8 Å and 12 Å is observed in all samples, there is a much more significant increase in the volume of mesopores at higher activation temperature. Overall, the pore size distribution of CN4T samples is much broader and there is a shift to larger mesopores of size up to 60 Å at higher activation temperature (i.e., sample CN4800).
It is generally known that the first step in chemical activation with KOH is a redox reaction which results in the formation of potassium.40,41 The metallic potassium is intercalated within the carbon walls causing degradation and the evolution of porosity when washed out. Several studies have shown that degradation due to intercalation occurs more readily for lowly graphitised carbon structures than in graphitic carbons or carbons with high degree of planar orientation.42,43 Given the extent of activation that has been achieved from the present CNTs, it can be concluded that the low graphitization degree of the carbon nanotube walls makes the nanotubes susceptible to chemical activation. The degree of activation achieved in this work is much higher than any other previous attempts to activate carbon nanotubes.22–24,43
3.3. CO2 storage
Given the high microporosity of the activated CNT samples, especially after mild activation conditions, their CO2 adsorption capacity was investigated. The ambient temperature (25 °C) CO2 uptake isotherms for CN2T samples are shown in Fig. 9a and Table 1 summarizes the amount of CO2 adsorbed at pressure of 1 bar and 20 bar. At 1 bar, the acid washed CNT-acid sample has CO2 uptake of 1.4 mmol g−1. The uptake at 1 bar increases to between 2.4 and 4.4 mmol g−1 for activated CN2T samples and appears to show a reverse dependence on activation temperature; the sample activated at 600 °C (CN2600) stores 4.4 mmol g−1, which then reduces to 4.0, 2.8 and 2.4 mmol g−1 for samples CN2700, CN2800 and CN2900, respectively (ESI Fig. S9†). The decrease in CO2 uptake occurs despite the fact that the high temperature activated samples have higher surface area. The CO2 uptake at 1 bar is thus more dependent on the pore size and in particular the presence of small micropores (Fig. 7 and Table 1). This means that it is not the total surface area, but the pore size that determines the CO2 uptake at 1 bar. The observed dependence of room temperature CO2 uptake at 1 bar on pore size rather than surface area is consistent with previous report.44–48 On the other hand, the CO2 uptake at 20 bar is determined by the total surface area (Fig. 9a and Table 1), with samples CN2800 and CN2900 having the highest storage capacity of 19.5 and 18.0 mmol g−1, respectively.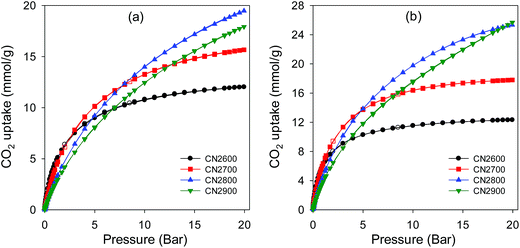 | ||
| Fig. 9 CO2 uptake isotherms at (a) 25 °C and (b) 0 °C in the pressure range 0–20 bar for activated CN2T carbons. | ||
In an attempt to optimise the CO2 uptake of CN2T series of samples, we also prepared samples at 500, 550 and 650 °C. Porosity analysis indicates that the surface area and pore volume increases continuously for activation temperature between 500 and 700 °C, from 1026 to 2102 m2 g−1 and 0.56 to 1.18 cm3 g−1, respectively (ESI Fig. S10 and Table S1†). There is a slight increase in pore size as the activation temperature increases from 500 to 700 °C (ESI Fig. S10b and Table S1†). The CN2T samples activated between 500 and 700 °C have very high proportion of microporosity (92–97% of surface area, and 73–83% of pore volume). The CO2 uptake at 1 bar increases from 3.7 mmol g−1 at 500 °C (sample CN2500) to a high of 4.8 mmol g−1 at 650 °C (sample CN2650) and then reduces to 4.0 mmol g−1 at 700 °C (sample CN2700). It is interesting to note that sample CN2650, which stores the most amount of CO2 at 1 bar (ESI Fig. S11†), also has the highest proportion of microporosity (ESI Table S1†). This suggests that sample CN2650 has the optimum mix of surface area, pore volume and pore size for enhanced CO2 uptake at 1 bar. Indeed, CO2 uptake of 4.8 mmol g−1, at 25 °C and 1 bar is amongst the highest observed for carbons, being only comparable to the best template49 or activated carbons.44–48 However due to a moderate surface area, the CO2 uptake of sample CN2650 is lower than that of sample CN2700 at 20 bar (ESI Fig. S12†).
Fig. 9b shows the CO2 uptake isotherms for CN2T carbons at 0 °C. At 1 bar, the uptake varies between 3.8 and 8.4 mmol g−1 (ESI Table S2†), with the uptake being greater for more highly microporous samples (ESI Fig. S13a†). We note that the 8.4 mmol g−1 uptake of sample CN2650 is one of the highest ever recorded for any porous material under such conditions.44–48 As shown Fig. 9 (and ESI Fig. S13b†), at pressures ≥ 5 bar, the CO2 uptake is determined by the total surface area. At 20 bar, the CO2 uptake of sample CN2800 and CN2900 is impressively high at ∼25.5 mmol g−1 (ESI Table S2†). The CO2 uptake isotherms show that these two samples are very far from saturation (Fig. 9) and higher uptakes can be achieved at pressures above 20 bar. In contrast, the adsorption isotherms for the more highly microporous CN2T samples appear to be approaching saturation at 20 bar. This shows that the adsorption mechanism must be different for high pressure CO2 adsorption. The enhanced CO2 uptake at high pressures for high surface area samples may be ascribed to a pore-filling mechanism, rather than surface coverage that operates at lower pressure. In contrast to surface coverage, in a pore filling process, larger micropores and even small mesopores are accessible to hold CO2 molecules. Indeed, sample CN4800, which has the highest surface area but with hardly any microporosity, exhibits a nearly linear CO2 uptake isotherm at 0 °C (ESI Fig. S14†). This sample has the highest uptake of 26.4 mmol g−1 at 20 bar and 0 °C (ESI Table S2†), but has a lower uptake at 25 °C (ESI Fig. S15†) than the CN2T samples, and much lower uptake at 1 bar (Table 1).
The overall picture that emerges is that the CO2 uptake at 1 bar clearly follows the trend in the proportion of microporosity of the samples. Sample CN4800 with hardly any microporosity has a low uptake (2.1 mmol g−1) whilst sample CN2700, CN2650, CN2600 and CN2550 with ca. 96% micropore surface area have the highest adsorption capacities of between 4.0 and 4.8 mmol g−1. As discussed above, low temperature activation favours the formation of small micropores and as the activation temperature increases wider micropores and small mesopores are generated. Thus samples CN2T, where T is between 550 and 700 °C, which are dominated by narrow micropores (6 and 9 Å) take up more CO2 at 1 bar and room temperature than CN2800 and CN2900 samples with larger pore (11 to 34 Å). These findings are consistent with several previous studies that propose that micropores are vital for the efficient uptake of CO2 at low pressure.44–50 The CO2–carbon interaction energy is derived from short-range attractive forces which are considerably enhanced when CO2 adsorption takes place in very narrow pores because of the overlapping of the potential fields from neighbouring walls. The enhanced adsorption potential leads to the complete volume filling of micropores at low relative pressures (P/Po < 0.01) of CO2. Theoretical calculations have demonstrated that enhancement of the adsorption potential is only valid for micropore widths that are two times (slit-shaped pores) or three times (cylindrical-shaped pores) the diameter of the molecule.51 Thus, assuming the pore shape in the activated CNT samples to be close to slit-shaped and the kinetic diameter of CO2 being ca. 3.3 Å, a pore size of 7–9 Å is optimal for the adsorption of CO2 under ambient conditions. Therefore, porous materials with a preponderance of micropores in this pore size range will be efficient at adsorbing significant amounts of CO2 at low pressures and room temperature, which explains the superior performance of samples CN2600 and CN2650, which possess a very high proportion of pores in the size range 6–9 Å.
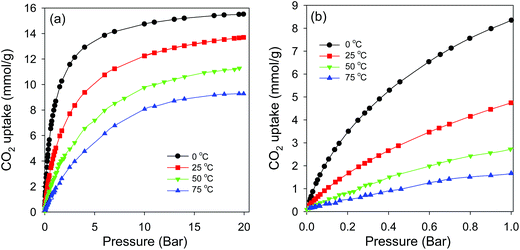 | ||
| Fig. 11 CO2 uptake isotherms for sample CN2650 at various temperatures; (a) 0–20 bar, (b) low pressure (0–1 bar). | ||
Overall, it is clear that the activated CNT samples exhibit high uptake capacities; the uptake of 4.8 mmol g−1 for sample CN2650 at 1 bar and room temperature represents one of the highest uptakes that have been reported.44,53,54 For post-combustion CO2 uptake applications such as capture of CO2 from industrial flue gases, where the CO2 pressure is low (<1 bar) and the concentration of CO2 is low (∼15%), samples such as CN2600 and CN2650 with maximised microporosity and CO2 uptake at ambient conditions are desirable. For other CO2 storage applications such as pre-combustion CO2 uptake, where the CO2 concentrations are usually higher and the temperature of the system can be tuned as required, the high uptakes exhibited by CN800 (25.30 mmol g−1) and CN2900 (25.70 mmol g−1) are desirable. Thus, it is possible to readily tailor the porosity of the activated CNTs towards the desired CO2 uptake application.
3.4. Hydrogen storage
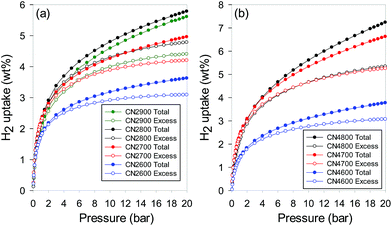
Fig. 12 shows the excess and total hydrogen uptake isotherms for the activated CNT samples, and the uptake at 20 bar is summarised in Table 1. In Fig. 12 and Table 1, the excess uptake is the amount of hydrogen that is adsorbed in the activated CNTs beyond that which would have been stored in the pores of the samples under any given conditions (i.e., temperature and pressure) assuming no interaction between the hydrogen and the carbon pore wall surface. The total hydrogen uptake may be calculated from the excess storage by factoring in the amount of hydrogen compressed within the known sample pore volume space (Table 1). The IGA used in our hydrogen uptake measurements directly determines the excess uptake from which the total storage, which gives a more global view of the amount of hydrogen stored in any sample, was obtained (see ESI† for details).39,55 The uptake isotherms in Fig. 12 show no hysteresis, which indicates that the hydrogen sorption process into the activated CNTs is reversible. It is also noteworthy that in all cases, the total hydrogen uptake does not reach or approach saturation, which means that higher uptake is achievable at pressure above 20 bar. The hydrogen uptake of CN2T samples (Fig. 12a) increases with activation temperature to a maximum for sample CN2800, and then decreases for sample CN2900. The excess and total hydrogen uptake at 20 bar (Table 1) follows the variation in both the micropore surface area and the total surface area. The lowest excess uptake at 20 bar is 3.1 wt% for sample CN2600, which increases to 4.2 and 4.8 wt% for CN2700 and CN2800, respectively and then reduces to 4.8 wt% for CN2900. The total hydrogen uptake also shows a maximum for CN2800 of 5.8 wt%. In general, the hydrogen uptake of the CN2T samples is typical for activated carbons.18,20,21,39,56–63For CN4T samples (Fig. 12b), the hydrogen uptake increases at higher activation temperature. This is to be expected as surface area and pore volume of the CN4T series of samples increases at higher activation temperature (Table 1). Thus, at 20 bar, sample CN4600 achieves modest excess and total hydrogen uptake of 3.1 and 3.8 wt%, respectively. The hydrogen storage capacity is much higher for sample CN4700; 5.3 and 6.7 wt% for excess and total uptake, respectively. On the other hand, the uptake of sample CN4800 is remarkably high with the excess and total uptake reaching 5.4 and 7.3 wt%, respectively. A total hydrogen uptake of 7.3 wt% at 20 bar is the highest reported so far for any activated carbon, and amongst all carbons such an uptake is only matched by zeolite-templated carbons.18,20,21,39,56–63 This is the first report on CNT-derived activated carbons with such an high hydrogen uptake.
The trend observed in hydrogen uptake is closely related to the textural properties of the activated CNT samples. More specifically, it appears that the higher the overall porosity of the sample, the higher the hydrogen storage capacity such that there is a linear dependence of the amount of hydrogen stored on the overall surface area and pore volume. As the surface area and pore volume increases from 1479 m2 g−1 and 0.83 cm3 g−1 for sample CN2600 to 3802 m2 g−1 and 2.98 cm3 g−1 for CN4800, the total hydrogen uptake also rises from 3.7 wt% to 7.3 wt%. This linear dependence on textural properties, particularly in dis-ordered carbons, has previously been observed.18,20,21,39,56–66 The dependence can be explained by considering that as the surface area increases, the number of sites available for physisorption of hydrogen increases, leading to higher adsorption capacities. The hydrogen molecules will pack in order to fill these increased available sites at the low temperature and high pressure (−196 °C and 20 bar) conditions used. The linear relationship between surface area and hydrogen uptake is better at higher pressures than at lower pressures (ESI Fig. S16†).
As mentioned above, the total hydrogen uptake discussed so far was measured on a Hiden IGA up to a pressure of 20 bar. The uptake does not reach or approach saturation, which means that higher storage is achievable at pressure above 20 bar. Therefore in order to have a fuller picture of the hydrogen uptake of the CNxT carbons, we assessed the best performing sample (CN4800) at pressures of up to 150 bar using a Hiden Xemis analyser at both −196 °C and room temperature. We first note that there was very good agreement between the two independent instruments (IGA and Xemis) with respect to hydrogen uptake data at −196 °C and pressure of up to 20 bar; ESI Fig. S17.† Furthermore, with respect to reproducibility and validity of our hydrogen uptake data, we note that our IGA has previously been validated by comparison with volume-based measurements from other labs.20 As shown in Table 1, the excess hydrogen uptake at −196 °C, via the Xemis, is 5.6 wt% at 20 bar (compared to 5.4 wt% for the IGA) while the total uptake is 7.3 and 7.5 wt% for the IGA and Xemis, respectively. Fig. 13 shows the excess and total hydrogen storage capacity for sample CN4800 at −196 °C and room temperature in the pressure range 0–150 bar. The excess hydrogen uptake at −196 °C reaches ca. 6.0 wt% at 40 bar, which translates to a total uptake capacity of 9.7 wt% (ESI Table S3†). The total uptake of 9.7 wt% at 40 bar is significantly higher than the best activated carbons reported to date, which store <8.0 wt% hydrogen under similar conditions.67–69 The total hydrogen storage at 150 bar and −196 °C reaches an unprecedented 14.9 wt% (ESI Table S3†), which is a new record for porous carbon materials.18,21,39,56,57,59–62,67–69 The fact that sample CN4800 has the highest reported hydrogen uptake for any porous carbon (i.e., 7.5, 9.7, 12.5 and 14.9 wt% at 20, 40, 80 and 150 bar, respectively) is consistent with the equally highest surface area (3802 m2 g−1) and pore volume (2.89 cm−3 g−1) for any activated carbon. On a more general note, it is interesting to note that the cryogenic hydrogen uptake of sample CN4800 is not only higher than that of any previously reported carbon18,21,39,56,57,59–62,67–69 but also closely matches (ESI Table S4†) that of the best performing metal organic frameworks (MOFs). In particular, the hydrogen uptake of sample CN4800 is higher than that of benchmark MOFs such as MOF-5,70 MOF-177 (ref. 71) and NOTT-112 (ref. 55) and compares favourably to the uptake of high surface area MOFs (Nu-100 (ref. 72) and MOF-210 (ref. 73)), which are the current record holders for gravimetric hydrogen storage in porous materials under cryogenic conditions.
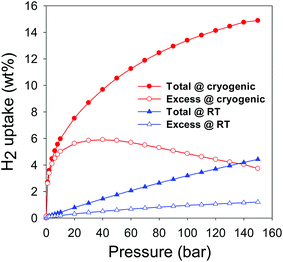 | ||
| Fig. 13 Cryogenic (−196 °C) and room temperature (25 °C) excess and total hydrogen uptake of sample CN4800. | ||
With respect to room temperature hydrogen storage, the excess uptake for sample CN4800 is 1.3 wt% at 150 bar is one of the highest reported for any porous material under those conditions (ESI Table S5†) and exceeds that of the best performing activated carbon (i.e., 1.0 wt% for carbon KUA5)39 and equals that of the best state-of-the-art materials (1.2–1.3 wt% for zeolite template carbons).74,75 The total hydrogen stored in sample CN4800 at room temperature reaches an impressive 4.43 wt% at 150 bar (Fig. 13 and ESI Table S3†), which is a new high for porous materials (ESI Table S5†). To date, the highest reported total hydrogen uptake under similar conditions is 2.7 wt% for KUA5 activated carbon39 (ESI Table S5†).
4. Conclusions
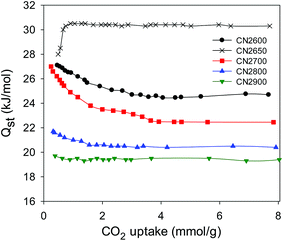
In summary, the synthesis of carbon nanotubes (CNTs) has been achieved using carbon tetrachloride, ferrocene and Ni at a low temperature of 180 °C. The carbon nanotubes have a predominantly amorphous framework with large tube diameters of 180–300 nm and wall thickness of ca. 25 nm arranged into closely networked superstructures. Purification of the CNT yield by washing with acid yielded pristine carbon nanotubes with open tips. The pristine CNT superstructures, with surface area and pore volume of 470 m2 g−1 and 0.39 cm3 g−1, respectively, were successfully activated with KOH to give highly porous carbons with surface area ranging between 1479–3802 m2 g−1. Mild activation at KOH/carbon ratio of 2 generates activated CN2T carbons (where T is activation temperature) that still retain nanotubular morphology and, depending on the activation temperature, a very high proportion of microporosity, with typically >95% of surface area arising from micropores. The CN2T samples have excellent CO2 uptake capacity at 25 °C; 2.4–4.8 mmol g−1 at 1 bar and 12.1–19.5 mmol g−1 at 20 bar. The best performing CO2 storage sample, CN2650, has the highest proportion of micropore surface area (97%), which was reflected in the high CO2 uptake at 1 bar of 4.8 mmol g−1 (21 wt%) and 8.4 mmol g−1 (37 wt%) at room temperature and 0 °C, respectively. At higher pressure of 20 bar, the sample activated at 800 °C (CN2800) adsorbs large amounts of CO2; 19.8 mmol g−1 (87 wt%) and 25.4 mmol g−1 (112 wt%) at 25 °C and 0 °C, respectively. The activated CNTs have relatively high isosteric heat of adsorption of up to 30.5 kJ mol−1, indicating that strong interactions exist between the carbon surface and the CO2 molecules. Activation of the CNTs at a KOH/carbon ratio of 4 generated activated CN4T carbons with very high surface area and pore volume of up to 3802 m2 g−1 and 2.98 cm3 g−1, respectively. The CN4T carbons contained large micropores and a significant proportion of mesopores and exhibit exceptional hydrogen storage of up to 7.5 wt% at −196 °C and 20 bar, rising to 9.7 wt% at 40 bar and 14.9 wt% at 150 bar, while at room temperature uptake reaches an impressive high of 4.4 wt% at 150 bar. Thus by choice of activation conditions, it is possible to tailor the porosity of the present activated CNT superstructures towards CO2 or hydrogen uptake applications.Acknowledgements
The work was funded by the University of Nottingham. The authors gratefully acknowledge Hiden Analytical for the high pressure hydrogen storage data.References
- (a) S. Iijima, Nature, 1991, 354, 56 CrossRef CAS; (b) R. H. Baughman, A. A. Zakhidov and W. A. de Heer, Science, 2002, 297, 787 CrossRef CAS PubMed; (c) P. M. Ajayan, Chem. Rev., 1999, 99, 1787 CrossRef CAS PubMed; (d) D. Tasis, N. Tagmatarchis, A. Bianco and M. Prato, Chem. Rev., 2006, 106, 1105 CrossRef CAS PubMed; (e) H. J. Dai, Acc. Chem. Res., 2002, 35, 1035 CrossRef CAS PubMed; (f) J. M. Schnorr and T. M. Swager, Chem. Mater., 2011, 23, 646 CrossRef CAS; (g) M. M. J. Treacy, T. W. Ebbesen and J. M. Gibson, Nature, 1996, 381, 678 CrossRef CAS; (h) P. Delaney, H. J. Choi, J. Ihm, S. G. Louie and M. L. Cohen, Nature, 1998, 391, 466 CrossRef CAS PubMed.
- (a) T. W. Ebbesen and P. M. Ajayan, Nature, 1992, 358, 220 CrossRef CAS; (b) D. T. Colbert, J. Zhang, S. M. McClure, P. Nikolaev, Z. Chen, J. H. Hafner, D. W. Owens, P. G. Kotula, C. B. Carter, J. H. Weaver, A. G. Rinzler and R. E. Smalley, Science, 1994, 266, 1218 CAS.
- (a) M. Terrones, N. Grobert, J. Olivares, J. P. Zhang, H. Terrones, K. Kordatos, W. K. Hsu, J. P. Hare, P. D. Townsend, K. Prassides, A. K. Cheetham, H. W. Kroto and D. R. M. Walton, Nature, 1997, 388, 52 CrossRef CAS PubMed; (b) R. Sen, A. Govindaraj and C. N. R. Rao, Chem. Phys. Lett., 1997, 267, 276 CrossRef CAS; (c) R. Andrews, D. Jacques, A. M. Rao, F. Derbyshire, D. Qian, X. Fan, E. C. Dickey and J. Chen, Chem. Phys. Lett., 1999, 303, 467 CrossRef CAS; (d) N. S. Kim, Y. T. Lee, J. Park, J. B. Han, Y. S. Choi, S. Y. Choi, J. Choo and G. H. Lee, J. Phys. Chem. B, 2003, 107, 9249 CrossRef CAS.
- (a) Z. F. Ren, Z. P. Huang, J. W. Xu, J. H. Wang, P. Bush, M. P. Siegel and P. N. Provencio, Science, 1998, 282, 1105 CrossRef CAS; (b) W. Z. Li, S. S. Xie, L. X. Qian, B. H. Chang, B. S. Zou, W. Y. Zhou, R. A. Zhao and G. Wang, Science, 1996, 274, 1701 CrossRef CAS; (c) B. Q. Wei, R. Vajtai, Y. Jung, J. Ward, R. Zhang, G. Ramanath and P. M. Ajayan, Nature, 2002, 416, 495 CrossRef CAS PubMed; (d) S. Huang, B. Maynor, X. Cai and J. Liu, Adv. Mater., 2003, 15, 1651 CrossRef CAS; (e) S. Huang, X. Cai and J. Liu, J. Am. Chem. Soc., 2003, 125, 5636 CrossRef CAS PubMed; (f) A. Cao, G. Meng and P. M. Ajayan, Adv. Mater., 2004, 16, 40 CrossRef CAS.
- (a) E. Frackowiak and F. Béguin, Carbon, 2001, 39, 937 CrossRef CAS; (b) H. Pan, J. Li and Y. Feng, Nanoscale Res. Lett., 2010, 5, 654 CrossRef CAS PubMed; (c) K. H. An, W. S. Kim, Y. S. Park, J. M. Moon, D. J. Bae, S. C. Lim, Y. S. Lee and Y. H. Lee, Adv. Funct. Mater., 2001, 11, 387 CrossRef CAS; (d) K. H. An, W. S. Kim, Y. S. Park, Y. C. Choi, S. M. Lee, D. C. Chung, D. J. Bae, S. C. Lim, Y. S. Lee and Y. H. Lee, Adv. Mater., 2001, 13, 497 CrossRef CAS.
- (a) A. C. Dillon, K. M. Jones, T. A. Bekkedahl, C. H. Kiang, D. S. Bethune and M. J. Heben, Nature, 1997, 386, 377 CrossRef CAS; (b) P. Chen, X. Wu, J. Lin and K. L. Tan, Science, 1999, 285, 91 CrossRef CAS; (c) C. Liu, Y. Y. Fan, M. Liu, H. T. Cong, H. M. Cheng and M. S. Dresselhaus, Science, 1999, 286, 1127 CrossRef CAS; (d) A. L. M. Reddy and S. Ramaprabhu, Int. J. Hydrogen Energy, 2007, 32, 3998 CrossRef CAS PubMed; (e) G. E. Ioannatos and X. E. Verykios, Int. J. Hydrogen Energy, 2010, 35, 622 CrossRef CAS PubMed; (f) X. Li, H. Zhu, L. Ci, C. Xu, Z. Mao, B. Wei, J. Liang and D. Wu, Carbon, 2001, 39, 2077 CrossRef CAS; (g) X. B. Wu, P. Chen, J. Lin and K. L. Tan, Int. J. Hydrogen Energy, 2000, 25, 261 CrossRef CAS.
- (a) H. M. Cheng, G. H. Yang and C. Liu, Carbon, 2001, 39, 1447 CrossRef CAS; (b) J. Lawrence and G. Xu, Appl. Phys. Lett., 2004, 84, 918 CrossRef CAS PubMed; (c) A. Ansón, M. A. Callejas, A. M. Benito, W. K. Maser, M. T. Izquierdo, B. Rubio, J. Jagiello, M. Thommes, J. B. Parra and M. T. Martínez, Carbon, 2004, 42, 1243 CrossRef PubMed.
- (a) Q. Wang and J. K. Johnson, J. Chem. Phys., 1999, 110, 577 CrossRef CAS PubMed; (b) M. Hirscher and M. Becher, J. Nanosci. Nanotechnol., 2003, 3, 3 CrossRef CAS PubMed; (c) A. Zuttel, P. Sudan, P. Mauron, T. Kiyobayashi, C. Emmenegger and L. Schlapbach, Int. J. Hydrogen Energy, 2002, 27, 203 CrossRef CAS.
- (a) M. Cinke, J. Li, C. W. Bauschlicher Jr, A. Ricca and M. Meyyappan, Chem. Phys. Lett., 2003, 376, 761 CrossRef CAS; (b) F. Su, C. Lu, W. Chen, H. Bai and F. F. Hwang, Sci. Total Environ., 2007, 407, 3017 CrossRef PubMed; (c) Q. Wang, J. Luo, Z. Zhong and A. Borgna, Energy Environ. Sci., 2011, 4, 42 RSC.
- (a) A. Peigney, C. Laurent, E. Flahaut, R. R. Bacsa and A. Rousset, Carbon, 2001, 39, 507 CrossRef CAS; (b) R. R. Bacsa, C. Laurent, A. Peigney, W. S. Bacsa, T. Vaugien and A. Rousset, Chem. Phys. Lett., 2000, 323, 566 CrossRef CAS.
- (a) C. M. Yang, D. Kasuya, M. Yudasaka, S. Iijima and K. Kaneko, J. Phys. Chem. B, 2004, 108, 17775 CrossRef CAS; (b) K. Shen, H. Xu, Y. Jiang and T. Pietraβ, Carbon, 2004, 42, 2315 CrossRef CAS PubMed.
- S. Orimo, G. Majer, T. Fukunaga, A. Züttel, L. Schlapbach and H. Fujii, Appl. Phys. Lett., 1999, 75, 3093 CrossRef CAS PubMed.
- F. Liu, X. Zhang, J. Cheng, J. Tu, F. Kong, W. Huang and C. Chen, Carbon, 2003, 41, 2527 CrossRef CAS.
- L. Qingwen, Y. Hao, Y. Yinchun, Z. Jin and L. Zhongfan, J. Phys. Chem. B, 2002, 106, 11085 CrossRef.
- J. Liu, A. G. Rinzler, H. Dai, J. H. Hafner, R. K. Bradley, P. J. Boul, A. Lu, T. Iverson, K. Shelimov, C. B. Huffman, F. Rodriguez-Macias, Y.-S. Shon, T. R. Lee, D. T. Colbert and R. E. Smalley, Science, 1998, 280, 1253 CrossRef CAS.
- J. Zhang, H. Zou, Q. Qing, Y. Yang, Q. Li, Z. Liu, X. Guo and Z. Du, J. Phys. Chem. B, 2003, 107, 3712 CrossRef CAS.
- D. B. Mawhinney, V. Naumenko, A. Kuznetsova, J. T. Yates Jr, J. Liu and R. E. Smalley, Chem. Phys. Lett., 2000, 324, 213 CrossRef CAS.
- M. Sevilla and R. Mokaya, Energy Environ. Sci., 2014, 7, 1250 CAS.
- (a) Y. Gogotsi, R. K. Dash, G. Yushin, T. Yildirim, G. Laudisio and J. E. Fischer, J. Am. Chem. Soc., 2005, 127, 16006 CrossRef CAS PubMed; (b) C. Vix-Guterl, E. Frackowiak, K. Jurewicz, M. Friebe, J. Parmentier and F. Beguin, Carbon, 2005, 43, 1293 CrossRef CAS PubMed; (c) G. Yushin, R. Dash, J. Jagiello, J. E. Fischer and Y. Gogotsi, Adv. Funct. Mater., 2006, 16, 2288 CrossRef CAS; (d) Y. Gogotsi, C. Portet, S. Osswald, J. M. Simmons, T. Yildirim, G. Laudisio and J. E. Fischer, Int. J. Hydrogen Energy, 2009, 34, 6314 CrossRef CAS PubMed; (e) N. Texier-Mandoki, J. Dentzer, T. Piquero, S. Saadallah, P. David and C. Vix-Guterl, Carbon, 2004, 42, 2744 CrossRef CAS PubMed; (f) J. Pang, J. E. Hampsey, Z. Wu, Q. Hu and Y. Lu, Appl. Phys. Lett., 2004, 85, 4887 CrossRef CAS PubMed; (g) E. Terres, B. Panella, T. Hayashi, Y. A. Kim, M. Endo, J. M. Dominguez, M. Hirscher, H. Terrones and M. Terrones, Chem. Phys. Lett., 2005, 403, 363 CrossRef CAS PubMed.
- (a) Z. Yang, Y. Xia and R. Mokaya, J. Am. Chem. Soc., 2007, 129, 1673 CrossRef CAS PubMed; (b) N. Alam and R. Mokaya, Energy Environ. Sci., 2010, 3, 1773 RSC; (c) M. Sevilla, R. Foulston and R. Mokaya, Energy Environ. Sci., 2010, 3, 223 RSC; (d) M. Sevilla, N. Alam and R. Mokaya, J. Phys. Chem. C, 2010, 114, 11314 CrossRef CAS; (e) Y. Xia, G. S. Walker, D. M. Grant and R. Mokaya, J. Am. Chem. Soc., 2009, 131, 16493 CrossRef CAS PubMed; (f) A. Pacula and R. Mokaya, J. Phys. Chem. C, 2008, 112, 2764 CrossRef CAS; (g) Z. Yang, Y. Xia, X. Sun and R. Mokaya, J. Phys. Chem. B, 2006, 110, 18424 CrossRef CAS PubMed; (h) N. Alam and R. Mokaya, Microporous Mesoporous Mater., 2011, 142, 716 CrossRef CAS PubMed; (i) N. Alam and R. Mokaya, Microporous Mesoporous Mater., 2011, 144, 140 CrossRef CAS PubMed; (j) Y. Xia, R. Mokaya, D. M. Grant and G. S. Walker, Carbon, 2011, 49, 844 CrossRef CAS PubMed; (k) M. Sevilla, A. B. Fuertes and R. Mokaya, Int. J. Hydrogen Energy, 2011, 36, 15658 CrossRef CAS PubMed; (l) A. Almasoudi and R. Mokaya, J. Mater. Chem., 2012, 22, 146 RSC; (m) Y. Xia and R. Mokaya, Chem. Vap. Deposition, 2010, 16, 322 CrossRef CAS; (n) B. Panella, M. Hirscher and S. Roth, Carbon, 2005, 43, 2209 CrossRef CAS PubMed.
- (a) H. Jin, Y. S. Lee and I. Hong, Catal. Today, 2007, 120, 399 CrossRef CAS PubMed; (b) E. Masika and R. Mokaya, Energy Environ. Sci., 2014, 7, 427 RSC; (c) M. Sevilla, A. B. Fuertes and R. Mokaya, Energy Environ. Sci., 2011, 4, 1400 RSC; (d) M. Sevilla, A. B. Fuertes and R. Mokaya, Energy Environ. Sci., 2011, 4, 2930 RSC; (e) Y. Xia and R. Mokaya, J. Phys. Chem. C, 2007, 111, 10035 CrossRef CAS.
- S. M. Lee, S. C. Lee, J. H. Jung and H. J. Kim, Chem. Phys. Lett., 2005, 416, 251 CrossRef CAS PubMed.
- (a) J. J. Niu and J. N. Wang, Solid State Sci., 2008, 10, 1189 CrossRef CAS PubMed; (b) J. J. Niu, J. N. Wang, Y. J. Lian, F. Su and J. Ma, Microporous Mesoporous Mater., 2007, 100, 1 CrossRef CAS PubMed.
- E. Raymundo-Piñero, P. Azaïs, T. Cacciaguerra, D. Cazorla-Amorós, A. Linares-Solano and F. Béguin, Carbon, 2005, 43, 786 CrossRef PubMed.
- C. H. Chen and C. C. Huang, Microporous Mesoporous Mater., 2008, 109, 549 CrossRef CAS PubMed.
- Y. Liu, Z. Shen and K. Yokogawa, Mater. Res. Bull., 2006, 41, 1503 CrossRef CAS PubMed.
- (a) Q. Jiang, M. Z. Qu, G. M. Zhou, B. L. Zhang and Z. L. Yu, Mater. Lett., 2002, 57, 988 CrossRef CAS; (b) Q. Jiang, M. Z. Qu, B. L. Zhang and Z. L. Yu, Carbon, 2002, 40, 2743 CrossRef CAS; (c) Q. Jiang, Y. Zhao, X. Y. Lu, X. T. Zhu, G. Q. Yang, L. J. Song, Y. D. Cai, X. M. Ren and L. Qian, Chem. Phys. Lett., 2005, 410, 307 CrossRef CAS PubMed; (d) Q. Jiang and Y. Zhao, Microporous Mesoporous Mater., 2004, 76, 215 CrossRef CAS PubMed.
- K. S. Kim and S. J. Park, Electrochim. Acta, 2012, 78, 147 CrossRef CAS PubMed.
- C. N. R. Rao and R. Sen, Chem. Commun., 1998, 1525 RSC.
- G. Hu, M. Cheng, D. Ma and X. Bao, Chem. Mater., 2003, 15, 1470 CrossRef CAS.
- X. Wang, J. Lu, Y. Xie, G. Du, Q. Guo and S. Zhang, J. Phys. Chem. B, 2002, 106, 933 CrossRef CAS.
- Y. Xiong, Y. Xie, X. Li and Z. Li, Carbon, 2004, 42, 1447 CrossRef CAS PubMed.
- C. Z. Wu, W. Luo, B. Ning and Y. Xie, Chin. Sci. Bull., 2009, 54, 1894 CrossRef CAS PubMed.
- L. S. Vanyorek, D. Loche, H. Katona, M. F. Casula, A. Corrias, Z. N. Kónya, A. K. Kukovecz and I. Kiricsi, J. Phys. Chem. C, 2011, 115, 5894 CAS.
- G. X. Zhu, X. W. Wei and S. Jiang, J. Mater. Chem., 2007, 17, 2301 RSC.
- L. Ci, Y. Li, B. Wei, J. Liang, C. Xu and D. Wu, Carbon, 2000, 38, 1933 CrossRef CAS.
- Y. Liu, J. S. Xue, T. Zheng and J. R. Dahn, Carbon, 1996, 34, 193 CrossRef CAS.
- D. Qu, Chem.–Eur. J., 2008, 14, 1040 CrossRef CAS PubMed.
- M. Jordá-Beneyto, F. Suárez-García, D. Lozano-Castelló, D. Cazorla-Amorós and A. Linares-Solano, Carbon, 2007, 45, 293 CrossRef PubMed.
- M. A. Lillo-Ródenas, D. Cazorla-Amorós and A. Linares-Solano, Carbon, 2003, 41, 267 CrossRef.
- M. A. Lillo-Ródenas, J. Juan-Juan, D. Cazorla-Amorós and A. Linares-Solano, Carbon, 2004, 42, 1371 CrossRef PubMed.
- O. Tanaike and M. Inagaki, Carbon, 1999, 37, 1759 CrossRef CAS.
- E. Raymundo-Piñero, D. Cazorla-Amorós, A. Linares-Solano, S. Delpeux, E. Frackowiak, K. Szostak and F. Béguin, Carbon, 2002, 40, 1614 CrossRef.
- (a) M. Sevilla and A. B. Fuertes, Energy Environ. Sci., 2011, 4, 1765 RSC; (b) M. Sevilla, P. Valle-Vigon and A. B. Fuertes, Adv. Funct. Mater., 2011, 21, 2781 CrossRef CAS; (c) M. Sevilla, J. B. Parra and A. B. Fuertes, ACS Appl. Mater. Interfaces, 2013, 5, 6360 CrossRef CAS PubMed.
- (a) V. Presser, J. McDonough, S.-H. Yeon and Y. Gogotsi, Energy Environ. Sci., 2011, 4, 3059 RSC; (b) M. Nandi, K. Okada, A. Dutta, A. Bhaumik, J. Maruyama, D. Derksa and H. Uyama, Chem. Commun., 2012, 48, 10283 RSC.
- (a) J. Silvestre-Albero, A. Wahby, A. Sepulveda-Escribano, M. Martinez-Escandell, K. Kaneko and F. Rodriguez-Reinoso, Chem. Commun., 2011, 47, 6840 RSC; (b) A. Wahby, J. M. Ramos-Fernandez, M. Martnez-Escandell, A. Sepulveda-Escribano, J. Silvestre-Albero and F. Rodriguez-Reinoso, ChemSusChem, 2010, 3, 974 CrossRef CAS PubMed.
- (a) N. P. Wickramaratne and M. Jaroniec, J. Mater. Chem. A, 2013, 1, 112 RSC; (b) N. P. Wickramaratne and M. Jaroniec, ACS Appl. Mater. Interfaces, 2013, 5, 1849 CrossRef CAS PubMed.
- (a) Z. Zhang, J. Zhou, W. Xing, Q. Xue, Z. Yan, S. Zhuo and S. Z. Qiao, Phys. Chem. Chem. Phys., 2013, 15, 2523 RSC; (b) X. Fan, L. Zhang, G. Zhang, Z. Shu and J. Shi, Carbon, 2013, 61, 423 CrossRef CAS PubMed; (c) Y. Zhao, L. Zhao, K. X. Yao, Y. Yang, Q. Zhang and Y. Han, J. Mater. Chem., 2012, 22, 19726 RSC; (d) D. Lee, C. Zhang, C. Wei, B. L. Ashfeld and H. Gao, J. Mater. Chem. A, 2013, 1, 14862 RSC.
- (a) Y. D. Xia, R. Mokaya, G. S. Walker and Y. Q. Zhu, Adv. Energy Mater., 2011, 1, 678 CrossRef CAS; (b) E. Masika and R. Mokaya, RSC Adv., 2013, 3, 17677 RSC; (c) C. Robertson and R. Mokaya, Microporous Mesoporous Mater., 2013, 179, 151 CrossRef CAS PubMed; (d) A. Almasoudi and R. Mokaya, J. Mater. Chem. A, 2014, 2, 10960 RSC; (e) A. Almasoudi and R. Mokaya, Microporous Mesoporous Mater., 2014, 195, 258 CrossRef CAS PubMed; (f) B. Adeniran, E. Masika and R. Mokaya, J. Mater. Chem. A, 2014, 2, 14696 RSC.
- H. Wei, S. Deng, B. Hu, Z. Chen, B. Wang, J. Huang and G. Yu, ChemSusChem, 2012, 5, 2354 CrossRef CAS PubMed.
- D. H. Everett and J. C. Powl, J. Chem. Soc., Faraday Trans. 1, 1976, 72, 619 RSC.
- (a) S. Himeno, T. Komatsu and S. Fujita, J. Chem. Eng. Data, 2005, 50, 369 CrossRef CAS; (b) Z. Yang, Y. Xia and Y. Zhu, Mater. Chem. Phys., 2013, 141, 318 CrossRef CAS PubMed; (c) C. Chen, J. Kim and W. S. Ahn, Fuel, 2012, 95, 360 CrossRef CAS PubMed.
- G. Srinivas, V. Krungleviciute, Z. X. Guo and T. Yildirim, Energy Environ. Sci., 2014, 7, 335 CAS.
- S. Yang, L. Zhan, X. Xu, Y. Wang, L. Ling and X. Feng, Adv. Mater., 2013, 25, 2130 CrossRef CAS PubMed.
- Y. Yan, X. Lin, S. Yang, A. J. Blake, A. Dailly, N. R. Champness, P. Hubberstey and M. Schroder, Chem. Commun., 2009, 1025 RSC.
- Y. X. Xia, Z. X. Yang and Y. Zhu, J. Mater. Chem. A, 2013, 1, 9365 CAS.
- J. C. Wang and S. Kaskel, J. Mater. Chem., 2012, 22, 23710 RSC.
- M. Sevilla, R. Foulston and R. Mokaya, Energy Environ. Sci., 2010, 3, 223 CAS.
- L. Schlapbach and A. Zuttel, Nature, 2001, 414, 353 CrossRef CAS PubMed.
- H. Wang, Q. Gao and J. Hu, J. Am. Chem. Soc., 2009, 131, 7016 CrossRef CAS PubMed.
- B. Panella, M. Hirscher and S. Roth, Carbon, 2005, 43, 2209 CrossRef CAS PubMed.
- K. M. Thomas, Catal. Today, 2007, 120, 389 CrossRef CAS PubMed.
- E. Masika and R. Mokaya, J. Phys. Chem. C, 2012, 116, 25734 CAS.
- X. B. Zhao, B. Xiao, A. J. Fletcher and K. M. Thomas, J. Phys. Chem. B, 2005, 109, 8880 CrossRef CAS PubMed.
- B. Fang, H. Zhou and I. Honma, J. Phys. Chem. B, 2006, 110, 4875 CrossRef CAS PubMed.
- R. Ströbel, L. Jörissen, T. Schliermann, V. Trapp, W. Schütz, K. Bohmhammel, G. Wolf and J. Garche, J. Power Sources, 1999, 84, 221 CrossRef.
- M. Jorda-Beneyto, D. Lozano-Castello, F. Suarez-Garcıa, D. Cazorla-Amoros and A. Linares-Solano, Microporous Mesoporous Mater., 2008, 112, 235–242 CrossRef CAS PubMed.
- M. de la Casa-Lillo, F. Lamari-Darkrim, D. Cazorla-Amoros and A. Linares-Solano, J. Phys. Chem. B, 2002, 106, 10930–10934 CrossRef CAS.
- J. Burress, M. Kraus, M. Beckner, R. Cepel, C. Wexler and P. Pfeifer, Nanotechnology, 2009, 20, 204026, DOI:10.1088/0957-4484/20/20/204026.
- S. S. Kaye, A. Dailly, O. M. Yaghi and J. R. Long, J. Am. Chem. Soc., 2007, 129, 14176–14177 CrossRef CAS PubMed.
- H. Furukawa, M. A. Miller and O. M. Yaghi, J. Mater. Chem., 2007, 17, 3197–3204 RSC.
- O. K. Farha, A. O. Yazaydın, I. Eryazici, C. D. Malliakas, B. G. Hauser, M. G. Kanatzidis, S. T. Nguyen, R. Q. Snurr and J. T. Hupp, Nat. Chem., 2010, 2, 944–948 CrossRef CAS PubMed.
- H. Furukawa, N. Ko, Y. B. Go, N. Aratani, S. B. Choi, E. Choi, A. Ö. Yazaydin, R. Q. Snurr, M. O'Keeffe, J. Kim and O. M. Yaghi, Science, 2010, 329, 424–428 CrossRef CAS PubMed.
- H. Nishihara, P. X. Li, L. X. Hou, M. Ito, M. Uchiyama, T. Kaburagi, A. Ikura, J. Katamura, T. Kawarada, K. Mizuuchi and T. Kyotani, J. Phys. Chem. C, 2009, 113, 3189–3196 CAS.
- N. P. Stadie, J. J. Vajo, R. W. Cumberland, A. A. Wilson, C. C. Ahn and B. Fultz, Langmuir, 2012, 28, 10057–10063 CrossRef CAS PubMed.
Footnote |
| † Electronic supplementary information (ESI) available: ESI accompanying this paper, including description of calculation of total hydrogen uptake, and 5 tables and 17 figures is available. See DOI: 10.1039/c4ta06539e |
| This journal is © The Royal Society of Chemistry 2015 |


