Sequential release of drugs from hollow manganese ferrite nanocarriers for breast cancer therapy†
B. N. Prashanth
Kumar
a,
Nagaprasad
Puvvada
bd,
Shashi
Rajput
a,
Siddik
Sarkar
c,
Swadesh K.
Das
c,
Luni
Emdad
c,
Devanand
Sarkar
c,
P.
Venkatesan
a,
Ipsita
Pal
a,
Goutam
Dey
a,
Suraj
Konar
b,
Keith R.
Brunt
d,
Raj R.
Rao
e,
Abhijit
Mazumdar
f,
Subhas C.
Kundu
*g,
Amita
Pathak
*b,
Paul B.
Fisher
c and
Mahitosh
Mandal
*a
aSchool of Medical Science and Technology, Indian Institute of Technology, Kharagpur, West Bengal – 721302, India. E-mail: mahitosh@smst.iitkgp.ernet.in; Fax: +91-3222-282221; Tel: +91-3222-283578
bDepartment of Chemistry, Indian Institute of Technology, Kharagpur, West Bengal – 721302, India. E-mail: ami@chem.iitkgp.ernet.in; Fax: +91-3222-255303; Tel: +91-3222-283312
cDepartment of Human and Molecular Genetics, VCU Institute of Molecular Genetics, VCU Massey Cancer Center, Virginia Commonwealth University, School of Medicine, Richmond, VA23298, USA
dDepartment of Pharmacology, Dalhousie Medicine New Brunswick, Dalhousie University, New Brunswick, Canada
eDepartment of Chemical and Life Science Engineering, Virginia Commonwealth University, Richmond, VA, USA
fDepartment of Clinical Cancer Prevention and Systems Biology, University of Texas, MD Anderson Cancer Center, Houston, TX 77030, USA
gDepartment of Biotechnology, Indian Institute of Technology, Kharagpur, West Bengal – 721302, India. E-mail: kundu@hijli.iitkgp.ernet.in; Fax: +91-3222-278433; Tel: +91-3222-283764
First published on 6th October 2014
Abstract
Single drug therapies for cancer are often suboptimal and may not provide long term clinical benefits. To overcome this obstacle for effective treatment the applications of two or more drugs are preferable. A limitation of multidrug use is the varying pharmacokinetics of different drugs. To overcome these impediments, we designed and synthesized multi-layered polyvinyl alcohol tethered hollow manganese ferrite nanocarriers capable of encapsulating two drugs with unique attributes of sensitivity towards tumor acidic milieu, mono-dispersive, compactness and high encapsulation efficiency. We encapsulated tamoxifen and diosgenin in the peripheral and subsequent inner layers of multilayered nanocarriers. In vitro and in vivo studies evaluated the nanocarrier uptake and retention ability of the tumor through magnetic saturation studies and elucidated the molecular mechanisms mediating drug(s)-induced apoptosis. The acidity of the tumor environment triggers extracellular dissociation of the peripheral coats resulting in release of tamoxifen blocking the estrogen receptor. The partially degraded nanocarriers localize intracellularly through endosomal escape and release diosgenin. Nanocarrier treatment reduced the cellular levels of Bcl2 and p53, while increasing the levels of Bim. This delivery system successfully embodies the sequential release of drugs and may provide a therapeutic strategy for sequentially affecting multiple targets in advanced cancers.
Introduction
Breast cancer is the most prevalent cancer among women with high mortality rates worldwide. In addition to early diagnosis and advances in therapeutic strategies, the disease persists due to metastatic progression resulting in secondary malignancies. Tamoxifen is a frequently administered hormonal therapy for estrogen receptor-positive breast cancer patients. Functionally, tamoxifen selectively blocks the effects of estrogen by competitively interacting with estrogen receptors.1,2 The majority of patients initially responsive to tamoxifen acquire gradual resistance to anti-estrogen therapy and the mechanism mediating resistance remains elusive.3,4 Statistically, one-third of patients with early stage breast cancer acquire tamoxifen resistance during the 5 year treatment. This is a major impediment for successful clinical applications.5 In addition, prolonged administration of tamoxifen exerts undesirable side effects due to toxicity that has an impact on the patient's quality of life.6 The co-administration of two or more drugs exerts its maximal efficacy by targeting different molecular pathways, thereby increasing tumor cell killing while reducing the likelihood of drug resistance frequently culminating in enhanced durability of responses in combinatorial-treated patients. However, administration of combinatorial drugs is limited due to varying pharmacokinetics of different drugs, which results in inconsistent drug uptake leading to suboptimal drug concentrations at the tumor site and off-target toxicity to normal cells.7 Developing effective cancer therapies using single or multiple modality approaches is a daunting task. Problems in drug delivery including low drug tolerance, lack of target specificity, multidrug resistance, undesired pharmacokinetics and bio-distribution represent confounding variables in successful therapeutic drug applications. To resolve these issues, nanocarrier-mediated targeted multiple drug delivery may provide a viable strategy to regulate multiple cellular signaling pathways by activating cell death in cancer cells without affecting normal cells and tissues.To increase treatment efficacy magnetic hollow nanomaterials are the foremost class of nanostructures used in numerous medical diagnostic and therapeutic applications. The delivery carriers can entrap drug(s) and nucleic acid(s) thereby directing the flow of nanocarriers under a magnetic field gradient towards specific target sites.8 The magnetic nanocarriers with biocompatibility are extensively employed in magnetic resonance imaging (MRI), hyperthermia, tissue engineering and drug delivery.9,10 Paradoxically, the magnetite nanomaterials lack stability due to spontaneous Fe2+ oxidation.11–14 Accordingly, MnFe2O4 which is resistant to Fe2+ oxidation is gaining considerable attention as an effective delivery carrier15 and also exhibits high magnetic susceptibility in comparison to other ferrite nanomaterials.15,16 The key role of magnetic targeting depends predominantly on the magnetic field gradient system that can be used by applying external magnets. The applied magnetic field has serious limitations of heat generation within tissues thus confounding the cytotoxicity of drugs in cancer treatment with cell death due to the heat generated by the nanocarriers as opposed to the direct action of the cytotoxic agent.8 Furthermore, non-ionizing electromagnetic fields employed in MRI induce genotoxic effects in normal tissues of patients exposed to scans.17 The magnetic signals generated by nanocarriers are in the microTESLA range, which is not strong enough to be detected through conventional MRI imaging, as a result a superconducting quantum interference device (SQUID) is the best alternative to reveal such signals. In this context, SQUID-based MRI is useful and advantageous over high magnetic field MRI. In this regard, we evaluated magnetic nanocarrier efficacy by employing SQUID-based vibrating sample magnetometer (VSM) measurements18 using in vitro and in vivo models.
Considerable efforts have also been expended in nanoparticle fabrication that determine the shape and size of the nanocarriers to increase the encapsulation efficiency of the holding drug/gene and for the regulated release of molecules at specific target sites.19,20 Besides the conventional fabrication procedures, hollow natured biocompatible materials are also receiving substantial interest in order to achieve regulated release of encapsulated moieties from nanocarriers with high pay loads that achieve therapeutic indices to avoid low concentrations of the drug within tumor regions.21
Compounds of natural origin may serve as potential adjuvants in enhancing the current chemotherapy for cancers. Diosgenin, a major bioactive constituent of fenugreek (Trigonellafoenumgraecum Linn) seeds22,23 is reported to inhibit pAkt expression and Akt kinase activity in breast cancer without affecting PI3 kinase levels. This results in the inhibition of its downstream targets, NF-κβ, Bcl2, survivin and XIAP.24 Pre-clinical studies involving diosgenin treatment in cancer therapy are currently in progress, and show encouraging results.25,26 However, aqueous insolubility of diosgenin is a major issue in its therapeutic administration. Nanocarrier-mediated approaches may be an improved choice for the successful administration of this drug. So far, a variety of nanodelivery systems have been synthesized and encapsulated with tamoxifen/diosgenin and evaluated for anticancer efficacy against various cancers (ESI, Table 1†).
Based on the considerations outlined above, we designed and synthesized hollow MnFe2O4 nanocarriers encapsulating tamoxifen and diosgenin and performed in vitro and in vivo assays to interrogate the molecular mechanisms affecting breast cancer cell survival following application of these dual drugs and their ability to target multiple pathways in breast cancer.
Experimental section
Materials and Reagents
Manganese chloride tetrahydrate (MnCl2·4H2O, 97%), Iron chloride anhydrous (FeCl3, 96%), and Polyvinyl alcohol (PVA, Molecular weight ∼125![[thin space (1/6-em)]](https://www.rsc.org/images/entities/char_2009.gif) 000, 75%) were purchased from Merck Ltd, Mumbai, India. Tamoxifen (≥99%) and Diosgenin (≥93%) were purchased from Sigma Aldrich, St Louis, MO, USA. All other chemicals purchased were of analytical grade and used without prior purification unless specified. Stock solutions of 10 mM diosgenin and 10 mM tamoxifen (Sigma-Aldrich, St Louis, MO, USA), were dissolved in dimethyl sulfoxide, stored at −20 °C, and diluted with fresh medium just before use. For western blotting analysis, the following antibodies were used: rabbit monoclonal anti-Bcl2, anti-Bim, anti-p53, anti-cytochrome-C and caspase9, horseradish peroxidase-conjugated goat anti-rabbit IgG, and goat anti-mouse IgG (Cell Signaling Technology, Beverly, MA, USA). Antibody dilutions were made according to the manufacturer's instructions and were 1
000, 75%) were purchased from Merck Ltd, Mumbai, India. Tamoxifen (≥99%) and Diosgenin (≥93%) were purchased from Sigma Aldrich, St Louis, MO, USA. All other chemicals purchased were of analytical grade and used without prior purification unless specified. Stock solutions of 10 mM diosgenin and 10 mM tamoxifen (Sigma-Aldrich, St Louis, MO, USA), were dissolved in dimethyl sulfoxide, stored at −20 °C, and diluted with fresh medium just before use. For western blotting analysis, the following antibodies were used: rabbit monoclonal anti-Bcl2, anti-Bim, anti-p53, anti-cytochrome-C and caspase9, horseradish peroxidase-conjugated goat anti-rabbit IgG, and goat anti-mouse IgG (Cell Signaling Technology, Beverly, MA, USA). Antibody dilutions were made according to the manufacturer's instructions and were 1![[thin space (1/6-em)]](https://www.rsc.org/images/entities/char_2009.gif) :
:![[thin space (1/6-em)]](https://www.rsc.org/images/entities/char_2009.gif) 1000 and 1
1000 and 1![[thin space (1/6-em)]](https://www.rsc.org/images/entities/char_2009.gif) :
:![[thin space (1/6-em)]](https://www.rsc.org/images/entities/char_2009.gif) 2000 for primary and secondary antibodies, respectively. Chemiluminescent peroxidase substrate, propidium iodide (PI), 4′,6-diamidino-2-phenylindole (DAPI) and 3-(4,5-dimethylthiazol-2-yl)-2,5-diphenyltetrazolium bromide (MTT) were also purchased from Sigma-Aldrich. Stock solutions of PI, DAPI, and MTT were prepared by dissolving 1 mg of each compound in 1 ml phosphate buffered saline (PBS). The solution was protected from light, stored at 4 °C, and used within 1 month. Stock concentrations of 10 mg ml−1 RNaseA (Sigma-Aldrich St Louis, MO, USA) were prepared and kept at −20 °C.
2000 for primary and secondary antibodies, respectively. Chemiluminescent peroxidase substrate, propidium iodide (PI), 4′,6-diamidino-2-phenylindole (DAPI) and 3-(4,5-dimethylthiazol-2-yl)-2,5-diphenyltetrazolium bromide (MTT) were also purchased from Sigma-Aldrich. Stock solutions of PI, DAPI, and MTT were prepared by dissolving 1 mg of each compound in 1 ml phosphate buffered saline (PBS). The solution was protected from light, stored at 4 °C, and used within 1 month. Stock concentrations of 10 mg ml−1 RNaseA (Sigma-Aldrich St Louis, MO, USA) were prepared and kept at −20 °C.
Synthesis of hollow ZnO/MnFe2O4 hybrid nanocarriers
Synthesis of carbon nanospheres was carried out through the hydrothermal method following a reported protocol with minor modifications.27 1 mM MnCl2 and 2 mM FeCl3 were mixed in 50 ml solution with stirring which results in the formation of a clear solution. To this mixture 1 g carbon nanospheres were added and then dispersed for 10 min under sonication. The resultant mixture was basified with 5 ml of ammonia, resulting in MnFe2O4 formation. From these resultant samples carbon spheres were removed by pyrolysis at 500 °C for 2 h resulting in the synthesis of hollow MnFe2O4 nanocarriers. Freshly prepared MnFe2O4 was dispersed in 20 ml ethanol followed by addition of a 1 mM alcoholic solution of ZnCl2 and kept for 10 h and separated by centrifugation resulting in the formation of ZnO/MnFe2O4 hybrid nanocarriers.27Synthesis of PVA coated ZnO/MnFe2O4 nanocarriers
PVA (3 mg) was dissolved in 5 ml of hot water; to this solution 400 mg hybrid nanocarriers were dispersed under vigorous stirring and precipitated using acetone, resulting in PVA-coated ZnO/MnFe2O4 nanocarriers. A similar procedure was followed for the preparation of tamoxifen/diosgenin-encapsulated nanocarriers followed by addition of respective drugs.Characterization of tamoxifen/diosgenin encapsulated ZnO/MnFe2O4 nanocarriers
Phase analysis of the resulting samples was determined by using a powdered X-ray diffractometer (Phillips PW1710) over 2θ in the range from 20 to 80 with a sampling time interval of 0.02 at an operating voltage of 40 mA at 40 kV. The functional groups were determined by Fourier Transformation Infrared Spectroscopy (FTIR) (Perkin RX-II, Model no. 73713, USA) within the scan range from 400 to 4000 cm−1 and the samples were prepared through KBr transparent pelleting. Transmission electron micrographs (JEOL JEM-2100, Japan) were captured with an accelerating voltage of 200 kV and the samples were prepared by dispersion of 1 mg of the sample in 3 ml of phosphate buffered saline (PBS) kept on a drop on a carbon coated grid and dried in vacuum for 10 h. Photon correlation spectroscopy and zeta potential analysis of samples were carried out using a dynamic light scattering (DLS) instrument and a Malvern NanoZetasizer (nanoseries, United Kingdom), respectively. Magnetic measurements were carried out with a vibrating sample magnetometer (VSM) using a Superconducting Quantum Interference Device (SQUID) at room temperature (EverCool SQUID VSM DC magnetometer, Quantam Design, USA). The elemental mapping of cells and tumor sections after nanocarrier treatment was determined through energy dispersion X-ray mapping (EDX) whereas, the corresponding cell and tissue morphology was visualized by field emission scanning electron microscopy (FESEM, ZEISS EVO 60, Germany). Thermogravimetric analysis (TGA) was performed for the resultant samples with a Pyris Diamond TG/DTA machine (NETZSCH STA 409 PC, Germany) with a heating rate of 10 min−1 in an alumina crucible in the presence of a nitrogen atmosphere. Drug loading and release studies were performed by reverse phase high-pressure liquid chromatography (HPLC) with a C18 column size (4.6 mm × 250 mm, 5 μm) at a wavelength of 254 nm (Wafers, USA), by employing an acetonitrile and water (75![[thin space (1/6-em)]](https://www.rsc.org/images/entities/char_2009.gif) :
:![[thin space (1/6-em)]](https://www.rsc.org/images/entities/char_2009.gif) 25, v/v) mobile phase in a gradient system at a flow rate of 1 ml per minute. Before the analysis of nanocarriers, we made a calibration curve with triplicated standards of the drug concentration in the range from 0 to 120 μg ml.28
25, v/v) mobile phase in a gradient system at a flow rate of 1 ml per minute. Before the analysis of nanocarriers, we made a calibration curve with triplicated standards of the drug concentration in the range from 0 to 120 μg ml.28
Cell culture
Human breast cancer cell lines MCF 7, T-47D and MDA-MB-231 were obtained from the National Center for Cell Science (NCCS), Pune, India and cultured using Dulbecco's modified eagle medium (DMEM) supplemented with 10% FBS and 1% penicillin–streptomycin. Cells were incubated at 37 °C in 5% CO2 in a 95% humidified incubator.Hemocompatibility assay
In this study, native drugs (tamoxifen and diosgenin), MF (empty), TMF (tamoxifen encapsulated), DGMF (diosgenin encapsulated), and DGTMF (tamoxifen and diosgenin encapsulated) nanocarriers, were individually suspended in 1× phosphate buffer saline (PBS). The hemocompatibility of these samples was analyzed using our previous protocol.29 In brief, goat blood was obtained and red blood cells (RBC) were collected by centrifugation (1500 g for 5 min at 4 °C) and a Ficoll density gradient and further procedures were carried out as described previously.In vitro cellular uptake
MCF 7 and T-47D cells (5 × 10⁴) were seeded into 30 mm plates and treated with DGTMF nanocarriers at 70% confluence, and incubated for 60, 120 and 180 min at 37 °C. The cells were subsequently harvested and analyzed with a flow cytometer by accumulating 10![[thin space (1/6-em)]](https://www.rsc.org/images/entities/char_2009.gif) 000 events. Further analysis was performed using CellQuest software (BD Bioscience, Bedford, MA, USA).29
000 events. Further analysis was performed using CellQuest software (BD Bioscience, Bedford, MA, USA).29
Prussian blue staining
Prussian blue staining was performed to evaluate tumor retention ability and uptake behavior of the nanocarrier. After sacrifice, mice tumors were fixed in paraformaldehyde (4%) and incubated with a mixture (50![[thin space (1/6-em)]](https://www.rsc.org/images/entities/char_2009.gif) :
:![[thin space (1/6-em)]](https://www.rsc.org/images/entities/char_2009.gif) 50, v/v) of 2% potassium ferrocyanide (Perls reagent). Images were recorded and digitized using Leica Qwin software. Controls were simultaneously run during each experiment. A similar procedure was repeated in the case of in vitro grown cells to elucidate the uptake of nanocarriers by cells through this staining. The unbound nanocarriers were removed by washing with PBS. Further, the phase contrast images of stained cells were captured and digitalized using Progress Capture Pro® image software, Jena, Germany.30 Each test was performed in triplicate.
50, v/v) of 2% potassium ferrocyanide (Perls reagent). Images were recorded and digitized using Leica Qwin software. Controls were simultaneously run during each experiment. A similar procedure was repeated in the case of in vitro grown cells to elucidate the uptake of nanocarriers by cells through this staining. The unbound nanocarriers were removed by washing with PBS. Further, the phase contrast images of stained cells were captured and digitalized using Progress Capture Pro® image software, Jena, Germany.30 Each test was performed in triplicate.
Exploring the uptake pathways of nanocarriers using endocytic inhibitors
The effects of several membrane entry inhibitors on the uptake of nanocarriers were examined by first incubating MCF 7 cells (1 × 10⁵ cells per ml) for 1 h at 37 °C with chlorpromazine (10 μg ml−1) to inhibit the formation of clathrin vesicles and genistein (200 μM) to inhibit the formation of caveolae.31 This was followed by treatment of cells with DGTMF nanocarriers (40 μg ml−1) for an additional 2 and 4 h. Subsequently, the cells were washed three times with PBS, collected and analyzed in a flow cytometer equipped with a 488 nm argon laser (FACSCalibur; Becton Dickinson, CA, USA). In the study, the group without any treatment (i.e., control cells) was used as the background in flow cytometry analysis, while the groups treated with only DGTMF nanocarriers, but without inhibitor treatment, were used as nanocarrier controls.To observe intracellular distribution of nanocarriers, MCF 7 cells were incubated for 2 h with DGTMF formulations. Next, LysoTracker Red (150 nM) was added and incubated with the cells for 30 min for lysosome labelling32 and the nuclei were counterstained with DAPI. Fluorescent images from the stained constructs were obtained using a confocal-laser scanning microscope (CLSM) at 20× (CLSM, Olympus FV 1000, Tokyo, Japan) equipped with Argon (488 nm) and He–Ne (534 nm) lasers.
In vitro MRI scan
MCF 7 cells were seeded at a density of 1 × 10⁵ cells per well in a 6-well culture plate. Each well was treated with increasing concentrations of nanocarriers with a final Fe concentration of 0, 5, 10, 15, 20, 30, 40, 45 and 50 μg ml−1 for 12 h in agarose. MRI scans were used on cancer cell lines with the help of MnFe2O4, which acts as a magnetic probe, by using a 3 T clinical MRI scanner (MAGNETOM Verio, Berlin, Germany) and the spin echo multisection pulse sequence was collected from MR phantom images.33 A repetition time (TR) of 5000 ms and an echo time interval of 96 ms were used. MRI signal intensities were determined through an in built syngo fast View from SIEMENS, Berlin, Germany. T2 relaxation times were calculated from the first order exponent decay curve plot and the corresponding equation was expressed as SI = Ae − Te/T2 + B; here A = amplitude and B = offset.Cellular and tumor uptake analysis by VSM measurement
MCF 7 cells subjected to 12 h DGTMF treatment were trypsinized, centrifuged and pelleted. Pelleted cells, paraffin-embedded tumor and normal tissue blocks from sacrificed mice were subjected to VSM analysis to quantitatively assess the uptake of the nanocarrier.34MTT assay
MCF 7 and T-47D (3 × 10³ cells per well) cells were seeded in 96-well plates and allowed to grow. After 24 h, cells were treated with varying concentrations of MF, TMF, DGMF, and DGTMF nanocarriers (0–140 μg ml−1) for 48 h at 37 °C. The cells were incubated in MTT dye (1 mg ml−1) containing serum free DMEM culture medium for 4 h,35 and then the medium was replaced with 100 μl DMSO to dissolve the formazan crystals of the dye. The absorbance was determined at 570 nm in a microplate reader (Bio-Rad laboratories Inc., Hercules, CA, USA).Assessment of apoptosis by flow cytometry
Cells (3 × 10⁵) were seeded on 30 mm plates and incubated at 37 °C for 24 h. Subsequently, 70% confluent cells were treated with respective IC50 concentrations of TMF, DGMF and DGTMF nanocarriers along with an equal concentration of MF and incubated for 48 h. After incubation, both dead and live cells were collected by trypsinization, and cells were washed with PBS, fixed in 70% ethanol at −20 °C and stored for 24 h. Subsequently, cells were washed with PBS, and incubated in the PI-RNase mixture (PBS containing 10 μg ml−1 of RNase A and 20 μg ml−1 of PI) for 30 min at 37 °C.36 The fluorescence intensity of the stained cells was measured by using a FACS Calibur flow cytometer (Becton Dickinson, San Jose, CA, USA). The data were analyzed by using CellQuest Pro software.SEM analysis
Morphological changes in cells subjected to nanocarrier treatment using a high-resolution scanning electron microscope (SEM) were studied to investigate membrane extensions. 1 × 10⁴ cells were grown on a sterile cover slip and treated for 48 h and further processed as described previously.37Mitochondrial membrane potential (ψm)
In order to analyze the role of mitochondria in TMF, DGMF and DGTMF nanocarrier-mediated apoptosis, changes in ψm were measured using the cationic dye rhodamine 123 (Rh 123). Briefly, MCF 7 and T-47D cells were plated at a density of 1 × 10⁵ cells per plate in a 60 mm Petri dish for 24 h and treated with drug loaded nanocarriers for 48 h. The cells were washed, harvested and incubated with Rh 123 (10 μg ml−1) in chilled PBS at 37 °C for 30 min in the dark.38 The cells were then washed twice with PBS and the fluorescence intensity was measured on the FL-1 channel of the FACS Calibur at 530 nm with 10![[thin space (1/6-em)]](https://www.rsc.org/images/entities/char_2009.gif) 000 cells.
000 cells.
Western blotting analysis
MCF 7 and T-47D cells (1 × 10⁶ cells per plate) were seeded in 100 mm culture dishes and when 70% confluence was reached the cells were treated with drug-loaded nanocarriers in serum-free medium along with the control and allowed to incubate for 24 h. Both suspended dead and adherent live cells were pelleted, lysed and immunoblotted as described previously.39In vivo breast cancer tumor xenografts
All procedures performed in animals were approved by the Institutional Animal Use and Investigation Committee at the Virginia Commonwealth University, School of Medicine, Richmond, VA, USA. Nude mice (6–8 week old and 18–22 g of weight) were maintained under pathogen-free conditions. The MDA-MB-231 breast cancer cells (1 × 10⁶) were implanted subcutaneously in the flanks of 6–7 week-old female athymic BALB/c (nu+/nu+) mice. When the tumor volume reached 100 mm3 (after 14 days), the animals were randomly assigned to seven groups (5 animals each group). Then, the tumor bearing mice were injected in the tail vein with the following: (i) sterile normal saline (control group); (ii) diosgenin (10 mg kg−1) (iii) tamoxifen (2 mg kg−1); (iv) DGMF nanocarriers (10 mg kg−1 diosgenin eq.); and (v) TMF nanocarriers (2 mg kg−1 tamoxifen eq.) (vi) DGTMF nanocarriers (5 mg kg−1 diosgenin and 1.5 mg kg−1 tamoxifen eq.) (vii) MF nanocarriers (weight equivalent of the DGTMF nanocarriers). Injections were given on every third day, with a 2 day gap between two consecutive administrations. Body weight and tumor volume of all mice were measured prior to treatment and over regular time intervals. Animals were monitored regularly for survival, tumor growth, evidence of toxicity and any change at the injection sites was monitored throughout the study. The mice were anesthetized using carbon dioxide at the end of the 3 week treatment period (21 days). The tumors were excised and measured for tumor mass and volume as performed previously.40Immunohistochemical analysis
Immunohistochemical analysis was performed using paraffin-embedded tumors of the various treatment groups using the following antibodies: anti-Bcl2, anti-Bim and anti-p53. IHC studies were performed as described previously with slight modifications.41 Images were recorded and digitized using FLUOVIEW 1000 (Version 1.2.4.0) imaging software, Tokyo, Japan.Statistical analysis
All represented data are expressed as mean ± SE. Statistical differences were evaluated by using the t-test. Results were considered statistically significant at 95% confidence interval (i.e., p < 0.05). All figures and graphical readings shown were obtained from at least three independent experiments.Results and discussion
Synthesis and characterization of hollow MnFe2O4 nanocarriers
The synthetic protocol for nanocarriers is depicted in Scheme 1 (in the ESI†). Carbon spheres serve as the organic template for the formation of hollow structures in the chemical precipitation followed by combustion. After removing the carbon sphere templates from the synthesized materials by combustion at 500 °C, the hollow MnFe2O4 particles were collected. We then loaded diosgenin and tamoxifen by tethering PVA layer by layer on the hollow MnFe2O4 nanostructure surface, which results in the formation of corresponding drugs in encapsulated nanocarriers. Previous reports have described the synthesis of hollow natured magnetic particles with elemental backbones or other templates retaining their hollow structure.42–44 We successfully synthesized octahedron shaped hollow magnetic nanocarriers for the first time in the absence of an elemental backbone or template support for reinforced drug encapsulation. These octahedron shaped MF nanocarriers encapsulated both the tamoxifen and diosgenin drugs in individual layers of multiple layers tethered with PVA on nanocarrier surfaces.The phase analysis of the prepared samples was analyzed by using a powdered X-ray diffractometer and the corresponding spectrum is provided in the ESI (Fig. S1†). The spectrum depicts the peaks corresponding to the 2θ values at 29.76, 35.06, 36.65, 42.57, 52.79, 56.21 and 61.77 of the resultant samples. The diffraction lines were consistent with the lattice planes (220), (311), (222), (400), (442), (511) and (440), respectively. The XRD pattern of the MnFe2O4 nanocarriers matched well with JCPDS data, card no. 74-2403. The synthesized nanocarriers exhibited cubic geometry with a spinel type structure. It belongs to the Fd3m space group (Z = 8). From the XRD pattern, it was clearly evident that the sample possesses a single phase and is purely crystalline due to the sharp peaks in the spectrum.
Functional group analysis was determined through FTIR spectroscopy for all of the samples and the corresponding spectrum depicted a peak at 576 cm−1 indicating the presence of a metal–oxygen bond.45 Further, the magnetic nanocarriers interact with diosgenin resulting in a characteristic peak at around 1643 cm−1 due to the C![[double bond, length as m-dash]](https://www.rsc.org/images/entities/char_e001.gif) C group.46 The peaks observed in the regions at a range of 900–1100 cm−1 and 1600–1700 cm−1 indicate the presence of tertiary amine and C
C group.46 The peaks observed in the regions at a range of 900–1100 cm−1 and 1600–1700 cm−1 indicate the presence of tertiary amine and C![[double bond, length as m-dash]](https://www.rsc.org/images/entities/char_e001.gif) C functional groups, respectively. The peak at 3000 cm−1 annotates a –COOH band resulting from tamoxifen encapsulation.47 Similar peaks observed in DGTMF revealed the presence of diosgenin and tamoxifen (provided in the ESI Fig. S1†).
C functional groups, respectively. The peak at 3000 cm−1 annotates a –COOH band resulting from tamoxifen encapsulation.47 Similar peaks observed in DGTMF revealed the presence of diosgenin and tamoxifen (provided in the ESI Fig. S1†).
The particle size and morphology of prepared samples were analyzed through TEM, where the size of MF was found to be 40–60 nm. Upon coating of these nanocarriers the size was increased to 60–110 nm. However, drug encapsulation did not affect the size of the nanocarrier. In addition, ZnO quantum dots exhibited a spherical morphology of 5–10 nm in size in the prepared sample (Fig. 1A). We have found through TEM analysis that the core sizes of the nanocarriers are in the range of 43–54 nm.
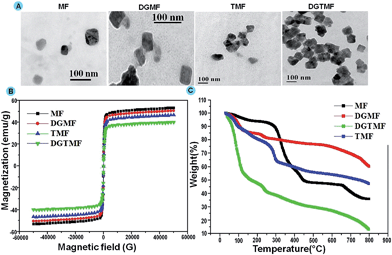 | ||
| Fig. 1 (A) TEM images of MF, DGMF, TMF and DGTMF, (B) VSM analysis of MF, DGMF, TMF and DGTMF, and (C) TGA analysis of MF, DGMF, DGTMF and TMF. | ||
The VSM measurement was performed on prepared samples at 300 K as depicted in Fig. 1B. The resultant samples revealed high magnetization and all the samples exhibited magnetic saturation <80 emu g−1, which is less than the bulk value. These particles exhibited high magnetization performance associated with superparamagnetism, which was a good sign for MRI imaging for in vitro and in vivo studies in cancer biology.48
TGA of synthesized nanocarriers showed decomposition during heating up to 800 °C from room temperature (Fig. 1C) and 10% weight loss was observed in all resultant samples due to the presence of absorbed moisture at a temperature range of 100 to 150 °C. Subsequent exposure of drug encapsulated nanocarriers to high temperatures (200 to 300 °C) revealed a weight loss up to 40% due to loss of polymer and drugs. At the same temperature, 45% weight reduction was observed for DGTMF due to the charring of dual drugs. Furthermore, additional weight loss was observed in resultant samples on exposure to high temperature (600 to 700 °C) due to the removal of residual carbon.
XRD confirmed the single-phase existence and crystallinity of the carriers. The characteristic peaks in FTIR spectroscopy and TGA analysis confirmed the drug entrapment in MF particles, whereas the encapsulation efficiency of the drugs was determined through HPLC. In addition to TEM, the particle size and distribution of the prepared samples were analyzed by DLS (Fig. 2A). The positive charge on the surface of MF particles under differential pH conditions was determined by zeta potential analysis (data not shown). Further, DLS data is well consistent with TEM data shown in the ESI (Fig. S7†). However, the size of the nanocarrier was unaffected by drug encapsulation. Further, we performed DLS analysis of the nanocarriers in the presence of cyclo-hexane (a nonpolar solvent), which indicated the absence of hydrogen bonding in the particle aggregation, Fig. S5.† We also carried out DLS of DGTMF in PBS, cell culture and protein media and we did not observe any changes in particle size distributions, Fig. S6.† In addition, the nanoparticle size distribution has been around 232 nm.
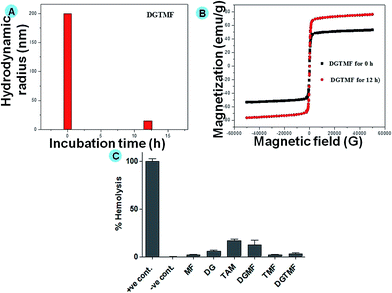
The prepared nanocarriers exhibited positive surface charges above pH 6.4 (acidic conditions), and below this pH the surface charge became negative, thus releasing their payloads. This is evident by the loss of structure in DLS size analysis due to dissolution of the PVA coatings (Fig. 2A) and concomitant increase in magnetic saturation by VSM (Fig. 2B) after 12 h in pH 5.2 PBS. Additionally, the encapsulation efficacy of tamoxifen and diosgenin was evaluated through HPLC in the range of 69 and 85%, respectively. The release profile of tamoxifen and diosgenin for less than 24 h at pH 7 was negligible (provided in the ESI, Fig. S2†). Upon 48 h incubation of these nanocarriers significant release of tamoxifen and diosgenin at pH 5 and insignificant release was found at pH 7. The significant release of drugs was due to dissolution of PVA under acidic conditions and increased viscosity of the solution.49 A prolonged incubation (more than 60 h) caused 90% drug release under acidic conditions and 19% for neutral conditions. This indicates the controlled release of the drug in an acidic environment through the diffusion mechanism.
Hemocompatibility assay
Assessing hemolytic activity is a critical step in evaluating the biocompatibility of a systemically administered material and quantifying its erythrocyte damaging properties through release of hemoglobin. In this study, native diosgenin and tamoxifen exhibited minimal hemolysis, which may be due to its higher antioxidant potential in biological systems (Fig. 2C). However, DGMF, TMF and DGTMF exhibited significantly lower hemolytic activities (less than 5%), which can be attributed to the rigid nature of the MF. A rigid molecule is less prone to attachment to the red blood cell membrane than a flexible molecule. This would explain the low hemolytic activity of DGMF, TMF and DGTMF.Cellular uptake of drug loaded nanocarriers
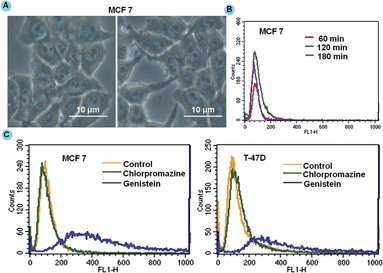
To improve the therapeutic potential of nanocarrier-based carriers for intracellular drug delivery, it is imperative to understand the cellular uptake mechanism and the intracellular trafficking of nanocarriers.31 To confirm the localization, we performed Prussian blue staining of MCF 7 cells after 4 h of DGTMF treatment indicating a persistently visible blue color in the cytoplasm of these cells. The blue color in the cytoplasmic regions of the cell confirms the accumulation of the nanocarriers (Fig. 3A).A time-dependant uptake study was conducted using MF nanocarriers to investigate the passive accumulation of nanocarriers inside cancerous cells. Flow cytometric results in both MCF 7 and T-47D cell lines showed that the mean fluorescence intensity of nanocarriers was achieved maximally after 4 h. The maximum uptake of nanocarriers occurred in the initial period of incubation of 1 and 2 h (Fig. 3B) and respective geometric means analysis is provided in the ESI (Fig. S3†). Overall, the fluorescence intensity of nanocarrier-treated cells was gradually increased due to cellular uptake following an extended incubation time indicating higher accumulation by cancerous cells.
The internalization process of drug-loaded nanocarriers and their intracellular dispersion were monitored. The intracellular fate of macromolecular carriers is strongly affected by the route of entry. In an endeavor to define the uptake mechanisms involved in the cellular entry of drug-loaded nanocarriers, two endocytic inhibitors, (chlorpromazine to inhibit clathrin-mediated endocytosis and genistein a selective inhibitor of caveolae-mediated endocytosis) were employed.31 When cells were incubated with chlorpromazine prior to nanocarrier treatment, the peak shift was not observed with respect to that of cells not treated with chlorpromazine. When the cells were pre-incubated with genistein and then subjected to treatment, nanocarrier uptake was not significantly affected indicating that clathrin-mediated endocytosis pathways may be responsible for higher uptake of nanocarriers in both cell lines (Fig. 3C). The positive charge species of metal ions in MnFe2O4 facilitated binding to negatively charged cell membranes followed by internalization via endocytosis.50 The clathrin-mediated cellular uptake of DGTMF carriers was confirmed by employing specific endocytic inhibitors. Endosomal escape is a physiological event likely resulting from endosome swelling and rupture.
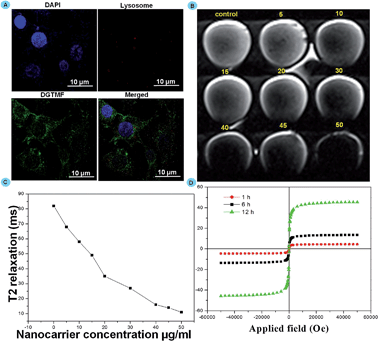
To determine the endosomal escape mechanisms of MF nanocarriers in the cytoplasm we employed a lysosomal visualization dye. MF efficiently escaped from the lysosomes, the lysosomal compartment of the MCF 7 cells was stained with LysoTracker Red after treatment with DGTMF (containing green fluorescence). After 2 h treatment with DGTMF, abundant green spots (DGTMF) were clearly separated from the red spots (LysoTracker Red) (Fig. 4A). These results indicate that niosomes have significantly escaped from the lysosomes. The presence of OH functional groups is likely to form a pH-sensitive interlayer on the nanocarrier surface which undergoes hydrophobic/hydrophilic transition in the acidic lysosomal compartments and drugs will form the core to encapsulate hydrophobic drugs that are released at the tumor site from the nanocarrier. Endosomes ruptured as a result of influx of protons created in an acidic milieu that stimulated the dissolution of the subsequent layers ensuring the cytosolic delivery of its contents.51 Thus, the partially degraded DGTMF carriers discharged into the cytoplasm after acid-triggered release, which resulted in the subsequent release of diosgenin into cancer cells.
Magnetic resonance imaging (MRI), VSM analysis and endosomal escape studies
Internalization of the nanoformulation in MCF 7 cells was assessed by Magnetic Resonance phantom Imaging (MRI). MRI was applied using cancer cell lines in vitro with nanocarrier (DGTMF) concentrations at a range of (0 to 50 μg ml−1) and incubated for 12 h in agarose. This imaging negatively enhanced the effect of all agents in T2-weighted images and the T2 signal intensity decreased according to the iron concentration. The T2 weighted MRI images in cells were collected and nanocarrier presence inside the cancer cell depicts significant reduction in relaxation time when compared with the control (Fig. 4B). The dark signal intensity increased indicating that the nanocarrier uptake increased with various concentrations (Fig. 4C). The T2-weighted images of cells incubated with empty nanocarriers at 50 μg ml−1 appear to be the darkest while the darkness increases in the T2-weighted images of cells incubated with 5–45 μg ml−1 nanocarriers with increasing iron concentrations. From this study we determined the cellular uptake saturation of nanocarriers for varying concentrations at particular time intervals.We additionally affirmed the disorganization of the nanocarriers in an acidic tumor environment through VSM analysis. The hysteresis curves were found to increase gradually until 6 h treatment in in vitro grown cells and further incubation did not cause any increase in magnetic saturations. Interestingly, after 12 h incubation we observed an additional profound increase of magnetic saturation in 6 h treated cells due to collapse of the nanocarrier resulting in generation of subfragments with small size results that coincide with magnetic measurement results (Fig. 4D).
Cell proliferation assay
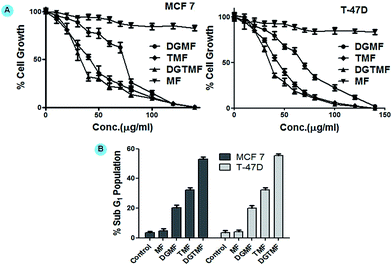
Growth inhibition of TMF, DGMF and DGTMF was monitored in MCF 7 and T-47D cells using MTT assays. Nanoformulated drugs significantly inhibit cell proliferation in a dose-dependent manner. The IC50 value of the DGMF on MCF 7 and T-47D cell was found to be 70.50 ± 1.5 and 68.69 ± 1.2 μg ml−1, respectively and TMF showed 44.52 ± 1.3 and 44.98 ± 0.7 μg ml−1, respectively, while DGTMF treatment resulted in 37.66 ± 1.6 and 38.23 ± 1.0 μg ml−1, respectively. Furthermore, dual DGTMF nanocarriers displayed lower cell proliferation compared with TMF and DGMF nanocarriers, which might be due to the combinatorial efficacy of these drugs (Fig. 5A). In summary, enhanced growth inhibition mediated by the DGTMF nanoformulation might be ascribed to the concomitant release of drugs and their efficacy. This causes an elevated intracellular concentration of drugs in the cells. As expected, the empty MF nanocarriers did not show growth inhibitory activity on either cell type at an equivalent weight to the DGTMF nanocarriers. This observation substantiated that the activity of nanoformulation of drugs (both single and dual) on MCF 7 and T-47D cells was due to the release of tamoxifen and diosgenin from the carrier.Cell cycle analysis
In order to establish whether the reduction in proliferation of breast cells due to diosgenin and/or tamoxifen was a consequence of changes in cell cycle progression, MCF 7 and T-47D cells were cultured in the presence of TMF, DGMF and DGTMF nanocarriers for 48 h and cell cycle distribution was analyzed by flow cytometry. Upon DGTMF treatment (Fig. 5B), MCF 7 and T-47D cells showed sub-G1 accumulation to 52.73 ± 0.87 and 55.7 ± 0.95%, irrespective of the total cell population within 48 h, whereas in TMF treatment sub-G1 accumulation was found to be 32.12 ± 0.65 and 32.27 ± 0.52%, respectively. On the other hand, the percentage of sub-G1 population was found to be 19.81 ± 0.44 and 20.33 ± 0.30% in MCF 7 and T-47D cells, respectively following DGMF treatment and respective histograms are provided in the ESI (Fig. S4†). Comparatively, the increase in the sub-G1 population parallels the changes in the MTT experiments. However, MF nanocarriers showed non-significant change in the sub-G1 population in both cell types suggesting that apoptotic induction is due to drug release. The strongest effect on accumulation of the sub-G1 population was temporally observed following DGTMF treatment. These results suggest that the therapeutic efficacy of DGTMF results by inducing enhanced sub-G1 accumulation reflecting increased apoptosis in comparison to TMF and DGMF nanocarrier treatment.SEM analysis
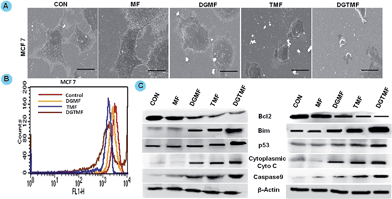
High resolution SEM is a vital tool for the analysis of surface and morphological features of cancer cells. In these contexts, SEM was used to analyze the minute morphological changes taking place in the nanoformulated drug-treated MCF 7 cells (Fig. 6A). Control cells were flat and smooth, slender and had filamentous lateral cell membrane extensions reflecting their highly motile behavior. The TMF- and DGMF-treated cells showed a thickened morphology, small ruffles, and irregular retraction of the cytoplasm from the substratum and fewer cell membrane extensions, which were more prominent in DGTMF-treated cells. In contrast, MF treatment resulted in minimal morphological changes. These results suggest that biologically active nanocarriers stimulate interaction between the drug and cells.Mitochondrial membrane potential (Δψm)
Activation of mitochondrial signaling pathways can modify the outer mitochondrial membrane permeabilization by causing the subsequent release of pro-apoptotic factors, such as cytochrome c, into the cytosol. From ψm analysis, control MCF 7 cells elicited maximal Rh 123 fluorescence and accumulation of the lipophilic dye suggesting intact and functional mitochondria. TMF, DGMF and DGTMF treatment resulted in a rapid time-dependent decrease of ψm (Fig. 6B). In particular, DGTMF nanocarrier treatment caused a greater reduction of ψm due to depolarization of cells leading to a leftward shift of the peak as compared to TMF and DGMF nanocarrier treatments. Overall, nanocarrier treatments showed significant disruption of the mitochondrial membrane potential ψm (data not shown for T-47D). The regulation of proteins indicates the mitochondrial involvement in apoptotic induction in both the cell lines (Fig. 6C).In vivo EDX mapping and VSM measurements
EDX is the most efficient technique employed to detect the presence and spatial distribution of elements in the sample. To further confirm tumor localization of nanocarriers, Energy-dispersive X-ray spectroscopy (EDX) and mapping were performed to validate the presence of nanocarriers at the tumor site. The presence of nanocarriers in the in vivo model through EDX elemental mapping and spectra was tested. The elemental mapping analysis revealed the presence of Mn (red), Fe (green), Zn (orange), oxygen (yellow) and carbon (blue) elements in tumor samples and the corresponding morphology and spectra are depicted in Fig. 7A and B. Accordingly, the tumor specificity of the nanocarriers was documented.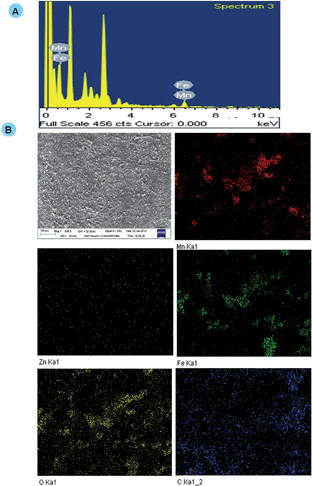 | ||
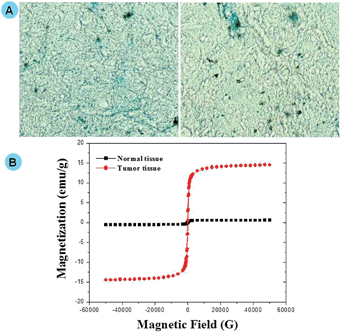
| Fig. 7 (A) EDX spectra of the tumor section of DGTMF-treated mice. (B) FESEM image of the tumor section and the corresponding EDX mapping Mn (red), Fe (green), Zn (orange), O (yellow), and C (blue). | ||
In vivo distribution of Prussian blue stain in DGTMF-treated tumor samples confirmed the localization of MF nanocarriers (Fig. 8A). Magnetic saturation was observed in tumors of mice treated with DGTMF (MF, DGMF, and TMF data not shown) and when subjected to VSM analysis, no significant magnetization was found in normal tissues. The in vivo analyses confirm the tumor specificity and localization of the nanocarriers (Fig. 8B).
Our results establish strong correlations between tumor acidic milieu-mediated disorganization of nanocarriers and their tumor localization through VSM and EDX elemental mapping analysis.
Tumor xenografts
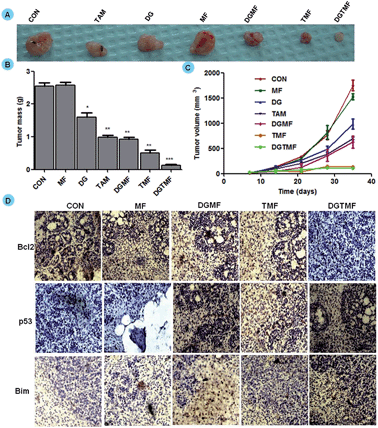
To validate the therapeutic efficacy of the nanocarrier-based treatment, randomly sorted mice bearing MDA-MB-231 xenograft tumors were divided into seven treatment groups. The palpable tumors were detected by day 14 of post-implantation, which is when treatment started and continued every third day for 21 days. The mice injected with PBS and MF nanocarriers formed large tumors and consequently all the animals were euthanized. As shown in Fig. 9A, treatment with TMF and DGMF-nanocarriers with a single drug alone and in drug combination DGTMF nanocarriers resulted in significant tumor growth inhibition as compared with the empty nanocarriers and the PBS control group. All animals in their respective groups that were treated with native diosgenin and tamoxifen showed a larger tumor at equivalent doses of nanocarrier-encapsulated drugs, suggesting that nanoformulation enhances the cellular uptake of drugs thereby increasing the antitumor efficacy with a reduction in toxicity. All the comparisons were provided graphically with statistical analysis (p = 0.0002, n = 5, unpaired t-test). There was a significant reduction in the tumor size and mass (Fig. 9B and C) after DGTMF nanocarrier-treatment compared to tamoxifen, diosgenin or DGMF and TMF treatment.Western blotting and immunohistochemical analysis
Western blotting confirmed the apoptotic role of diosgenin and tamoxifen as native and nanoformulated drugs in both MCF 7 and T-47D cells. There was a decrease in the levels of anti-apoptotic Bcl2 expression and an increase in the levels of p53, Bim, cytoplasmic cyto-C and cleaved caspase-9 proteins upon nanoformulated drug treatment (Fig. 6C) and the native drug treatment (data not shown). Our results indicate that DGTMF nanocarrier-treatment reduces Bcl2 and increases Bim expression, which in turn leads to p53-mediated apoptosis in both cell lines. The apoptotic effect of native and nanoformulated drugs on paraffin-embedded, sections was evaluated using immunohistochemistry. The expression pattern of Bcl2, Bim and p53 correlated with the protein profiles in the Western blots suggesting anti-proliferative and pro-apoptotic activity of DGTMF nanocarrier treatment (Fig. 9D).The conventional mechanism of ER action involves binding of estrogen to its receptors, receptor dimerization and binding to estrogen response elements (EREs) situated in the promoter region of target genes. The anti-estrogen activity of tamoxifen represses the transcriptional regulation of cyclin D1 and affects cell proliferation.52 In this study, the extracellular release of tamoxifen from the nanocarriers blocks the ER and impedes cell proliferation through inhibition of ER-mediated transcriptional responses.
Aberrant expression and activity of tumor suppressors and survival factors within cells lead to the onset of hallmarks of cancer like dysregulation of cell proliferation and apoptosis.53 The p53 tumor suppressor gene is the most commonly mutated gene in human cancer. This gene exerts its effect by inducing cell cycle arrest or apoptosis in response to a variety of stresses, such as DNA damage, oncogene activation, and hypoxia.54
Alterations in the mitochondrial structure and function play a crucial role in caspase9-dependent apoptosis55 by releasing apoptotic factors from the mitochondria including cytochrome c.56 In this manner, the released cytochrome c interacts with Apaf-1 and procaspase9 to form the apoptosome. Then caspase9 cleaves and activates caspase3, the executioner caspase, which activates endonucleases leading to DNA fragmentation subsequently inducing apoptosis.55 Our mitochondrial membrane potential study confirms apoptosis induction due to loss in Δψm causing mitochondrial membrane disruption. Western blotting and immunohistochemical results further demonstrate a decrease in the level of anti-apoptotic Bcl2 expression and an increase in the levels of pro-apoptotic Bim, and p53 proteins following DGMF, TMF and DGTMF treatment. The caspase9 cleavage and cytochrome c release are responsible for inducing the mitochondrial-mediated apoptotic cascade, which corresponds with the previous results.57 These findings are consistent with our results obtained from cell proliferation, flow cytometry, and morphological investigations.
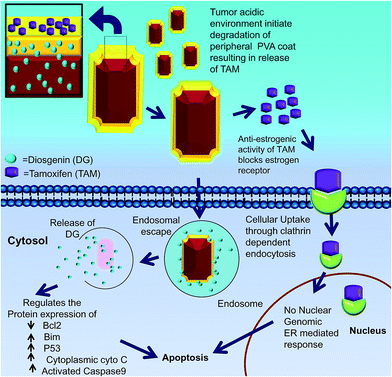
Our data support a hypothetical model in which cells take up DGTMF. The extracellular acidic environment at the tumor site causes tamoxifen to be released thereby blocking estrogen receptor (ER) signaling. Subsequently, the partially degraded internalized nanocarrier release diosgenin into the cytoplasm after the endosomal escape in cells (Fig. 10).
Another possible mechanism of DGTMF accumulation at specific tumor target sites may include leaky blood vessels due to the presence of nanocarriers. This accumulation in tumor sites was confirmed through Prussian blue staining, EDX spectra and elemental mapping of tumor sections.
Conclusions
This report describes an innovative cancer therapeutic approach for the sequential release of two cytotoxic agents in breast cancer cells by means of nanocarriers. The unique hollow nanocarriers exhibit an octahedron shape, tethered with multilayered PVA coats where tamoxifen is in the outer layer, while diosgenin is in the subsequent inner layers and the core of the nanocarrier. Uniquely, this carrier can harbor two or more drugs simultaneously based on the number of PVA tethered coats on the nanocore. These nanocarriers possess high encapsulation efficiency, monodispersive properties and compactness. This study describes the combination of endocrine and chemotherapy approaches. The acidic milieu triggers the initial extracellular solubilization of the peripheral PVA coats resulting in the release of tamoxifen. This makes them available to the estrogen receptors, and these partially degraded nanocarriers are localized intracellularly through endosomal escape to discharge diosgenin. Using this therapeutic approach, the cellular levels of the antiapoptotic Bcl2 protein decreased, and the proapoptotic Bim and tumor suppressor p53 proteins were induced, promoting apoptosis as affirmed by the mitochondrial membrane potential, protein profiling and immunohistochemical investigations. These results confirm the exceptional tumor-targeting abilities of DGTMF nanocarriers. This treatment modality holds promise for the treatment of ER positive breast cancer cells as well as other neoplastic diseases. The sequential release of the two drugs through this delivery system has significant potential for clinical cancer therapies through targeting multiple cancer cell signaling molecules, thus affecting tumor growth and survival.Acknowledgements
This study was supported by grants from the Department of Biotechnology (DBT), the Council of Scientific and Industrial Research (CSIR) and the Department of Science and Technology (DST), India. Research support was also provided through the Genetic Enhancement Fund of the Department of Human and Molecular Genetics and the VCU Institute of Molecular Medicine. PBF holds the Thelma Newmeyer Corman Chair in Cancer Research at the VCU Massey Cancer Center.Notes and references
- B. Fisher and J. P. Costantino, J. Natl. Cancer Inst., 2006, 98, 643–644 CrossRef PubMed.
- M. Clemons, S. Danson and A. Howell, Cancer Treat. Rev., 2002, 28, 165–180 CrossRef CAS.
- V. Tiong, A. M. Rozita, N. A. Taib, C. H. Yip and C. H. Ng, World J. Surg., 2014, 2288–2296 CrossRef CAS PubMed.
- J. Koren, 3rd, Y. Miyata, J. Kiray, J. C. O'Leary, 3rd, L. Nguyen, J. Guo, L. J. Blair, X. Li, U. K. Jinwal, J. Q. Cheng, J. E. Gestwicki and C. A. Dickey, PLoS One, 2012, 7, e35566 Search PubMed.
- M. M. Heckler, H. Thakor, C. C. Schafer and R. B. Riggins, FEBS J., 2014, 2431–2442 CrossRef CAS PubMed.
- H. L. Martin, L. Smith and D. C. Tomlinson, Breast Cancer, 2014, 6, 1–13 CrossRef CAS PubMed.
- B. Al-Lazikani, U. Banerji and P. Workman, Nat. Biotechnol., 2012, 30, 679–692 CrossRef CAS PubMed.
- R. Sensenig, Y. Sapir, C. MacDonald, S. Cohen and B. Polyak, Nanomedicine, 2012, 7, 1425–1442 CrossRef CAS PubMed.
- H. H. Yang, S. Q. Zhang, X. L. Chen, Z. X. Zhuang, J. G. Xu and X. R. Wang, Anal. Chem., 2005, 77, 354 CrossRef CAS.
- H. H. Yang, S. Q. Zhang, X. L. Chen, Z. X. Zhuang, J. G. Xu and X. R. Wang, Anal. Chem., 2004, 76, 1316–1321 CrossRef CAS PubMed.
- G. Reiss and A. Hutten, Nat. Mater., 2005, 4, 725–726 CrossRef CAS PubMed.
- M. Brahler, R. Georgieva, N. Buske, A. Muller, S. Muller, J. Pinkernelle, U. Teichgraber, A. Voigt and H. Baumler, Nano Lett., 2006, 6, 2505–2509 CrossRef CAS PubMed.
- S. K. Sahoo, F. Dilnawaz, A. Singh and C. Mohanty, Biomaterials, 2010, 31, 3694–3706 CrossRef PubMed.
- I. Willner and E. Katz, Angew. Chem., Int. Ed., 2004, 43, 6042–6108 CrossRef PubMed.
- J. Lu, S. Ma, J. Sun, C. Xia, C. Liu, Z. Wang, X. Zhao, F. Gao, Q. Gong, B. Song, X. Shuai, H. Ai and Z. Gu, Biomaterials, 2009, 30, 2919–2928 CrossRef CAS PubMed.
- D.-H. Kim, D. E. Nikles and C. S. Brazel, Materials, 2010, 3, 4051–4065 CrossRef CAS PubMed.
- V. Hartwig, G. Giovannetti, N. Vanello, M. Lombardi, L. Landini and S. Simi, Int. J. Environ. Res. Public Health, 2009, 6, 1778–1798 CrossRef PubMed.
- J. Hong, E. Bekyarova, W. A. de Heer, R. C. Haddon and S. Khizroev, ACS Nano, 2013, 7, 10011–10022 CrossRef CAS PubMed.
- E. C. Dreaden, L. A. Austin, M. A. Mackey and M. A. El-Sayed, Ther. Delivery, 2012, 3, 457–478 CrossRef CAS.
- M. Caldorera-Moore, N. Guimard, L. Shi and K. Roy, Expert Opin. Drug Delivery, 2010, 7, 479–495 CrossRef CAS PubMed.
- J. You, G. Zhang and C. Li, ACS Nano, 2010, 4, 1033–1041 CrossRef CAS PubMed.
- W. G. Taylor, J. L. Elder, P. R. Chang and K. W. Richards, J. Agric. Food Chem., 2000, 48, 5206–5210 CrossRef CAS PubMed.
- Int. J. Toxicol., 2004, 23, 2 suppl, 49–54 Search PubMed.
- S. Srinivasan, S. Koduru, R. Kumar, G. Venguswamy, N. Kyprianou and C. Damodaran, Int. J. Cancer, 2009, 125, 961–967 CrossRef CAS PubMed.
- Z. He, H. Chen, G. Li, H. Zhu, Y. Gao, L. Zhang and J. Sun, Phytomedicine, 2014, 871–876 CrossRef PubMed.
- R. Y. Mohammad, G. Somayyeh, H. Gholamreza, M. Majid and R. Yousef, Asian Pac. J. Cancer Prev., 2013, 14, 6945–6948 CrossRef.
- H.-S. Qian, Y. Hu, Z.-Q. Li, X.-Y. Yang, L.-C. Li, X.-T. Zhang and R. Xu, J. Phys. Chem. C, 2010, 114, 17455–17459 CAS.
- P. Venkatesan, N. Puvvada, R. Dash, B. N. Prashanth Kumar, D. Sarkar, B. Azab, A. Pathak, S. C. Kundu, P. B. Fisher and M. Mandal, Biomaterials, 2011, 32, 3794–3806 CrossRef CAS PubMed.
- P. Venkatesan, N. Puvvada, R. Dash, B. N. P. Kumar, D. Sarkar, B. Azab, A. Pathak, S. C. Kundu, P. B. Fisher and M. Mandal, Biomaterials, 2011, 32, 3794–3806 CrossRef CAS PubMed.
- Y. Ling, K. Wei, Y. Luo, X. Gao and S. Zhong, Biomaterials, 2011, 32, 7139–7150 CrossRef CAS PubMed.
- S. Acharya and S. K. Sahoo, Biomaterials, 2011, 32, 5643–5662 CrossRef CAS PubMed.
- D. W. Dong, B. Xiang, W. Gao, Z. Z. Yang, J. Q. Li and X. R. Qi, Biomaterials, 2013, 34, 4849–4859 CrossRef CAS PubMed.
- H. Wu, G. Liu, Y. Zhuang, D. Wu, H. Zhang, H. Yang, H. Hu and S. Yang, Biomaterials, 2011, 32, 4867–4876 CrossRef CAS PubMed.
- Y.-C. Chuang, C.-J. Lin, S.-F. Lo, J.-L. Wang, S.-C. Tzou, S.-S. Yuan and Y.-M. Wang, Biomaterials, 2014, 35, 4678–4687 CrossRef CAS PubMed.
- B. N. Singh, J. Fu, R. K. Srivastava and S. Shankar, PLoS One, 2011, 6, e27306 CAS.
- S. Rajput, B. N. Kumar, K. K. Dey, I. Pal, A. Parekh and M. Mandal, Life Sci., 2013, 93, 783–790 CrossRef CAS PubMed.
- P. Venkatesan, S. Banerjee, S. Das, R. K. Sen and M. Mandal, Cancer Nanotechnol., 2011, 2(1–6), 67–79 Search PubMed.
- P. Venkatesan and C. Mandal, Ann. Oncol., 2010, 21, I60–I61 Search PubMed.
- B. N. Kumar, S. Rajput, K. K. Dey, A. Parekh, S. Das, A. Mazumdar and M. Mandal, BMC Cancer, 2013, 13, 273 CrossRef CAS PubMed.
- S. Rajput, B. N. Kumar, S. Sarkar, S. Das, B. Azab, P. K. Santhekadur, S. K. Das, L. Emdad, D. Sarkar, P. B. Fisher and M. Mandal, PLoS One, 2013, 8, e61342 CAS.
- S. Sarkar, A. Mazumdar, R. Dash, D. Sarkar, P. B. Fisher and M. Mandal, Cancer Biol. Ther., 2010, 9, 592–603 CrossRef CAS.
- J. Yu, R. Hao, F. Sheng, L. Xu, G. Li and Y. Hou, Nano Res., 2012, 5, 679–694 CrossRef CAS.
- H. Ma, J. Tarr, M. A. DeCoster, J. McNamara, D. Caruntu, J. F. Chen, C. J. O'Connor and W. L. Zhou, J. Appl. Phys., 2009, 105, 07B309 Search PubMed.
- T. Kim, E. Momin, J. Choi, K. Yuan, H. Zaidi, J. Kim, M. Park, N. Lee, M. T. McMahon, A. Quinones-Hinojosa, J. W. M. Bulte, T. Hyeon and A. A. Gilad, J. Am. Chem. Soc., 2011, 133, 2955–2961 CrossRef CAS PubMed.
- M. Goodarz Naseri, E. B. Saion and A. Kamali, ISRN Nanotechnol., 2012, 2012, 11 Search PubMed.
- K. Pazhanichamy, K. Bhuvaneswari, B. Kunthavai, T. Eevera and K. Rajendran, J. Planar Chromatogr.--Mod. TLC, 2012, 25, 566–570 CrossRef CAS.
- E. Bilensoy, L. Doğan, M. Şen and A. Hıncal, J. Inclusion Phenom. Macrocyclic Chem., 2007, 57, 651–655 CrossRef CAS.
- L.-X. Yang, F. Wang, Y.-F. Meng, Q.-H. Tang and Z.-Q. Liu, J. Nanomater., 2013, 2013, 5 Search PubMed.
- W. Wang, D. Cheng, F. Gong, X. Miao and X. Shuai, Adv. Mater., 2012, 24, 115–120 CrossRef CAS PubMed.
- I. A. Khalil, K. Kogure, H. Akita and H. Harashima, Pharmacol. Rev., 2006, 58, 32–45 CrossRef CAS PubMed.
- S. T. Guo, Y. Y. Huang, Q. A. Jiang, Y. Sun, L. D. Deng, Z. C. Liang, Q. A. Du, J. F. Xing, Y. L. Zhao, P. C. Wang, A. J. Dong and X. J. Liang, ACS Nano, 2010, 4, 5505–5511 CrossRef CAS PubMed.
- X. Yu, X. Zhang, I. B. Dhakal, M. Beggs, S. Kadlubar and D. Luo, BMC Cancer, 2012, 12, 29 CrossRef CAS PubMed.
- D. Hanahan and R. A. Weinberg, Cell, 2011, 144, 646–674 CrossRef CAS PubMed.
- C. Corbiere, B. Liagre, F. Terro and J. L. Beneytout, Cell Res., 2004, 14, 188–196 CrossRef CAS PubMed.
- D. Green and G. Kroemer, Trends Cell Biol., 1998, 8, 267–271 CrossRef CAS.
- J. Cai, J. Yang and D. P. Jones, Biochim. Biophys. Acta, 1998, 1366, 139–149 CrossRef CAS.
- C. Liu, Y. Wang, S. Xie, Y. Zhou, X. Ren, X. Li and Y. Cai, Phytother. Res., 2011, 25, 277–283 CAS.
Footnote |
| † Electronic supplementary information (ESI) available: Table 1, Scheme 1, XRD and FTIR analysis, drug release studies, Geometric mean analysis of cellular uptake, and Histogram plots. See DOI: 10.1039/c4tb01098a |
| This journal is © The Royal Society of Chemistry 2015 |

