Fluorescence turn-on detection of mercury ions based on the controlled adsorption of a perylene probe onto the gold nanoparticles†
Juanmin
Li
ab,
Jian
Chen
a,
Yang
Chen
ab,
Yongxin
Li
a,
Sohail Anjum
Shahzad
ac,
Yan
Wang
ab,
Meiding
Yang
ab and
Cong
Yu
*ab
aState Key Laboratory of Electroanalytical Chemistry, Changchun Institute of Applied Chemistry, Chinese Academy of Sciences, Changchun 130022, P. R. China. E-mail: congyu@ciac.ac.cn; Fax: (+86) 431-8526-2710
bUniversity of Chinese Academy of Sciences, Beijing 100049, P. R. China
cDepartment of Chemistry, COMSATS Institute of Information Technology, Abbottabad 22060, Pakistan
First published on 16th November 2015
Abstract
A novel fluorescence turn-on strategy based on Au nanoparticles and a perylene probe for the sensing of Hg2+ ions has been developed. It was observed that a perylene probe could be adsorbed onto the surface of Au NPs through strong electrostatic and hydrophobic interactions. Its fluorescence was efficiently quenched by the Au nanoparticles. However, in the presence of Hg2+ and NaBH4, Hg2+ was reduced and an Au/Hg amalgam was formed on the surface of the Au nanoparticles. The perylene probe could hardly be adsorbed and quenched by the Au/Hg amalgam. A turn on fluorescence signal was therefore detected. The assay is quite sensitive, and 5 nM Hg2+ could be easily detected. It is also very selective, a number of metal ions were tested and no noticeable interference was observed. The assay was also successfully applied for the determination of Hg2+ in lake water samples. A simple, fast, inexpensive, highly sensitive and selective Hg2+ sensing strategy is therefore established.
Introduction
The mercury ion (Hg2+) is one of the most toxic heavy metal ions. It has serious deleterious effects on the environment and human health.1 It has been demonstrated that Hg2+ can easily pass through biological membranes such as skin, respiratory and gastrointestinal tissues, which can induce permanent damage to the central nervous and endocrine systems.2 Thus, the development of a highly sensitive and selective method for Hg2+ detection in aqueous media is of great importance.Various techniques have been utilized for sensing Hg2+ including colorimetry,3–7 electrochemistry,8–11 fluorescence spectroscopy, surface-enhanced Raman scattering (SERS),12–15 and surface plasmon resonance (SPR)16,17 methods. However, colorimetric methods often provide less sensitivity, electrochemical methods are sensitive to the surrounding medium, and SERS and SPR require expensive and sophisticated instrumentation. Compared with other methods, fluorescence assays have attractive advantages, such as rapid response, high sensitivity, and simple manipulation, which have drawn more attention in recent years. Many fluorescent probes including organic small molecules,18,19 metal nanoclusters,20,21 conjugated polymers,22,23 quantum dots (QDs),24,25 and upconversion nanoparticles26 have been developed for the detection of Hg2+. However, some drawbacks still exist, such as complicated synthetic routes, poor selectivity and sensitivity, and low stability in aqueous media, or the turn-off signal output.
Gold nanoparticles (Au NPs) have been explored for the construction of various sensors because of their unique optical properties. It was reported that Au NPs could be used as exceptional fluorescence quenchers. Many fluorescent probes, such as organic dyes27–31 and QDs,32,33 can be efficiently quenched by Au NPs. And they have been employed for the detection of Hg2+. However, the methods require complicated and time-consuming surface modifications and a number of masking agents are also needed to achieve satisfactory selectivity. A simple, fast, inexpensive, sensitive and selective method for Hg2+ detection is therefore highly desirable.
Elemental mercury can complex with certain heavy metals, such as gold and silver, to form amalgams.34 A gold/mercury (Au/Hg) amalgam (alloy) was spontaneously formed by the reaction of mercury with gold. It was produced during the 19th century placer mining when large amounts of mercury were used for gold extraction.35 An Au/Hg amalgam electrode has been fabricated for the sensing of free thiols36 and proteins.37 Gold nanorod/Hg amalgam formation could alter the localized surface plasmon resonance signal significantly and its subsequent use for Hg2+ detection was studied.38 A smart scavenger was fabricated for Hg2+ removal from polluted water via the formation of an Au/Hg amalgam. And the Au/Hg nanoalloy through direct amalgamation of Au NPs with elemental mercury was also studied in detail.39
A perylene probe has high fluorescence quantum yield and excellent photostability in an aqueous buffer solution. It has been used for the development of a number of novel sensing techniques.40–43 It was observed that the Au NPs could interact strongly with the perylene probe and efficiently quench its fluorescence. However, the interaction between the perylene probe and the Au/Hg amalgam was much weaker. Based on this observation, a novel Hg2+ sensing technique is developed.
Experimental section
Materials and instrumentation
HAuCl4·4H2O was purchased from Shanghai Chemical Reagent Co., Ltd (Shanghai, China). Mercuric nitrate was purchased from Taixing Chemical Reagent Co., Ltd (Taixing, Jiangsu, China). Sodium borohydride was purchased from Sigma-Aldrich. Sodium citrate, Cd(NO3)2, Pb(NO3)2, Co(NO3)2, Cu(NO3)2, Mg(NO3)2, Zn(NO3)2, Ba(NO3)2, Ca(NO3)2, Mn(NO3)2, Fe(NO3)2, Ni(NO3)2, AgNO3, and Fe(NO3)3 were obtained from Beijing Chemical Reagent (Beijing, China). Hg2+ stock solution (10 mM) was prepared with Hg(NO3)2·1/2H2O in ultrapure water with an equal concentration of HNO3 added. The perylene probe was synthesized according to literature procedures.44 All the reagents were of analytical grade and used as received. All stock and buffer solutions were prepared using water purified with a Milli-Q A10 filtration system (Millipore, Billerica, MA, USA). UV-Vis absorption measurements were carried out on a Cary 50 Bio Spectrophotometer (Varian Inc., CA, USA) equipped with a xenon flash lamp. Quartz cuvettes with 10 mm path length and 2 mm window width were used for UV-vis spectral measurements. Fluorescence spectra were obtained using a Fluoromax-4 spectrofluorometer (Horiba JobinYvon Inc., USA). The sample solutions were excited at 442 nm, and the emission spectra were recorded with slits for excitation and emission both of 5 nm. Quartz cuvettes with 10 mm path length were used for emission measurements. Zeta potential measurements of the Au NPs were performed with a Zetasizer NanoZS (Malvern Instruments, USA). Transmission electron microscopy (TEM) images were obtained using a JEM-2100F high-resolution transmission electron microscope (Philips, The Netherlands) operated at 200 kV. EDS spectra were obtained using a TEM microscope.Synthesis of the Au NPs
Citrate coated Au NPs (13 nm) were synthesized according to the reported literature method with slight modification.45 Firstly, 2 mL of 25 mM HAuCl4 was mixed with 48 mL of deionized water in a three-necked flask. The solution mixture was heated to reflux and stirred vigorously. Then 5 mL of 38.8 mM sodium citrate was quickly added and a change in the solution color from pale yellow to deep red was observed. The solution was refluxed for an additional 15 min, and then allowed to cool to room temperature under stirring. The synthesized Au NP solution was stored at 4 °C before use.Fluorescence quenching of the perylene probe by Au NPs
50 μL Au NP stock solution was mixed with 80 μL phosphate buffer (pH 7.0) and 266 μL water. Different amounts of the perylene probe (4 μL) were added to the Au NP solutions. The samples were mixed with the pipette tips several times, and the fluorescence spectra were recorded at an ambient temperature. Final concentrations: phosphate buffer 20 mM, Au NPs 1.3 nM, and perylene probe 0, 25, 50, 75, 100, 125, 150, 175, 200, 225, 250 and 275 nM, respectively.Optimization of sodium borohydride concentration
50 μL Au NP stock solution was mixed with 80 μL phosphate buffer (pH 7.0) and 258 μL water. 4 μL Hg2+ and 4 μL different amounts of sodium borohydride were subsequently added. The mixture was incubated for 30 min. The 4 μL perylene probe was added. The samples were mixed with the pipette tips several times, and the fluorescence spectra were recorded. Final concentrations: phosphate buffer 20 mM, Au NPs 1.3 nM, Hg2+ 2.0 μM, perylene probe 200 nM, and NaBH4 0, 25, 50, 75, 100, 125 and 150 μM, respectively.Optimization of the reaction time
50 μL Au NP stock solution was mixed with 80 μL phosphate buffer (pH 7.0) and 258 μL water. 4 μL Hg2+ and 4 μL sodium borohydride were added. The resulting solution was incubated for a certain period of time (0, 2, 5, 10, 15, 20, 25, 30, 35, 40, 50 and 60 min, respectively). The 4 μL perylene probe was then added. The samples were mixed with the pipette tips several times, and the fluorescence spectra were recorded. Final concentrations: phosphate buffer 20 mM, Au NPs 1.3 nM, Hg2+ 2.0 μM, NaBH4 100 μM, and perylene probe 200 nM, respectively.Hg2+ assay procedures
50 μL Au NP stock solution was mixed with 80 μL phosphate buffer (pH 7.0) and 258 μL water. 4 μL of different concentrations of Hg2+ and 4 μL sodium borohydride were added. The resulting mixture was incubated at an ambient temperature for 30 min. The 4 μL perylene probe was then added. The samples were mixed with the pipette tips several times, and the fluorescence spectra were recorded. Final concentrations: phosphate buffer 20 mM, Au NPs 1.3 nM, NaBH4 100 μM, perylene probe 200 nM, and Hg2+ 0, 5, 10, 50, 100, 250, 500, 1000, 1500, 2000, 2500, 3000, 3500, 4000, 4500 and 5000 nM, respectively.Selectivity of the assay
Various metal ions (including Cd2+, Pb2+, Co2+, Cu2+, Mg2+, Zn2+, Ba2+, Ca2+, Mn2+, Fe2+, Ni2+, Ag+ and Fe3+) of the same concentration (2.0 μM) were tested. The assay procedures were the same as those described in the Hg2+ assay section except that different metal ions were used. Final concentrations: phosphate buffer 20 mM, Au NPs 1.3 nM, NaBH4 100 μM, perylene probe 200 nM, and metal ions 2.0 μM, respectively.Hg2+ detection in lake water samples
Lake water samples were collected from the South Lake of Changchun, Jilin province, China. The samples were centrifuged at 12![[thin space (1/6-em)]](https://www.rsc.org/images/entities/char_2009.gif) 000 rpm for 15 min and then filtered through a 0.22 μm filtered membrane. The resulted water samples were spiked with Hg2+ of various concentrations (0, 100, 500, 1000, 1500 and 2000 nM, respectively), and then Hg2+ was quantified. Final concentrations: phosphate buffer, 20 mM (pH 7.0), Au NPs 1.3 nM, NaBH4 100 μM, and perylene probe 200 nM, respectively.
000 rpm for 15 min and then filtered through a 0.22 μm filtered membrane. The resulted water samples were spiked with Hg2+ of various concentrations (0, 100, 500, 1000, 1500 and 2000 nM, respectively), and then Hg2+ was quantified. Final concentrations: phosphate buffer, 20 mM (pH 7.0), Au NPs 1.3 nM, NaBH4 100 μM, and perylene probe 200 nM, respectively.
Results and discussion
Principle and feasibility of the sensor
The overall sensing strategy is schematically illustrated in Scheme 1. (1) A perylene probe could be adsorbed onto the surface of the Au NPs through strong electrostatic and hydrophobic interactions. As a result, the fluorescence of the probe was effectively quenched. (2) In the presence of Hg2+ and NaBH4, Hg2+ was reduced to elemental Hg. And the reduced Hg interacted with the Au NPs and formed an Au/Hg amalgam. (3) The perylene probe could hardly be adsorbed and quenched by the Au/Hg amalgam. A turn on fluorescence signal was therefore detected, and a simple, fast, inexpensive, sensitive and selective Hg2+ detection method is thus established.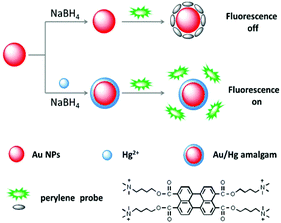 | ||
| Scheme 1 Schematic illustration of the perylene probe and Au NP based fluorescence turn-on Hg2+ detection. | ||
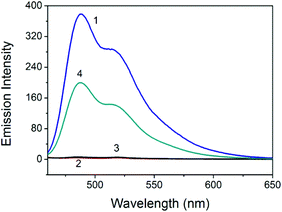
The perylene probe emits strong fluorescence at 488 and 515 nm when excited at 442 nm (Fig. 1). When certain amounts of the Au NPs are introduced, the strong fluorescence of the probe is effectively quenched. Fig. 1 shows that in the absence of Hg2+ and with the addition of 100 μM NaBH4, no obvious increase of the quenched probe emission was observed. In contrast, strong probe fluorescence recovery was observed in the presence of both 2.0 μM Hg2+ and 100 μM NaBH4. The results suggest that Hg2+ was reduced to elemental Hg by NaBH4 and this reduction triggered the in situ formation of the Au/Hg amalgam. The probe molecules could hardly be adsorbed and quenched by the Au/Hg amalgam and a turn-on emission signal was therefore detected. A control experiment was carried out, and the probe was added before the addition of Hg2+ and NaBH4. However, the performance of the sensor was less as good (Fig. S1, ESI†).
The Au NPs exhibit a characteristic surface plasmon absorption at around 520 nm.45 In contrast, the absorption band of the Au/Hg amalgam shifted to 509 nm and its intensity decreased dramatically (Fig. 2). The blue-shift indicates the formation of the Au/Hg amalgam.38 The TEM images clearly show the morphology changes of the nanoparticles as shown in Fig. S2.†
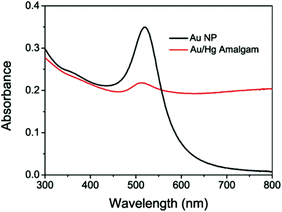 | ||
| Fig. 2 Surface plasmon absorption spectra of the Au NPs and Au/Hg amalgam. Final concentrations: phosphate buffer 20 mM (pH 7.0), Au NPs 1.3 nM, NaBH4 100 μM, and Hg2+ 4.0 μM. | ||
In the absence of Hg2+, the gold nanoparticles are mostly spherical in shape and uniformly distributed with no apparent interactions among individual particles. With the addition of NaBH4 and Hg2+, the reduced elemental Hg was coated on the surface of the gold nanoparticles by the amalgamation process. The changes in the morphology of the gold nanoparticles are strongly dependent on the concentration of Hg2+. When 2 μM Hg2+ was introduced, partial coalescence of the gold nanoparticles with some changes in size and shape was observed. With the addition of 4 μM Hg2+, most of the gold nanoparticles evolved into nonspherical coalescent nanostructures, with no clear spherical nanoparticle structure observed. Elemental Au and Hg bands were both observed in the EDS spectrum (Fig. S3†). These results clearly suggest the formation of the Au/Hg amalgam. Zeta potentials of the Au NPs and the Au/Hg amalgam were also measured. And these values were determined to be −36.6 and −13.3 mV, respectively (Fig. S4†). The surface of the Au NPs was capped with negatively charged citrate functional groups, thus it was negatively charged. Upon the reductive reaction of Hg2+ and subsequent formation of the amalgam on the surface of the Au NPs, a considerably higher zeta potential value was obtained, presumably as a result of the dissociation of the citrate functional groups from the nanoparticle surface.46 Since the perylene probe is positively charged, an increase in nanoparticle surface potential would facilitate dissociation of the probe molecules from the nanoparticle surface.
Fluorescence quenching of the perylene probe by Au NPs
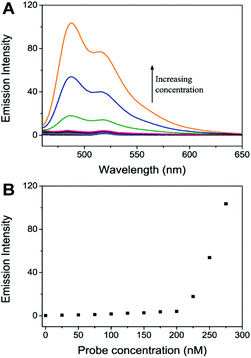
The quenching effect was investigated using different concentrations of the perylene probe (0–275 nM). Fig. 3 shows that when no more than 200 nM perylene probe was added to the solution of 1.3 nM Au NPs, hardly any probe emission was observed. When the probe concentration was 200 nM, a quenching efficiency of about 98.9% (Fig. S5†) was obtained. Further increase of the probe concentration caused a clear increase of the probe emission intensity, indicating that a saturation point was reached where the surface of the Au NPs had been mostly covered by the probe molecules. The 200 nM probe concentration was thus selected in the following experiments.Optimization of the concentration of NaBH4 and the reaction time
The assay conditions were optimized to achieve the best sensing performance. Fig. S6† shows that in the presence of 2.0 μM Hg2+, the emission intensity of the perylene probe gradually increased upon a gradual increase of the NaBH4 concentration. When 100 μM NaBH4 was introduced, the emission intensity reached its maximum. Further increase of the NaBH4 concentration caused no further increase in the emission intensity. The kinetics of the NaBH4 mediated reductive reaction was also studied. Fig. S7† shows that in the presence of 100 μM NaBH4 and 2.0 μM Hg2+, the emission intensity of the perylene probe increased gradually with a prolonged reaction time. After 30 min of the reaction, the emission intensity reached its maximum, indicating that most of the Hg2+ ions had been reduced to form the Au/Hg amalgam. 100 μM NaBH4 and a 30 min reaction time were therefore selected as the optimum conditions for the assay.Sensitivity and selectivity of the sensor
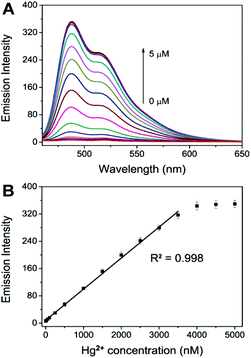
Fig. 4 shows that the emission intensity of the perylene probe at 488 nm increased gradually with the addition of increasing concentrations of Hg2+ (0–5.0 μM). A linear relationship was obtained at an Hg2+ concentration range of 0–3.5 μM. A plot of the probe emission intensity changes at lower Hg2+ concentrations (0–100 nM) is shown in Fig. S8.† The linear regression equation is F = 0.097C + 6.17 (R2 = 0.998), in which ‘F’ is the emission intensity of the perylene probe at 488 nm and ‘C’ is the Hg2+ concentration in nM. The assay is very sensitive compared with the previously reported Hg2+ assays.22,25,47,48 Without the use of any signal amplification, 5 nM of Hg2+ could be easily detected.The selectivity of this assay was also studied. A number of potential interference metal ions including Cd2+, Pb2+, Co2+, Cu2+, Mg2+, Zn2+, Ba2+, Ca2+, Mn2+, Fe2+, Ni2+, Ag+ and Fe3+ were tested. Fig. 5 shows that under the same experimental conditions, 2.0 μM Hg2+ gave a very significant increase in the emission intensity of the perylene probe. In sharp contrast, the other ions of the same concentration could not induce a noticeable increase in the emission intensity. The results clearly suggest that our method is quite selective for Hg2+ detection.
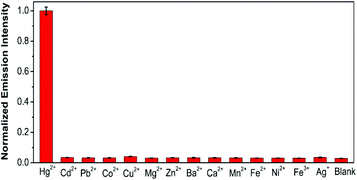 | ||
| Fig. 5 Selectivity of the assay. Final concentrations: phosphate buffer 20 mM (pH 7.0), Au NPs 1.3 nM, perylene probe 200 nM, NaBH4 100 μM, Hg2+ and the other ions: 2.0 μM each. | ||
Analysis of Hg2+ in real water samples
Our assay was also tested in real water samples. The water samples were taken from the South Lake of Changchun, Jilin Province, China. Prior to testing, the samples were centrifuged and filtered through a membrane to get rid of the insoluble materials. The samples were then spiked with different concentrations of Hg2+ standard solutions and analyzed. Satisfactory Hg2+ recovery values were obtained, with RSD values of no more than 4.2% (Table 1). The results clearly suggest that our method could be used for real sample analysis.Conclusions
In summary, we report the development of a novel Hg2+ sensor based on the controlled adsorption of a tetracationic perylene probe onto the Au NPs. It was observed for the first time that a perylene probe could be efficiently adsorbed and its fluorescence quenched by the Au NPs. However, in the presence of Hg2+ and NaBH4, Hg2+ ions were reduced, and an Au/Hg amalgam was formed. The perylene probe could not be adsorbed onto the Au/Hg amalgam, and a turn on fluorescence signal was detected. The increase in the probe fluorescence emission intensity could be directly related to the amount of Hg2+ added to the assay solution. The assay shows high sensitivity. Without the use of any signal amplification, 5 nM of Hg2+ could be easily detected. It is also very selective over other metal ions. The present sensing strategy is also demonstrated for real water sample analysis. It holds good potential for Hg2+ selective sensing related applications, such as environment monitoring.Acknowledgements
This work was supported by the National Natural Science Foundation of China (21275139, 21550110196), the Jilin Provincial Strategic Economic Infrastructure Adjustment fund (2014Y077), the Pillar Program of Changchun Municipal Bureau of Science and Technology (14KG062), and the Natural Science Foundation of Jilin Province (20150101183JC). S. A. Shahzad also acknowledges financial support from the Chinese Academy of Sciences (Visiting Fellowship for Researchers from Developing Countries, Grant No. 2014FFGB0009).Notes and references
- E. M. Nolan and S. J. Lippard, Chem. Rev., 2008, 108, 3443–3480 CrossRef CAS PubMed.
- S. K. Ko, Y. K. Yang, J. Tae and I. Shin, J. Am. Chem. Soc., 2006, 128, 14150–14155 CrossRef CAS PubMed.
- D. Li, A. Wieckowska and I. Willner, Angew. Chem., Int. Ed., 2008, 47, 3927–3931 CrossRef CAS PubMed.
- J. S. Lee, M. S. Han and C. A. Mirkin, Angew. Chem., Int. Ed., 2007, 46, 4093–4096 CrossRef CAS PubMed.
- X. J. Xue, F. Wang and X. G. Liu, J. Am. Chem. Soc., 2008, 130, 3244–3245 CrossRef CAS PubMed.
- G. L. Wang, X. Y. Zhu, H. J. Jiao, Y. M. Dong and Z. J. Li, Biosens. Bioelectron., 2012, 31, 337–342 CrossRef CAS PubMed.
- Y. L. Hao, Q. Q. Guo, H. Y. Wu, L. Q. Guo, L. S. Zhong, J. Wang, T. R. Lin, F. F. Fu and G. N. Chen, Biosens. Bioelectron., 2014, 52, 261–264 CrossRef CAS PubMed.
- Z. Q. Zhu, Y. Y. Su, J. Li, D. Li, J. Zhang, S. P. Song, Y. Zhao, G. X. Li and C. H. Fan, Anal. Chem., 2009, 81, 7660–7666 CrossRef CAS PubMed.
- Y. Tian, Z. Zhang, L. P. Wen, J. Ma, Y. Q. Zhang, W. D. Liu, J. Zhai and L. Jiang, Chem. Commun., 2013, 49, 10679–10681 RSC.
- C. M. Yu, Y. L. Guo, H. T. Liu, N. Yan, Z. Y. Xu, G. Yu, Y. Fang and Y. Q. Liu, Chem. Commun., 2013, 49, 6492–6494 RSC.
- J. Li, W. W. Tu, H. B. Li, M. Han, Y. Q. Lan, Z. H. Dai and J. C. Bao, Anal. Chem., 2014, 86, 1306–1312 CrossRef CAS PubMed.
- Y. X. Du, R. Y. Liu, B. H. Liu, S. H. Wang, M. Y. Han and Z. P. Zhang, Anal. Chem., 2013, 85, 3160–3165 CrossRef CAS PubMed.
- S. H. Chen, D. B. Liu, Z. H. Wang, X. L. Sun, D. X. Cui and X. Y. Chen, Nanoscale, 2013, 5, 6731–6735 RSC.
- W. Ma, M. Z. Sun, L. G. Xu, L. B. Wang, H. Kuang and C. L. Xu, Chem. Commun., 2013, 49, 4989–4991 RSC.
- X. F. Ding, L. T. Kong, J. Wang, F. Fang, D. D. Li and J. H. Liu, ACS Appl. Mater. Interfaces, 2013, 5, 7072–7078 CAS.
- L. Wang, T. Li, Y. Du, C. G. Chen, L. Li, M. Zhou and S. J. Dong, Biosens. Bioelectron., 2010, 25, 2622–2626 CrossRef CAS PubMed.
- C. C. Chang, S. H. Lin, S. C. Wei, C. Y. Chen and C. W. Lin, Biosens. Bioelectron., 2011, 30, 235–240 CrossRef CAS PubMed.
- X. L. Zhang, Y. Xiao and X. H. Qian, Angew. Chem., Int. Ed., 2008, 47, 8025–8029 CrossRef CAS PubMed.
- M. Z. Tian, L. B. Liu, Y. J. Li, R. F. Hu, T. F. Liu, H. B. Liu, S. Wang and Y. L. Li, Chem. Commun., 2014, 50, 2055–2057 RSC.
- J. P. Xie, Y. G. Zheng and J. Y. Ying, Chem. Commun., 2010, 46, 961–963 RSC.
- L. Deng, Z. X. Zhou, J. Li, T. Li and S. J. Dong, Chem. Commun., 2011, 47, 11065–11067 RSC.
- X. F. Liu, Y. L. Tang, L. H. Wang, J. Zhang, S. P. Song, C. H. Fan and S. Wang, Adv. Mater., 2007, 19, 1471–1474 CrossRef CAS.
- E. S. Childress, C. A. Roberts, D. Y. Sherwood, C. L. M. LeGuyader and E. J. Harbron, Anal. Chem., 2012, 84, 1235–1239 CrossRef CAS PubMed.
- C. Yuan, K. Zhang, Z. P. Zhang and S. H. Wang, Anal. Chem., 2012, 84, 9792–9801 CrossRef CAS PubMed.
- R. Z. Zhang and W. Chen, Biosens. Bioelectron., 2014, 55, 83–90 CrossRef CAS PubMed.
- X. H. Li, Y. Q. Wu, Y. Liu, X. M. Zou, L. M. Yao, F. Y. Li and W. Feng, Nanoscale, 2014, 6, 1020–1028 RSC.
- C. C. Huang and H. T. Chang, Anal. Chem., 2006, 78, 8332–8338 CrossRef CAS PubMed.
- G. K. Darbha, A. Ray and P. C. Ray, ACS Nano, 2007, 1, 208–214 CrossRef CAS PubMed.
- H. Wang, Y. X. Wang, J. Y. Jin and R. H. Yang, Anal. Chem., 2008, 80, 9021–9028 CrossRef CAS PubMed.
- H. Y. Chang, T. M. Hsiung, Y. F. Huang and C. C. Huang, Environ. Sci. Technol., 2011, 45, 1534–1539 CrossRef CAS PubMed.
- T. I. Kim, J. Park and Y. Kim, Chem. – Eur. J., 2011, 17, 11978–11982 CrossRef CAS PubMed.
- M. Li, Q. Y. Wang, X. D. Shi, L. A. Hornak and N. Q. Wu, Anal. Chem., 2011, 83, 7061–7065 CrossRef CAS PubMed.
- D. W. Huang, C. G. Niu, X. Y. Wang, X. X. Lv and G. M. Zeng, Anal. Chem., 2013, 85, 1164–1170 CrossRef CAS PubMed.
- L. Deng, X. Y. Ouyang, J. Y. Jin, C. Ma, Y. Jiang, J. Zheng, J. S. Li, Y. H. Li, W. H. Tan and R. H. Yang, Anal. Chem., 2013, 85, 8594–8600 CrossRef CAS PubMed.
- I. Ojea-Jiménez, X. López, J. Arbiol and V. Puntes, ACS Nano, 2012, 6, 2253–2260 CrossRef PubMed.
- P. Jusková, V. Ostatná, E. Paleček and F. Foret, Anal. Chem., 2010, 82, 2690–2695 CrossRef PubMed.
- T. J. Oshea and S. M. Lunte, Anal. Chem., 1993, 65, 247–250 CrossRef CAS.
- H. W. Huang, C. T. Qu, X. Y. Liu, S. W. Huang, Z. J. Xu, Y. J. Zhu and P. K. Chu, Chem. Commun., 2011, 47, 6897–6899 RSC.
- S. F. L. Mertens, M. Gara, A. S. Sologubenko, J. Mayer, S. Szidat, K. W. Kramer, T. Jacob, D. J. Schiffrin and T. Wandlowski, Adv. Funct. Mater., 2011, 21, 3259–3267 CrossRef CAS.
- W. Y. Li, J. Chen, H. P. Jiao, Q. F. Zhang, H. P. Zhou and C. Yu, Chem. Commun., 2012, 48, 10123–10125 RSC.
- D. L. Liao, J. Chen, H. P. Zhou, Y. Wang, Y. X. Li and C. Yu, Anal. Chem., 2013, 85, 2667–2672 CrossRef CAS PubMed.
- B. Wang, Q. K. Zhu, D. L. Liao and C. Yu, J. Mater. Chem., 2011, 21, 4821–4826 RSC.
- H. P. Jiao, J. Chen, W. Y. Li, F. Y. Wang, H. P. Zhou, Y. X. Li and C. Yu, ACS Appl. Mater. Interfaces, 2014, 6, 1979–1985 CAS.
- J. Chen, H. P. Jiao, W. Y. Li, D. L. Liao, H. P. Zhou and C. Yu, Chem. – Asian J., 2013, 8, 276–281 CrossRef CAS PubMed.
- J. J. Storhoff, R. Elghanian, R. C. Mucic, C. A. Mirkin and R. L. Letsinger, J. Am. Chem. Soc., 1998, 120, 1959–1964 CrossRef CAS.
- W. Ren, C. Z. Zhu and E. K. Wang, Nanoscale, 2012, 4, 5902–5909 RSC.
- D. B. Liu, W. S. Qu, W. W. Chen, W. Zhang, Z. Wang and X. Y. Jiang, Anal. Chem., 2010, 82, 9606–9610 CrossRef CAS PubMed.
- Y. Wang, F. Yang and X. R. Yang, Biosens. Bioelectron., 2010, 25, 1994–1998 CrossRef CAS PubMed.
Footnote |
| † Electronic supplementary information (ESI) available. See DOI: 10.1039/c5an01992c |
| This journal is © The Royal Society of Chemistry 2016 |

