Certification of reference materials for analysis of isoflavones genistin and genistein in soy products†
Dezhi
Yang
,
Shiying
Yang
,
Baoxi
Zhang
and
Yang
Lu
*
Beijing City Key Laboratory of Polymorphic Drugs, Center of Pharmaceutical Polymorphs, Institute of Materia Medica, Chinese Academy of Medical Sciences and Peking Union Medical College, Beijing, 100050, China. E-mail: luy@imm.ac.cn; Tel: +86 10 63030566
First published on 5th November 2015
Abstract
Soy isoflavones are a class of secondary metabolites in the growth process of soybeans or other legumes. Many studies support their roles in the prevention and treatment of cancer, arterial sclerosis, osteoporosis and menopausal syndrome. Genistin and genistein, the two highest amount active ingredients in soy isoflavones, were developed into two new certified reference materials (CRMs) in this work. According to the guidelines of development of CRMs, mainly ISO Guides 34:2009 and 35:2005, studies on sample preparation, homogeneity, stability, characterization, and uncertainty estimation were carried out. In the characterization, two methods based on different theories, namely differential scanning calorimetry (DSC) and coulometric titrimetry (CT), were employed. Genistin and genistein CRM certified values and corresponding expanded uncertainties, obtained from the combined standard uncertainty multiplied by the coverage factor (k = 2), for a confidence level of 95%, were 99.7 ± 0.3% and 99.3 ± 0.5%. The mass balance (MB) method was employed to cross-check the results. Genistin and genistein CRMs have been approved and assigned as a grade primary reference material by the National Administrative Committee. These CRMs can be applied to the analysis of soy isoflavones in related products, such as (fermenting) soybean foods or medicines.
Introduction
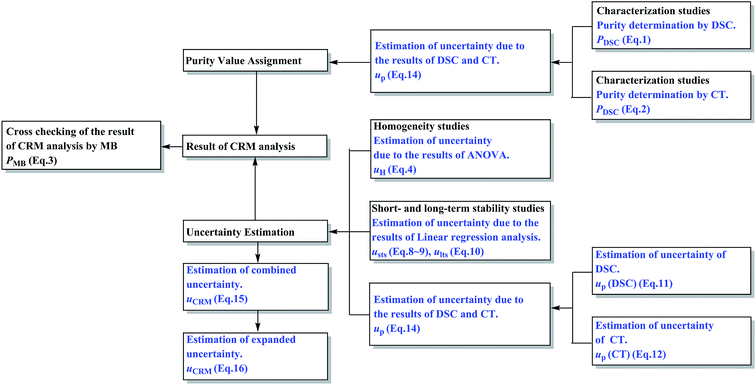
Soy isoflavones are a class of secondary metabolites in the growth process of soybeans or other legumes, which are classified as phytoestrogens (PE) for their estrogen-like effects.1,2 They are responsible for many of the health benefits of soy consumption and help treat high cholesterol levels, heart disease, breast cancers, and prostate cancers, play a role during menopause and aid bone health, weight loss, renal function, cognitive function and so on.3–5 Because of the increasing popularity of soy foods and the availability of isoflavone supplements, there is an important public health need to accurately quantify the isoflavone content of these soy products. Certified reference materials (CRMs) for analysis of soy isoflavones in relative products are necessary in this situation. There exist 12 kinds of isoflavones in soybean and they are divided into daidzin groups, genistin groups and glycitin groups, respectively, in which the content of genistin groups (genistin and genistein) is the highest.6 Therefore, genistin and genistein were developed into two new certified reference materials (CRMs) in this work.A certified reference material (CRM) is a material or substance that has one or more property values which are sufficiently homogeneous, stable, and well-established to be used for the calibration of an apparatus, the assessment of a measurement method, or for assigning values to materials.7–9 CRMs are essential tools to guarantee the metrological traceability of measurement results to the International System of Units (SI), which means the accuracy and comparability of results over time and space.10 However, no CRMs of isoflavones were available in the markets to date. Therefore, the development of genistin and genistein CRMs was carried out in this work, following the principles of ISO Guides 34:2009 and 35:2005.11,12 The certification progress of these CRMs was designed as described in Fig. 1.
Studies on sample preparation, homogeneity, stability, characterization, and uncertainty estimation were performed. In the characterization, two certified methods based on different theories, namely differential scanning calorimetry (DSC) and coulometric titrimetry (CT), were employed. Both methods have advantages of minimal sample requirement, short analysis time, high accuracy, good reproducibility, and no requirement of a corresponding reference standard.13,14 Then the uncertainty evaluations of these methods were performed carefully under the Guide to Uncertainty Measurement15 in this work. The certification results of these CRMs were cross-checked by another independent reference method, namely, the mass balance (MB) method. The MB method is generally regarded as an accurate one and is recommended by the World Health Organization (WHO) and European Pharmacopoeia and International Pharmacopoeia for the establishment of chemical reference standards. Furthermore, this method is also recommended by the Bureau International des Poids et Mesures (BIPM) in the comparison of national metrology institutes.16
Materials and methods
Material
Genistin and genistein raw materials were obtained from the WuhanYuancheng Technology Development Co., Ltd (Wuhan, China), whose purities are 98.0% and 98.2% determined by HPLC, respectively.Instrumentation
The DSC curves were measured on a Mettler-Toledo DSC 1/700 calorimeter (Mettler-Toledo Inc., Switzerland). The CT analysis was conducted using a coulometer (Chinese Academy of Medical Sciences, China). HPLC measurements were made on an Agilent 1200 liquid chromatographic system with a diode-array detector (DAD) (Agilent Technologies, Inc., USA). The moisture of substances was determined by using a Mettler-Toledo DL 39 Karl Fischer coulometric titrator (Mettler-Toledo Inc., Switzerland). An Agilent 7890A GC system (Agilent Technologies, Inc., USA) was employed for the determination of residual solvents. A SX25-01 muffle furnace (Shanghai Shuli, Inc., China) was used for sulfated ash measurements.Preparation of the candidate CRMs
In this work, for the preparation of genistin and genistein candidate CRMs, the same method as described below was used to obtain candidate CRMs with purities more than 99%.About 60 g raw material was added to 150 mL N,N-dimethylformamide (DMF), heated at 50 °C, refluxed for 2 h. After complete dissolution, 750 mL mixed solution (ethanol![[thin space (1/6-em)]](https://www.rsc.org/images/entities/char_2009.gif) :
:![[thin space (1/6-em)]](https://www.rsc.org/images/entities/char_2009.gif) water
water![[thin space (1/6-em)]](https://www.rsc.org/images/entities/char_2009.gif) :
:![[thin space (1/6-em)]](https://www.rsc.org/images/entities/char_2009.gif) DMF = 1
DMF = 1![[thin space (1/6-em)]](https://www.rsc.org/images/entities/char_2009.gif) :
:![[thin space (1/6-em)]](https://www.rsc.org/images/entities/char_2009.gif) 1
1![[thin space (1/6-em)]](https://www.rsc.org/images/entities/char_2009.gif) :
:![[thin space (1/6-em)]](https://www.rsc.org/images/entities/char_2009.gif) 0.1) was dropwise added into the solution with stirring at a uniform speed. The solution was stirred for an hour and then allowed to stand for crystallization overnight at 25 °C. The solid obtained was flushed with 200 mL ethanol and then recrystallized for a second time by the same method. Finally, the crystal was dried over 24 h under −0.1 mPa at 60 °C, and then ground and sieved into powder within the particle size range of 75–150 μm. The powder was homogenized in a multi-axle rotating mixer, dispensed and sealed into dark ampoules with 50 mg each. A total of 500 bottles was obtained for each candidate CRM.
0.1) was dropwise added into the solution with stirring at a uniform speed. The solution was stirred for an hour and then allowed to stand for crystallization overnight at 25 °C. The solid obtained was flushed with 200 mL ethanol and then recrystallized for a second time by the same method. Finally, the crystal was dried over 24 h under −0.1 mPa at 60 °C, and then ground and sieved into powder within the particle size range of 75–150 μm. The powder was homogenized in a multi-axle rotating mixer, dispensed and sealed into dark ampoules with 50 mg each. A total of 500 bottles was obtained for each candidate CRM.
Homogeneity studies
A homogeneity study is necessary in a batch of candidate CRMs to demonstrate that the batch of bottles is sufficiently homogeneous. In this work, the DSC method was used for the homogeneity study with 15 bottles selected at random. From each bottle, about 3–5 mg sample was prepared in one replicate for the between-bottle homogeneity study and in triplicate for the within-bottle homogeneity study.Short- and long-term stability studies
Stability testing aims to investigate the stability of the candidate CRMs after preparation under transport conditions (short-term stability) and storage conditions (long-term stability).The short-term stability study was performed by the DSC method. Three specified conditions were set as high temperature (60 °C), high humidity (90 ± 5%, 25 °C) and high illumination (4500 ± 500 lx, 25 °C), respectively. Six bottles were introduced under each condition separately for 14 days. Three bottles were taken out and individually analyzed by DSC every 7 days. Three other bottles kept at 25 °C were used as controls. The DSC sample analysis was performed as described above for the between-bottle homogeneity study.
For the long-term stability study, 36 bottles were kept at 25 °C for one year. Each set of six bottles was analyzed, as described for the between-bottle homogeneity study, at 25 °C on 0, 1, 2, 4, 6 and 12 months, respectively.
Characterization of the candidate CRMs
The general performance of the instrument is evaluated quarterly by indium [GBW (E) 130182] by the programmed In Check method stored in STARe software according to the instruction manual. The heat flow, temperature, and enthalpy are calibrated by the test.
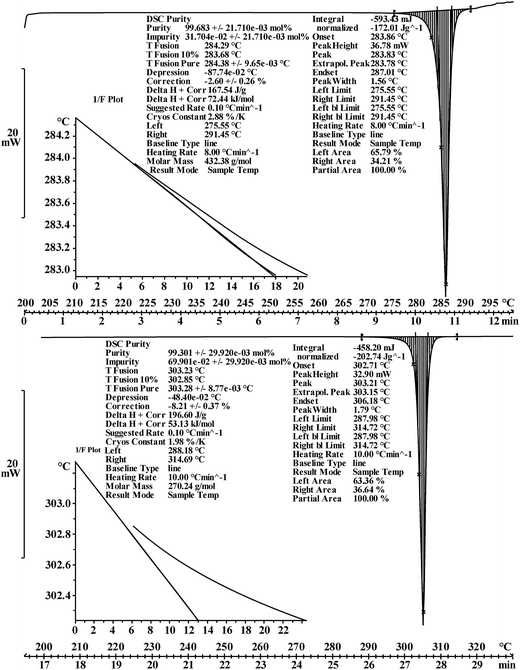
DSC purity determination was performed under a constant atmosphere of high-purity nitrogen gas at a flow rate of 50 mL min−1. The instrument was cooled using a refrigerated cooling system. Approximately 3–5 mg of the candidate CRMs was accurately weighed to 0.01 mg using a Mettler 40 μL aluminum crucible, hermetically sealed with an appropriate aluminum lid, and crimped. An empty crucible and lid of the same type were used as the reference. The heating rates were set to 5 K min−1 and 8 K min−1 for the analysis of genistin and genistein, respectively.
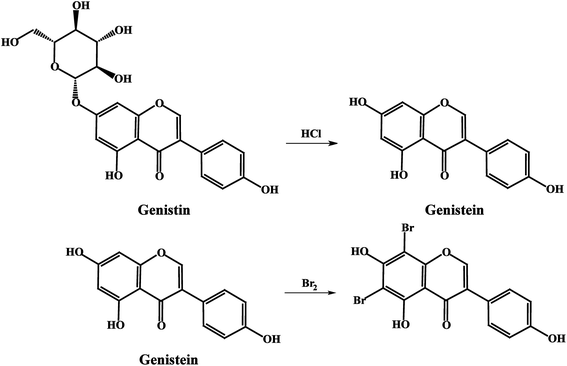
Purity determination by the CT method is based on the substitution reaction between a hydrogen atom in the sample structure and bromine, which is produced by the potassium bromide (KBr) electrolyte; the instrument can automatically record the reaction time, which is used to calculate the purity.
Due to the introduction of glucose at the 7-position of genistein, genistin could not directly react with bromine in the coulometric titration as well as genistein. Therefore, a hydrolysis reaction was conducted so as to transform genistin into genistein, whose conditions are ultrasonic hydrolysis for 6 hours at 70 °C in 6 mol L−1 hydrochloric acid (HCl).
The current of the coulometric titrator was 0.9839 mA, and calibration was performed before the experiment using arsenious acid solution (GBW 08666). The end point of the titration was indicated by an increase in current. The electrode material was platinum. The composition of the electrolyte solution, for the analysis of genistin, was KBr (1 mol L−1) and methanol and glacial acetic acid in a 9![[thin space (1/6-em)]](https://www.rsc.org/images/entities/char_2009.gif) :
:![[thin space (1/6-em)]](https://www.rsc.org/images/entities/char_2009.gif) 3
3![[thin space (1/6-em)]](https://www.rsc.org/images/entities/char_2009.gif) :
:![[thin space (1/6-em)]](https://www.rsc.org/images/entities/char_2009.gif) 1 ratio, and for the analysis of genistein, was KBr (1 mol L−1) and HCl (2 mol L−1) in a 1
1 ratio, and for the analysis of genistein, was KBr (1 mol L−1) and HCl (2 mol L−1) in a 1![[thin space (1/6-em)]](https://www.rsc.org/images/entities/char_2009.gif) :
:![[thin space (1/6-em)]](https://www.rsc.org/images/entities/char_2009.gif) 1 ratio.
1 ratio.
For the sample under purity analysis, the total of the measured volatile impurities, as well as water and solvent residues, organic and inorganic impurities, and the main component should amount to 100%. Therefore, the purity of the main component can be confirmed by subtracting the sum of all of the impurities from 100%, eqn (3).
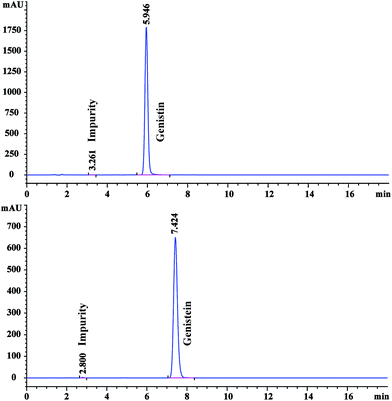
The candidate CRMs were analyzed using an Agilent 1200 HPLC system equipped with an Agilent Eclipse XDB-C18 (150 mm × 4.6 mm, 5 μm) column. The injection volume was 10 μL. The column temperature was 30 °C. The flow rate was 1 mL min−1. The mobile phase was composed of 0.5% acetic acid aqueous solution and acetonitrile at a ratio of 80![[thin space (1/6-em)]](https://www.rsc.org/images/entities/char_2009.gif) :
:![[thin space (1/6-em)]](https://www.rsc.org/images/entities/char_2009.gif) 20 for the analysis of genistin CRM and composed of 0.5% acetic acid aqueous solution and methanol at a ratio of 29
20 for the analysis of genistin CRM and composed of 0.5% acetic acid aqueous solution and methanol at a ratio of 29![[thin space (1/6-em)]](https://www.rsc.org/images/entities/char_2009.gif) :
:![[thin space (1/6-em)]](https://www.rsc.org/images/entities/char_2009.gif) 71 for the analysis of genistein CRM. The chromatographic profiles were registered at 258 nm and 260 nm for the analysis of genistin and genistein CRMs, respectively. Volatile impurities, mainly composed of residual solvents, were determined by GC. The moisture was determined by using a Karl Fischer coulometric titrator. The inorganic impurities were acquired through the routine method of residue on ignition.
71 for the analysis of genistein CRM. The chromatographic profiles were registered at 258 nm and 260 nm for the analysis of genistin and genistein CRMs, respectively. Volatile impurities, mainly composed of residual solvents, were determined by GC. The moisture was determined by using a Karl Fischer coulometric titrator. The inorganic impurities were acquired through the routine method of residue on ignition.
Results and discussion
Homogeneity studies
A one-way analysis of variance (ANOVA, F-test) was used to evaluate the homogeneity of CRMs. The mean square between bottles (MSbetween) was larger than the mean square within bottles (MSwithin), which means the method has good repeatability. The ratios of mean square (F) were smaller than the critical value (Fcrit), which means the homogeneities of CRMs were good. In this case, eqn (4) was used to calculate uh. Table 2 shows the results of homogeneity studies of CRMs.| Parameters | Results | ||
|---|---|---|---|
| Genistin | Genistein | ||
| Homogeneity studies | F/Fcrit | 1.47/2.04 | 1.19/2.04 |
| p-Value | 0.18 | 0.33 | |
| MSbetween/MSwithin (n) | 3.14 × 10⁻⁸/2.13 × 10−8 (n = 3) | 1.61 × 10⁻⁸/1.36 × 10−8 (n = 3) | |
| Short-term stability studies | t crit | 2.776 | 2.776 |
| t (60 °C) | 0.956 (0,7)/0.500 (0,14) | 0.632 (0,7)/0.316 (0,14) | |
| t (90% RH) | 1.809 (0,7)/0.277 (0,14) | 0.632 (0,7)/0.426 (0,14) | |
| t (4500 lx) | 0.152 (0,7)/0.369 (0,14) | 0.250 (0,7)/0.800 (0,14) | |
| Long-term stability studies | S (b) | 3.89 × 10⁻⁵ | 1.92 × 10⁻⁵ |
| t (month) | 12 | 12 | |
| Purity determination | DSC method | 99.68% (n = 10, s = 0.000233) | 99.30% (n = 10, s = 0.000357) |
| CT method | 99.68% (n = 10, s = 0.000679) | 99.33% (n = 10, s = 0.000642) | |
| Value assignment | t crit/t | 2.20/0.00 | 2.20/1.29 |
| P CRM | 99.7% | 99.3% | |
| Cross cheking | MB method | 99.66% | 99.32% |
| HPLC method | 99.95% (n = 3, s = 0.000058) | 99.86% (n = 3, s = 0.000173) | |
| Water | 0.12% | 0.19% | |
| Sulphate ashes | 0.20% | 0.12% | |
| Residual solvents | 0.17% | 0.23% | |
| Uncertainty estimation | u h | 5.78 × 10⁻⁵ | 2.91 × 10⁻⁵ |
| u sts | 8.98 × 10⁻⁴ | 3.27 × 10⁻⁴ | |
| u lts | 4.66 × 10⁻⁴ | 2.30 × 10⁻⁴ | |
| u p(DSC) | 0.03% | 0.04% | |
| u p(CT) | 0.11% | 0.21% | |
| u p | 0.11% | 0.21% | |
| u CRM | 0.15% | 0.22% | |
| U CRM | 0.3% | 0.5% | |
| Results of CRM analysis | k = 2, P = 0.95 | 99.7 ± 0.3% | 99.3 ± 0.5% |
Short- and long-term stability studies
The mean uniformity method (t-test) was used to evaluate the short-term stability. According to eqn (5), the calculated values of t under different conditions were all less than the critical value (tcrit) from the table of bilateral quantile distribution, which have indicated that the CRMs have good short-term stabilities.Linear regression analysis was used to evaluate the long-term stability. The slope and standard deviation of the data points obtained in the long-term stability studies were calculated using eqn (6) and (7). The absolute values of the slope were smaller than the product of time (12 per month) and slope uncertainties, which have indicated that the CRMs have good long-term stabilities. The results showed that these CRMs were stable for up to one year under the conditions used in this study.
The uncertainties of short- and long-term stabilities were evaluated using eqn (8)–(10). Table 2 shows the results of short- and long-term stabilities of the CRMs.
Characterization studies
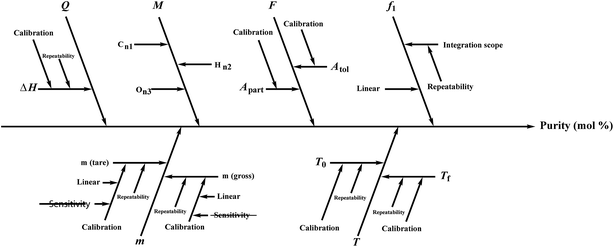
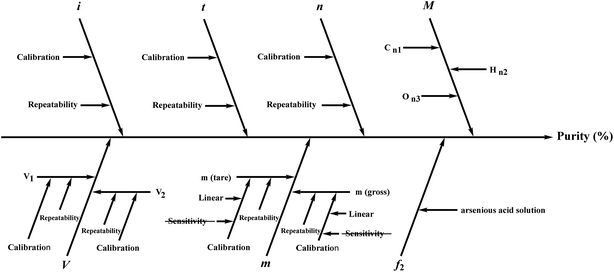
Several factors, which could affect the results of the purity determination, were identified as the possible sources of uncertainty in DSC measurement and shown in Fig. 3. The uncertainty of purity should be equal to the uncertainty of impurity determined by DSC deduced from eqn (1). Therefore, the uncertainty of purity could be calculated using eqn (11). Table 2 shows the results of the purity determination and uncertainty evaluation by DSC.
Several factors, which could affect the results of purity determination, were identified as the possible sources of uncertainty in CT measurement and are shown in Fig. 5. Therefore, the uncertainty of CT could be calculated using eqn (12). Table 2 shows the results of purity determination and uncertainty evaluation by CT.
Conclusion
Two new certified reference materials, genistin and genistein, were developed to fulfill the strong demand for CRMs for the analysis of soy isoflavones in related products, since only a few were available internationally. Two different methods were used to determine the purity and the purities of the genistin and genistein CRMs were found to be 99.7% and 99.3% with expanded uncertainties of 0.3% and 0.5% (k = 2), respectively. The developed CRMs were stable for at least one year. The new CRMs, genistin and genistein, have been approved by the National Administrative Committee for CRM's as GBW 09558 and GBW 09559.Acknowledgements
The work was financially supported by the Ministry of Science and Technology of the People's Republic of China (No. 2007FY130100) and Youth Fund of CAMS & PUMC (No. 3332013075).References
- B. Yuan, H. J. Zhen, Y. Jin, L. Xu, X. Jiang, S. T. Sun, C. B. Li and H. Y. Xu, Absorption and Plasma Disposition of Genistin Differ from Those of Genistein in Healthy Women, J. Agric. Food Chem., 2012, 60, 1428–1436 CrossRef CAS PubMed.
- J. L. Peñalvo, T. Nurmi and H. Adlercreutz, A simplified HPLC method for total isoflavones in soy products, Food Chem., 2004, 87(2), 297–305 CrossRef.
- I. Baraem and H. Kirby, β-Glycosidase Activity toward Different Glycosidic Forms of Isoflavones, J. Agric. Food Chem., 2005, 53, 4918–4924 CrossRef PubMed.
- M. Messina, S. Watanabe and K. D. Setchell, Report on the 8th international symposium on the role of soy in health promotion and chronic disease prevention and treatment, J. Nutr., 2009, 139(4), 796S–802S CrossRef CAS PubMed.
- C. D. Gardner, L. M. Chatterjee and A. A. Franke, Effects of isoflavone supplements vs. soy foods on blood concentrations of genistein and daidzein in adults, J. Nutr. Biochem., 2009, 20(3), 227–234 CrossRef CAS PubMed.
- S. Kudou, Y. Fleury, D. Welti, D. Magnolato, T. Uchida, K. Kitamura and K. Okubo, Malonyl isoflavone glycosides in soybean seeds (Glycone max MERRILL), Agric. Biol. Chem., 1991, 55, 2227–2233 CrossRef CAS.
- H. Emons, T. P. J. Linsinger and B. M. Gawlik, Reference materials: terminology and use. Can't one see the forest for the trees?, TrAC, Trends Anal. Chem., 2004, 23(6), 442–449 CrossRef CAS.
- M. Gallorini, Standard reference materials and data quality assurance: the lesson from the analysis of trace elements, Toxicol. Lett., 1995, 77(1–3), 209–212 CrossRef CAS PubMed.
- C. Quan, Establishment of the purity values of carbohydrate certified reference materials using quantative nuclear magnetic resonance and mass balance approach, Food Chem., 2014, 153, 378–386 CrossRef CAS PubMed.
- R. Nogueira, B. C. Garrido, R. M. Borges, G. E. B. Silva, S. M. Queiroz and V. S. Cunha, Development of a new sodium diclofenac certified reference material using the mass balance approach and 1H qNMR to determine the certified property value, Eur. J. Pharm. Sci., 2013, 48(3), 502–513 CrossRef CAS PubMed.
- International Standard Organization (ISO), ISO Guide 34: General Requirements for the Competence of Reference Material Producers, ISO, Geneva, Switzerland, 2nd edn, 2009 Search PubMed.
- International Standard Organization (ISO), ISO Guide 35: Reference Materials-General and Statistical Principles for Certification, ISO, Geneva, Switzerland, 3rd edn, 2005 Search PubMed.
- G. Ziyatdinova, E. Ziganshina and H. Budnikov, Surfactant media for constant-current coulometry. Application for the determination of antioxidants in pharmaceuticals, Anal. Chim. Acta, 2012, 744, 23–28 CrossRef CAS PubMed.
- J. M. Gao, L. X. Ding and C. Q. Hu, A comparative uncertainty study of the purity assessment of chemical reference substances using differential scanning calorimetry (DSC) and mass balance method, Thermochim. Acta, 2011, 525(1–2), 1–8 CAS.
- BipmI, IFCCI, IUPACO and OIMLI, Guide to the Expression of Uncertainty in Measurement, ISO, Geneva, Switzerland, 1993 Search PubMed.
- K. Ma, H. Wang, M. Zhao and J. Xing, Purity determination and uncertainty evaluation of theophylline by mass balance method, high performance liquid chromatography and differential scanning calorimetry, Anal. Chim. Acta, 2009, 650(2), 227–233 CrossRef CAS PubMed.
Footnote |
| † Electronic supplementary information (ESI) available. See DOI: 10.1039/c5ay02304a |
| This journal is © The Royal Society of Chemistry 2016 |

