Colorimetric sensing of atrazine in rice samples using cysteamine functionalized gold nanoparticles after solid phase extraction†
Guangyang
Liu
abc,
Shanshan
Wang
b,
Xin
Yang
*a,
Tengfei
Li
b,
Yongxin
She
b,
Jing
Wang
*abc,
Pan
Zou
a,
Fen
Jin
b,
Maojun
Jin
b and
Hua
Shao
b
aSchool of Food Science and Engineering, Harbin Institute of Technology, Harbin 150090, P.R. China. E-mail: yangxin@hit.edu.cn; w_jing2001@126.com; Fax: +86-010-82106567; Tel: +86-10-82106568
bKey Laboratory of Agro-Product Quality and Safety, Institute of Quality Standards & Testing Technology for Agro-Product, Chinese Academy of Agricultural Sciences, Beijing 100081, P.R. China
cKey Laboratory of Pesticide Chemistry and Application, Ministry of Agriculture, 100081 Beijing, P.R. China
First published on 18th November 2015
Abstract
A simple and sensitive colorimetric assay for the determination of atrazine in rice samples using cysteamine–gold nanoparticles (AuNPs) after solid phase extraction has been developed. The approach exploited the benefits of a robust sample pretreatment scheme with a rapid and sensitive colorimetric sensing strategy based on cysteamine–AuNPs. As a result of the hydrogen bonding between atrazine and cysteamine, cysteamine–AuNPs were induced to aggregate with an accompanying distinct color change from wine red to blue. The color change was monitored by UV-vis spectrophotometry or with the naked eye. The difference of the absorbance value at 523 nm was linearly related to the atrazine concentration over the range 0.033 to 6.67 μg g−1, and the limit of detection (S/N = 3) was 0.0165 μg g−1. The spiked rice samples were extracted and purified using Oasis HLB cartridges and satisfactory recoveries (83.23–91.65%) were realized.
1. Introduction
Atrazine is one of the most widely applied herbicides for weed control, its mode of action being through inhibition of photosynthesis.1 With prolonged use, the accumulation of atrazine in crops, water and soil has become a threat to the environment and human health owing to its high carcinogenicity and mutagenicity,2 especially after biological amplification. Therefore, atrazine and its degradation products have drawn more and more environmental and health concerns. Many countries have established maximum residue limits (MRLs) for atrazine (50–250 ng g−1) in vegetables and crops.3 Over the last decade, several instrumental methods for the determination of atrazine have been reported, including high performance liquid chromatography (HPLC),4 gas chromatography (GC),5 mass spectroscopy (MS),6 and GC-MS7 as well as HPLC-MS.8 However, these analytical methods are time-consuming, requiring sophisticated instrumentation and large volumes of organic solvents. Recently, several new sensing technologies for detecting atrazine have been developed. These mainly involve electrochemical immunosensors,9 electrochemical sensors based on molecular imprinted polymers,10 surface plasmon resonance immunosensors,11 fluorescent chemosensors12 and colorimetric sensors.13 Among them, colorimetric detection of atrazine based on gold nanoparticle (AuNP) aggregation is recommended as it is easy to implement and does not require expensive antibodies or involve complex experimental procedures.AuNPs have attracted intense interest in various research fields because of their unique chemical and physical properties.14 Based on the interactions between AuNPs and the analytes, which involve electrostatic adsorption15,16 and covalent bonding,17,18 colloidal AuNPs can be induced to undergo aggregation with a corresponding color change from wine red to blue. Owing to the resulting high sensitivity and selectivity, AuNP based colorimetric assays have been widely developed to monitor pesticides in the environment and in food.19–22 Unfortunately, accuracy, stability and recoveries in AuNP-colorimetry are susceptible to matrix interference. Solid phase extraction (SPE) is a powerful tool for extracting analytes from complex samples and minimizing matrix effects.23,24 However, few studies have exploited the combined use of SPE with the AuNP-colorimetric assay.25–27
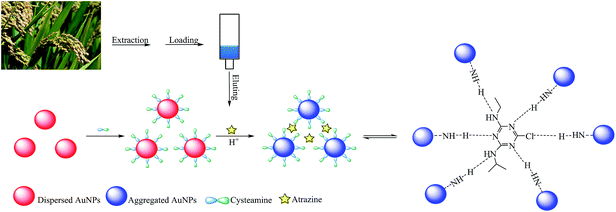
Inspired and encouraged by the analytical potential for SPE linked AuNP colorimetry, this work presents a new colorimetric strategy for the sensitive determination of atrazine in rice samples. Oasis HLB SPE cartridges were used for sample cleanup and enrichment of atrazine, prior to colorimetric detection using cysteamine–AuNPs. It was expected that cysteamine–AuNPs would induce fast aggregation via the hydrogen bonding between atrazine and the –NH3+ on the surface of cysteamine–AuNPs. Thus, changes in absorption spectra (color change, red to blue) can be assessed by using the naked eye or measured by UV-vis spectrophotometry.
2. Experimental section
2.1 Materials
Atrazine and hexazinone were obtained from Sigma Aldrich (www.sigmaaldrich.com, USA).Glucose, L-cysteine and vitamin C were purchased from Aladdin Industrial Corporation. Chloroauric acid was bought from Sinopharm Chemical Reagent Co. Ltd, and primary secondary amine (PSA, 40–60 μm) was obtained from Agela Technologies (Beijing, China). All other reagents were of analytical reagent grade.
The UV-vis absorption spectra were recorded using an Infinite M200 Pro microplate spectrophotometer with a 96-well microplate. Transmission electron microscopy (TEM) was carried out with an H-700 instrument operating at 80 kV.
2.2 Synthesis of AuNPs
Citrate-stabilized AuNP solutions were prepared by using trisodium citrate to reduce HAuCl4 following the reported literature.28 Briefly, 15 mL of trisodium citrate (38.8 mM) was added quickly to a boiling solution of HAuCl4 (150 mL, 1 mM). The mixture was then refluxed with vigorous stirring for 15 min. Next, the red solution was cooled to room temperature and filtered through a 0.22 μm Millipore syringe filter. Finally, the suspension was stored at 4 °C for further use. The size of the AuNPs was about 13 nm according to the TEM images.2.3 Preparation of cysteamine–AuNPs
The cysteamine–AuNPs were obtained by adding 50 μM cysteamine solution into the AuNP solution at a volume ratio of 1![[thin space (1/6-em)]](https://www.rsc.org/images/entities/char_2009.gif) :
:![[thin space (1/6-em)]](https://www.rsc.org/images/entities/char_2009.gif) 100.15 The mixed solution was stirred for 4 h and then washed to remove the excess cysteamine. The final cysteamine–AuNP product was re-dispersed in water and stored at 4 °C.
100.15 The mixed solution was stirred for 4 h and then washed to remove the excess cysteamine. The final cysteamine–AuNP product was re-dispersed in water and stored at 4 °C.
2.4 Colorimetric assay
In a typical experiment, 0.2 mL of 1 mM acetate buffer and 0.2 mL cysteamine–AuNPs were mixed and incubated for 5 min at room temperature. Then, 0.2 mL of atrazine at different concentrations was added into the mixture and the solution was equilibrated for 10 min. The UV-vis absorption spectra were recorded over the wavelength range 400–750 nm. To investigate method selectivity, some common potential interfering substances, such as hexazinone, glucose, L-cysteine, vitamin C, Na+, Mg2+ and Hg2+, were tested by conducting experiments at the same concentration (3.33 μg g−1) (n = 3).2.5 Sample pretreatment
Ten grams of powdered rice was placed into a plastic centrifuge tube and then spiked with different concentrations of atrazine standard solution (0.167, 0.670, and 1.67 μg g−1). After incubation for 30 min, 1 g of MgSO4, 0.5 g of NaCl and 20 mL of ACN were added (in sequence specified) and the mixture was shaken vigorously in a vortex mixer for 5 min. After that, it was centrifuged at 5000 rpm for 5 min and then the supernatant was transferred into another centrifuge tube containing 50 mg of PSA. The mixture was hand-shaken for 30 s and centrifuged at 5000 rpm for 10 min. Then, the supernatant was evaporated to dryness and re-dissolved with 2 mL of methanol. The solution was diluted with pure water to give a total volume of 20 mL. For further purification, the Oasis HLB cartridges were first conditioned using 5 mL of methanol and then 5 mL of high purity water. 20 mL of the aqueous sample was then passed through the cartridge. After washing with 5 mL of water, the cartridge was dried under negative pressure and the analyte was eluted with 10 mL of ACN. The eluate was dried under nitrogen at 40 °C and the residue was re-dissolved in 1 mL of high purity water. Finally, the sample solution was filtered through a 0.22 μm PVDF filter and the precipitate was retained for colorimetric analysis.3. Results and discussion
3.1 Colorimetric sensing scheme
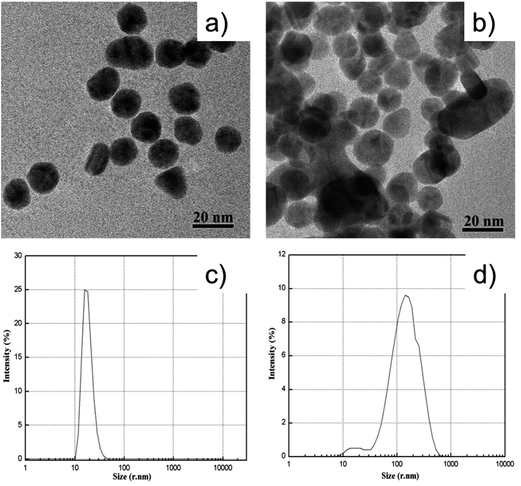
Fig. 1 illustrates the sensing scheme for the detection of atrazine. The cysteamine–AuNPs were used as a specific recognition probe for atrazine at acidic pH (3.8). As reported previously, the mercapto group of cysteamine has a high binding affinity at the surface of AuNPs by forming Au–S bonds. Owing to the positively charged –NH2 moiety, the cysteamine–AuNPs are stabilized and the colloidal solution exhibits a wine red color. When the buffer pH is 3.8, the –NH2 groups on the surface of the AuNPs are readily positively charged to become –NH3+. In this situation, the hydrogen bonding between atrazine and –NH3+ can be formed.13 This then induces aggregation of the cysteamine–AuNPs with an ensuing color change from wine red to blue (purple). In the meantime, the intensity of the surface plasmon resonance absorption peak of the cysteamine–AuNPs at 523 nm gradually decreased and a new absorption band at 640 nm was formed. In addition, the induced aggregation was confirmed through comparison of the TEM images and the particle size distribution images of cysteamine–AuNPs with and without the addition of atrazine (Fig. 2).3.2 Effect of pH
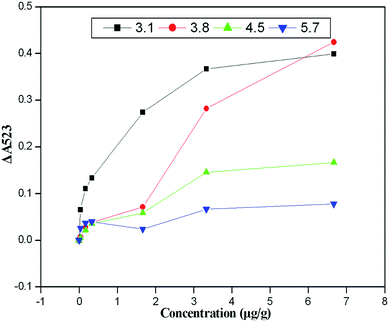
The pH of the reaction solution is critical to ensuring the stability, linear range and sensitivity of the assay. Therefore, the interaction between atrazine and the cysteamine–AuNPs at different pH values (pH 3.1–5.7) was studied. Fig. 3 indicates that the probe showed significant pH dependence based on the interaction between atrazine and the cysteamine–AuNPs. As we have seen, when the pH of the acetate buffer was above 3.8, the cysteamine–AuNPs became less sensitive to the atrazine molecule and the linear range for detection became narrow. When the pH of acetate buffer was below 3.8, the cysteamine–AuNPs more readily aggregated and were especially susceptible to matrix interference. Hence, the pH of the acetate buffer was maintained at 3.8 for all further experiments. In addition, UV-vis spectra of cysteamine–AuNP solution with different concentrations of atrazine under different pH conditions are shown in Fig. S-1 (see the ESI section†).3.3 Colorimetric detection of atrazine
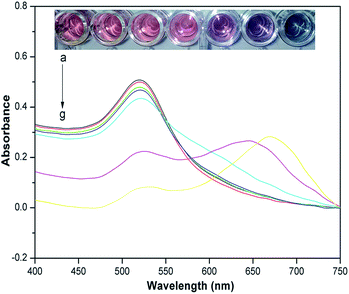
To determine the sensitivity of the assay, several atrazine solutions at different concentrations were tested under optimized conditions. As shown in Fig. 4, the color of the cysteamine–AuNPs solution was wine red, and displayed a strong surface plasmon resonance absorption band at about 523 nm. After the addition of increasing concentrations of atrazine, the intensity of the absorption band at 523 nm decreased and a new absorption peak appeared at 640 nm, this being indicative of a gradually increasing aggregation of the cysteamine–AuNPs. Meanwhile, the color of the solution changed from wine red to blue for the additions of atrazine.The calibration linearity was checked by comparing the difference of the absorbance value at 523 nm in the presence of different concentrations of atrazine. ΔA523 = Ablank − Asample, where ΔA523 is the change of the absorbance value at 523 nm between the blank and the sample with different concentrations of atrazine, Ablank is the absorbance value at 523 nm without any atrazine, Asample is the absorbance value at 523 nm with different concentrations of atrazine. Fig. 5 presents a typical calibration curve which was constructed by plotting the value of ΔA523, versus the atrazine concentration over the range 0.033 to 6.67 μg g−1. The linear relationship is y = 0.0651x + 0.084, with correlation coefficients (R2) of 0.9644. And the detection limit (S/N = 3) for the method was 0.0165 μg g−1. In Table 1, the performance of the present method is compared with other methods for the determination of atrazine and it can be seen that the new method compares favorably being simple, inexpensive and offering high sensitivity with a low detection limit.
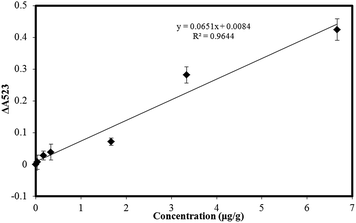 | ||
| Fig. 5 Calibration response for the determination of atrazine. Concentration range, 0.033 μg g−1 to 6.67 μg g−1. Error bars represent the standard deviations of values for three independent analyses. | ||
| Method | Linear range (μg g−1) | LOD (μg g−1) | Matrix | Reference |
|---|---|---|---|---|
| GC-MS | 0.05–9.02 | 0.02 | Rice, onion | 7 |
| HPLC-MS/MS | 0.025–0.101 | 0.01 | Urine | 8 |
| Electrochemical immunosensor | 3.2 × 10⁻⁴ to 2.01 | 3.41 × 10⁻⁵ | Red wine | 9 |
| Fluorescent chemosensor | 0–21.57 | 0.388 | Water | 12 |
| Colorimetric detection | 0.033–6.67 | 0.0165 | Rice | This work |
3.4 Selectivity
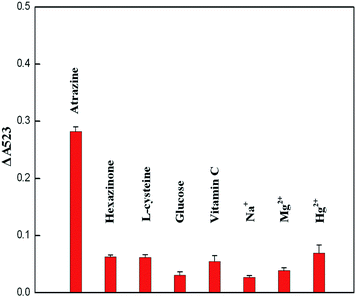
The results are presented in Fig. 6 and the UV-vis spectra of cysteamine–AuNP solution with atrazine and other interfering substances are shown in Fig. S-2 (see the ESI section†). It was found that only atrazine could induce aggregation of cysteamine–AuNPs in the acetate buffer (pH 3.8). For the colorimetric assay alone, the selectivity of this method seems to be not good. But it is possible that the majority of interfering substances in complex samples, such as salts and heavy metal ions can be removed by using water to wash the Oasis HLB cartridge before the atrazine was eluted with ACN in the SPE step. Thus, it is considered that the method has high selectivity for the atrazine molecule and low potential for the interference by using the Oasis HLB cartridges.To validate the practical application of this colorimetric assay, different amounts of atrazine were added to rice samples before sample pretreatment. The spiked rice samples were extracted and purified using the Oasis HLB cartridges, and then analyzed under optimized conditions. As shown in Table 2, analyte recoveries from the spiked rice samples ranged from 82.23–91.65% and the relative standard deviations (RSDs) ranged from 2.69–3.87%. These data indicated that the method was suitable for the determination of atrazine in agricultural samples.
| Rice samples | Added (μg g−1) | Found (μg g−1) | Recovery (%) | R.S.D (%, n = 3) |
|---|---|---|---|---|
| Sample 1 | 0.167 | 0.148 | 88.62 | 2.69 |
| Sample 2 | 0.67 | 0.614 | 91.65 | 3.87 |
| Sample 3 | 1.67 | 1.395 | 83.23 | 3.15 |
4. Conclusion
In summary, a simple, rapid and sensitive colorimetric method for the determination of atrazine in rice samples was successfully developed by combining SPE and cysteamine–AuNPs. Oasis HLB cartridges were used to remove interfering substances and preconcentrate atrazine, thus ensuring enhanced sensitivity and stability for the assay. Owing to the hydrogen bonding between atrazine and cysteamine, aggregation of the cysteamine–AuNPs was induced and the red-to-blue color change was readily observed by the naked eye or recorded using a UV-vis spectrometer without the need for sophisticated instrumentation. The method was able to detect low concentrations of atrazine (0.0165 μg g−1), levels which meet the requirements of the MRLs (China) for atrazine in agriculture-based foods. Overall, the method has the potential to determine atrazine in diverse foods and environmental samples.Acknowledgements
This work was supported by the National Natural Science Foundation of China (No. 31171890), the Special Fund for Agro-Scientific Research in the Public Interest (201209094) and the Innovation Team of Residue Detection & Behavior for Agricultural Contaminants (The Science and Technology Innovation Program of the Chinese Academy of Agriculture).References
- T. B. Hayes, L. L. Anderson, V. R. Beasley, S. R. de Solla, T. Iguchi, H. Ingraham, P. Kestemont, J. Kniewald, Z. Kniewald and V. S. Langlois, J. Steroid Biochem., 2011, 127, 64–73 CrossRef CAS PubMed.
- F. Qiao, K. H. Row and M. Wang, J. Chromatogr. B: Anal. Technol. Biomed. Life Sci., 2014, 957, 84–89 CrossRef CAS PubMed.
- Y. Wen, L. Chen, J. Li, Y. Ma, S. Xu, Z. Zhang, Z. Niu and J. Choo, Electrophoresis, 2012, 33, 2454–2463 CrossRef CAS PubMed.
- G. Zhao, S. Song, C. Wang, Q. Wu and Z. Wang, Anal. Chim. Acta, 2011, 708, 155–159 CrossRef CAS PubMed.
- A. Bouaid, L. Ramos, M. Gonzalez, P. Fernández and C. Cámara, J. Chromatogr. A, 2001, 939, 13–21 CrossRef CAS PubMed.
- Z. Zhou, M. Jin, J. Ding, Y. Zhou, J. Zheng and H. Chen, Metabolomics, 2007, 3, 101–104 CrossRef CAS.
- D. Djozan and B. Ebrahimi, Anal. Chim. Acta, 2008, 616, 152–159 CrossRef CAS PubMed.
- P. Panuwet, J. V. Nguyen, P. Kuklenyik, S. O. Udunka, L. L. Needham and D. B. Barr, Anal. Bioanal. Chem., 2008, 391, 1931–1939 CrossRef CAS PubMed.
- E. Valera, J. Ramón-Azcón, A. Barranco, B. Alfaro, F. Sánchez-Baeza, M.-P. Marco and Á. Rodríguez, Food Chem., 2010, 122, 888–894 CrossRef CAS.
- E. Pardieu, H. Cheap, C. Vedrine, M. Lazerges, Y. Lattach, F. Garnier, S. Remita and C. Pernelle, Anal. Chim. Acta, 2009, 649, 236–245 CrossRef CAS PubMed.
- J. Dostálek, J. Přibyl, J. Homola and P. Skládal, Anal. Bioanal. Chem., 2007, 389, 1841–1847 CrossRef PubMed.
- R. Liu, G. Guan, S. Wang and Z. Zhang, Analyst, 2011, 136, 184–190 RSC.
- G. Liu, X. Yang, T. Li, H. Yu, X. Du, Y. She, J. Wang, S. Wang, F. Jin and M. Jin, Microchim. Acta, 2015, 182(11–12), 1983–1989 CrossRef CAS.
- K. Saha, S. S. Agasti, C. Kim, X. Li and V. M. Rotello, Chem. Rev., 2012, 112, 2739–2779 CrossRef CAS PubMed.
- X. Liang, H. Wei, Z. Cui, J. Deng, Z. Zhang, X. You and X.-E. Zhang, Analyst, 2011, 136, 179–183 RSC.
- H. Deng, X. Zhang, A. Kumar, G. Zou, X. Zhang and X.-J. Liang, Chem. Commun., 2013, 49, 51–53 RSC.
- X. Zhang, H. Zhao, Y. Xue, Z. Wu, Y. Zhang, Y. He, X. Li and Z. Yuan, Biosens. Bioelectron., 2012, 34, 112–117 CrossRef CAS PubMed.
- H. Su, H. Fan, S. Ai, N. Wu, H. Fan, P. Bian and J. Liu, Talanta, 2011, 85, 1338–1343 CrossRef CAS PubMed.
- Q. Xu, S. Du, H. Li and X. Y. Hu, Microchim. Acta, 2011, 173, 323–329 CrossRef CAS.
- W. Liu, D. Zhang, W. Zhu, S. Zhang, Y. Wang, S. Yu, T. Liu, X. Zhang, W. Zhang and J. Wang, Microchim. Acta, 2015, 182, 401–408 CrossRef CAS.
- D. Liu, W. Chen, J. Wei, X. Li, Z. Wang and X. Jiang, Anal. Chem., 2012, 84, 4185–4191 CrossRef CAS PubMed.
- J. Sun, L. Guo, Y. Bao and J. Xie, Biosens. Bioelectron., 2011, 28, 152–157 CrossRef CAS PubMed.
- Q. Liu, J. Shi, J. Sun, T. Wang, L. Zeng and G. Jiang, Angew. Chem., Int. Ed., 2011, 123, 6035–6039 CrossRef.
- L. Vidal, M.-L. Riekkola and A. Canals, Anal. Chim. Acta, 2012, 715, 19–41 CrossRef CAS PubMed.
- H. Chi, B. Liu, G. Guan, Z. Zhang and M.-Y. Han, Analyst, 2010, 135, 1070–1075 RSC.
- K. M. Giannoulis, D. L. Giokas, G. Z. Tsogas and A. G. Vlessidis, Talanta, 2014, 119, 276–283 CrossRef CAS PubMed.
- J. Sittiwong and F. Unob, Spectrochim. Acta, Part A, 2015, 138, 381–386 CrossRef CAS PubMed.
- Y. Zhou, P. Wang, X. Su, H. Zhao and Y. He, Talanta, 2013, 112, 20–25 CrossRef CAS PubMed.
Footnote |
| † Electronic supplementary information (ESI) available. See DOI: 10.1039/c5ay02810h |
| This journal is © The Royal Society of Chemistry 2016 |

