 Open Access Article
Raman microspectroscopic analysis of fibers in beverages†
Alexandra C.
Wiesheu
,
Philipp M.
Anger
,
Thomas
Baumann
,
Reinhard
Niessner
and
Natalia P.
Ivleva
*
Institute of Hydrochemistry, Chair of Analytical Chemistry, Technical University of Munich, Marchioninistr. 17, 81377 Munich, Germany. E-mail: natalia.ivleva@ch.tum.de
First published on 15th June 2016
Abstract
This technical note illustrates the applicability of Raman microspectroscopy (RM) for the analysis of the synthetic fiber content in different beverages (beer and mineral water). The particles and fibers were collected by filtration on a cellulose nitrate membrane filter (pore size = 0.45 μm) and subsequently identified and quantified by RM. Our results show no significant differences (p = 0.95) in the statistical distribution of fibers in beverage and blank samples, which suggests external contamination sources. Moreover, most of the identified fibers consisted of cellulose, which is a natural fiber and harmless compared to synthetic fibers. The other fibers identified were mainly made of polyethylene, which is used as a packaging material for the cellulose nitrate filter. Our study highlights the need for spectroscopic analysis as well as the use of adequate blank samples and an almost particle-free lab environment. Spectroscopic identification is crucial for the discrimination between cellulose and synthetic fibers; otherwise artefacts cannot be recognized and the interpretation will be misleading. The qualitative and quantitative analysis performed in our laboratory could not confirm the contamination of beverages with synthetic fibers reported by previous studies which relied on optical identification alone.
1. Introduction
Synthetic materials such as plastics are nowadays widely valued for their manifold applications due to their properties such as inertness, formability and low costs. Consequently, the production of plastics has increased strongly in the last decades (up to 311 million tons in 2014)1. With the very slow degradation of plastics, the amount of plastic waste also rose to an alarming amount.The presence of microplastics (MPs) attracted the attention of the scientific community as well as public media. MPs are commonly defined as particles and fibers with 1 μm to 5 mm size in the largest dimension.2,3 Lately MPs have been found in several aquatic ecosystems at high concentrations4–7 and recently have also been found in atmospheric fallout.8 It was shown that different aquatic organisms will uptake MPs, which can have severe effects on their health.4,9 Although there are no studies on the effects of MPs on humans, negative influences on the health cannot be ruled out at this stage. Therefore, qualitative and quantitative determination of MPs in food and beverages for human consumption is essential. A recent publication that reported a high number of synthetic fibers in German beers received broad attention in the public media.10 The authors state that the identification of MPs was only performed optically. However, an “unambiguous proof” is only possible by means of spectroscopic methods (for a short evaluation of staining methods used, the reader is referred to the ESI†). For an accurate classification of synthetic fibers, harmless natural cellulose fibers have to be excluded.
Raman microspectroscopy (RM) has been established for the identification of MPs.4,7,11–13 RM is the combination of Raman spectroscopy, which is based on the inelastic scattering of light, and an optical microscope. It enables a non-contact and non-invasive acquisition of fingerprint spectra with a spatial resolution down to 1 μm. Therefore, synthetic fibers can be identified individually and distinguished from natural fibers (e.g. cellulose).
In this technical note, we perform a qualitative and quantitative analysis of fibers collected from beer and bottled mineral water by means of Raman microspectroscopy. Our results indicate that the mere optical identification of fibers is insufficient and the use of blanks is indispensable.
2. Materials and methods
2.1 Samples
Three 0.33 L bottles of a Pilsener type beer from the same batch and a sample (3 L) of bottled mineral water were analyzed.2.2 Sample preparation
Before use, all glassware (glass filtering system, Sartorius AG, Germany) was thoroughly cleaned with 10 vol% nitric acid (Carl Roth GmbH & Co. KG, Karlsruhe, Germany) and purified water (Milli-Q, Merck KGaA, Germany) and immediately covered with Petri dishes cleaned by the same procedure. The whole filtration was performed in a laminar flow box (cleanroom ISO 5 after ISO 14644-1; Spetec, Germany) in order to reduce contamination through air. Washing with the target fluid (beer or water) was repeated three times to remove other fibers and ensure that the found fibers stem from the fluid of interest. Subsequently, the sample was filtered with a membrane pump (Vacuubrand GmbH & Co KG, Germany) over a cellulose nitrate filter (0.45 μm pore size, Sartorius AG, Germany). The filter was withdrawn, placed in a Petri dish, dried and stored in a sealed vessel to prevent contamination. In order to obtain blank samples, the already analyzed sample (beer or water) was filtered a second time over a new filter. For control, an additional moistened filter was placed during the filtration step in the laminar flow box. All personnel wore lab coats made of 100% cotton.2.3 Raman microspectroscopy
For qualitative and quantitative analysis, Raman spectra were recorded with a Horiba LabRAM HR Raman microscope system (Horiba Jobin Yvon, Japan) with a frequency-doubled Nd:YAG laser (532 nm, 0.84 mW at the sample) and an integrated Olympus BXFM microscope. The laser beam was focused with a 50× magnification long working distance objective (Olympus, NA = 0.50) and Raman scattering was recorded in a 180° geometry after Rayleigh and anti-Strokes scattering were removed by means of an edge filter. A diffraction grating with 600 lines per mm and a confocal pinhole with 100 μm diameter were used. The spectra were recorded in a spectral range from 50 to 4000 cm−1 and with a recording time from 10 s to 100 s depending on the sample. The wavelength calibration was performed by focusing on a silicon wafer and analyzing the first order phonon band of silicon at 520.7 cm−1. All samples were directly analyzed on the filter. For each found fiber, a spectrum was recorded and compared to a commercial spectral library (Thermo Fisher Scientific, USA).3. Results and discussion
3.1 Beer samples
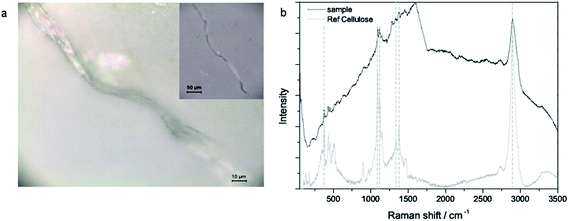
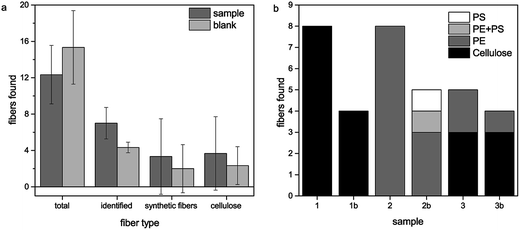
We found fibers in all three samples as well as in the blank samples. The total amount of fibers ranged from 10 to 19 fibers per filter (0.33 L bottle) in the sample filters as well as in the blank filters (see Fig. 1). Some fibers could not be identified due to a high fluorescence background. In the first sample and blank, all of the identified fibers consisted of cellulose, whereas in the second sample and blank only synthetic fibers could be found. The third filter shows a mixture of both cellulose and synthetic fibers (see Fig. 2). The synthetic fibers consisted mainly of polyethylene (PE), but also polystyrene (PS) and a mixture of PE and PS could be identified. Surprisingly, no polyethylene terephthalate (PET) was found although most of the synthetic fibers for cloths are made of PET. All found fibers belong to the microplastic size class, i.e. the longest size dimension (length) was between 1 μm and 5 mm. Statistical analysis shows that there is no significant (p = 0.95) difference in the distribution of the sample and blank measurements in all four categories (found, identified, synthetic and cellulose fibers). This indicates that the occurrence of cellulose as well as synthetic fibers does not derive from the beer sample itself but from external contamination although much effort was taken for its prevention. The additional moistened filter in the laminar flow bench contained 25 fibers, of which all identifiable fibers (17) were made of cellulose, which suggests that this contamination stems from air. | ||
| Fig. 2 (a) Microscopic image (50×, 10× in inset) of the fiber and (b) Raman spectra of the sample and cellulose reference. | ||
Next we investigated the contamination sources. A possible contamination source is the packaging material of the cellulose nitrate filters, which contains PE. This could explain the contamination with PE which was most prevalent in the synthetic fibers. Moreover, the PE particles found were often rod shaped but did not possess a total fibrous form. This also indicates that the PE contamination might stem from the packaging material. Analysis of a pure unused filter showed also a PE fiber besides some (6) cellulose fibers. Furthermore, the optical examination of a dry filter lying on the Raman microscope stage for examination over several days showed that the total number of fibers found is constant. This suggests that no contamination in the lab takes place after the filtration. Therefore, the contamination sources should be found during the filtration step where the filter is still wet. The lab coat is a probable source of contamination with cellulose fibers; however we also found cellulose fibers including the spectrum of indigo, a dye for example used in blue jeans, which suggests a contamination stemming from the trousers worn by the lab personnel under the lab coat during filtration.
3.2 Bottled mineral water samples
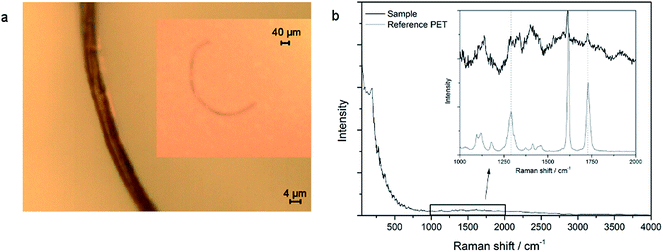
The analysis of bottled mineral water samples showed similar results. The vast majority of all fibers consist of cellulose. Here, only one synthetic fiber (PET) was found in one of the water samples. The spectrum and image can be seen in Fig. 3. The nature of this fiber indicates that it might stem from polyester clothing. As the fiber content is high in both the blank samples and the bottled water samples, no statement on the origin of this fiber can be made. It seems highly likely that it also might derive from air contamination and not from the beverage itself. | ||
| Fig. 3 (a) Microscopic image (50×, 10× in inset) of a fiber and (b) Raman spectra of the sample and PET reference. | ||
4. Conclusions
The results of our study show that RM is a very suitable method for the identification of fibers in beverage samples. Furthermore, it indicates that even with using a laminar flow bench and paying special attention to sample preparation and handling, contaminations cannot be totally eliminated but can only be reduced. This is due to their ubiquitous presence even in the packaging material of the filters. The samples have to be handled with extreme care during the filtration step in order to minimize the contamination. It seems that most fibers adsorb on the moistened filter; therefore the right choice of blank filters is essential. Our study moreover suggests that former studies on MPs in beer, where neither a clean room nor adequate blank samples were used, might not be scientifically reliable. For the MP fiber content of beer and mineral water, no sound analysis can be performed without additional identification by currently available spectroscopic methods. Our results showed no statistically significant difference in the fiber distribution between blank and sample filters. Therefore, our results cannot confirm the contamination of beverages with synthetic fibers. Further extended qualitative and quantitative analysis of fibers in different beverage samples as well as investigation on the origin and diminution of fiber contamination have to be performed before reliable results can be expected.Acknowledgements
The authors would like to thank Martina Ueckert for the preparation of the mineral water samples. For analysis of bottled mineral water, the samples and partial funding were provided by Gehring-Bunte Getränkeindustrie GmbH & Co. KG, Germany.References
- PlasticsEurope, 2015.
- C. M. Rochman, M. A. Browne, B. S. Halpern, B. T. Hentschel, E. Hoh, H. K. Karapanagioti, L. M. Rios-Mendoza, H. Takada, S. Teh and R. C. Thompson, Nature, 2013, 494, 169–171 CrossRef CAS PubMed.
- V. Hidalgo-Ruz, L. Gutow, R. C. Thompson and M. Thiel, Environ. Sci. Technol., 2012, 46, 3060–3075 CrossRef CAS PubMed.
- H. K. Imhof, N. P. Ivleva, J. Schmid, R. Niessner and C. Laforsch, Curr. Biol., 2013, 23, R867–R868 CrossRef CAS PubMed.
- M. R. Gregory, Philos. Trans. R. Soc., B, 2009, 364, 2013–2025 CrossRef PubMed.
- E. L. Teuten, J. M. Saquing, D. R. U. Knappe, M. A. Barlaz, S. Jonsson, A. Bjorn, S. J. Rowland, R. C. Thompson, T. S. Galloway, R. Yamashita, D. Ochi, Y. Watanuki, C. Moore, H. V. Pham, T. S. Tana, M. Prudente, R. Boonyatumanond, M. P. Zakaria, K. Akkhavong, Y. Ogata, H. Hirai, S. Iwasa, K. Mizukawa, Y. Hagino, A. Imamura, M. Saha and H. Takada, Philos. Trans. R. Soc., B, 2009, 364, 2027–2045 CrossRef CAS PubMed.
- H. K. Imhof, C. Laforsch, A. C. Wiesheu, J. Schmied, P. M. Anger, R. Niessner and N. P. Ivleva, Water Res., 2016, 98, 64–74 CrossRef CAS PubMed.
- R. Dris, J. Gasperi, M. Saad, C. Mirande and B. Tassin, Mar. Pollut. Bull., 2016, 104, 290–293 CrossRef CAS PubMed.
- J. A. Ivar do Sul and M. F. Costa, Environ. Pollut., 2014, 185, 352–364 CrossRef CAS PubMed.
- G. Liebezeit and E. Liebezeit, Food Addit. Contam., 2014, 31, 1574–1578 CrossRef CAS PubMed.
- L. Van Cauwenberghe, A. Vanreusel, J. Mees and C. R. Janssen, Environ. Pollut., 2013, 182, 495–499 CrossRef CAS PubMed.
- H. K. Imhof, J. Schmid, R. Niessner, N. P. Ivleva and C. Laforsch, Limnol. Oceanogr.: Methods, 2012, 10, 524–537 CrossRef CAS.
- R. Lenz, K. Enders, C. A. Stedmon, D. M. A. Mackenzie and T. G. Nielsen, Mar. Pollut. Bull., 2015, 100, 82–91 CrossRef CAS PubMed.
Footnote |
| † Electronic supplementary information (ESI) available. See DOI: 10.1039/c6ay01184e |
| This journal is © The Royal Society of Chemistry 2016 |

