Representative sampling? Views from a regulator and a measurement scientist
Analytical Methods Committee, AMCTB No. 73
First published on 6th June 2016
Abstract
The meaning of the term ‘representative sampling’ is unclear and often leads to undue optimism about both the quality of sampling and the reliability of the resultant measurement results and regulatory decisions. The term ‘appropriate sampling’ is preferable to describe sampling that gives rise to measurement values with uncertainties that are fit-for-purpose.
The phrase ‘a representative sample was taken’ is pervasive in scientific reports and published papers. But what does it really mean? Can we rely on the truth of the statement? Is there a better way to achieve our wider goal of reliable measurements and the dependable regulatory decisions that are based upon them?
The regulator's view
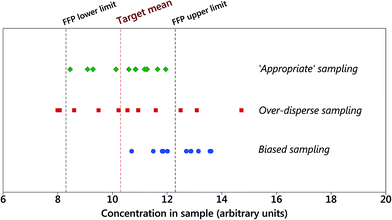
In the world of the environmental regulator, the question of ‘how many samples from a site, or increments from a target, do I need to take to be representative?’ has often been answered with the general advice ‘more than you can afford or are prepared to fund’. Currently a compromise then tends to ensue where neither the regulator nor the regulated are happy.Regulations in many sectors (e.g., environment, food, health) often set a level of compliance as a limit value (e.g., as a maximum, minimum or average value). Demonstrating compliance against this limit requires a sampling and analytical plan (SAP) that often specifies the need for ‘representative’ samples and chemical analysis by an accredited laboratory. The SAP does not often investigate and report uncertainty of the measurements, the variability of the analyte concentration in the material over space or time, or the evidence that the samples were really representative. One way supposedly to demonstrate that sampling is representative is to duplicate it. If the difference between the results is sufficiently small then this goes some way to demonstrating representativeness, but ignores the possibility of a common sampling bias affecting both tests (see Fig. 1). It is relevant, therefore, that ISO 3534-4 (ref. 1) states that ‘the notion of a representative sample is fraught with controversy with some survey practitioners rejecting the term altogether’.
The new approach outlined below, demands a quantitative procedure for answering this question. It indicates that the concept of the mythical ‘representative’ sample should be replaced by that of a more pragmatic but transparent ‘appropriate’ sample, where fitness for purpose (FFP) can be demonstrated and justified on a financial basis of minimum overall cost.
The measurement scientist's view
‘Sample’ has been defined for analytical chemists as ‘a portion of material selected from a larger quantity of material’.2,3 This larger quantity of material is called a ‘sampling target’ and defined3 as a ‘portion of material, at a particular time, that the sample is intended to represent’ (e.g., a batch of food, body of water, or area of land). This use of ‘sample’ is familiar, for example, as the description of a bag of material that is delivered to a laboratory for chemical analysis. By contrast, in statistics, a ‘sample’ is defined more broadly as ‘a portion drawn from a population, the study of which is intended to lead to statistical estimates of the attributes of the whole population’.4 There is the implication in this second definition that the sample is intended to represent the population.The more explicit term ‘representative sample’, has been defined in survey statistics as a ‘sample for which the observed values have the same distribution as that in the population’.1 Some of the ambiguity in this term is revealed by the change in its meaning in the definition for analytical chemistry2 and physical sampling3 as a ‘sample resulting from a sampling plan that can be expected to reflect adequately the properties of interest in the parent population’. This latter definition suggests that a sample will not represent the population perfectly, but only to a degree that is considered acceptable, but this is not made explicit.
An important issue is therefore to specify when an analytical sample can be considered to ‘reflect adequately the properties of interest in the parent population’ One approach has been simply to state that if a physical sample is taken by the ‘correct’ implementation of a ‘correct’ sampling protocol, then the sample will be acceptable by definition.5 A more transparent approach is to describe a sample as ‘appropriate’6 if it enables us to make measurements that are fit-for-purpose.
Fitness for purpose has been defined as ‘the degree to which data produced by a measurement process enables a user to make technically and administratively correct decisions for a stated purpose’.7 One way to identify when measurement results are FFP is to estimate their uncertainty in terms of costs, both of the measurement including sampling and the average consequential costs of incorrect decisions caused by excessive levels of uncertainty. When the sum of both costs is at a minimum, fitness for purpose and appropriate sampling have been achieved at an optimal level of measurement uncertainty.8 It is often the case that the sampling process contributes the dominant proportion of the measurement uncertainty. In that case fitness can be achieved most cost-effectively by adjusting the uncertainty arising from the sampling process.
There are at least two ways that sampling can be made appropriate. The mass of the sample can be changed, typically by altering the number of increments that are collected within the sampling target to make a composite sample. Alternatively, the number of samples (n) taken from the sampling site, and analysed individually, can be changed. The uncertainty on the calculated mean value, expressed as the standard error on the mean (s/√n), can be thereby reduced. This quantitative approach can be used decide how many samples (or increments) are needed for a particular site (or target), to make the sampling appropriate. Refinements in these broad calculations are needed where the frequency distributions are not normal, and for low values of n.
Conclusions
• The term ‘representative sample’ generally has no rigorous, transparent meaning. It is often used in an aspirational sense that might be more accurately reported as ‘a sample was taken that was intended to reflect exactly the properties of the parent material, but there is no evidence that it does’.• The most reliable action is not to believe that a sample is representative, but to seek specific rigorous evidence from validation. A sample could never be perfectly representative because the sample is never identical to the average composition of the sampling target (i.e., parent population): there will always be residual random and systematic differences. These effects need be to acceptable small and the resulting uncertainty explicitly stated.
• A better way to achieve the wider goal of reliable measurements, and the regulatory decisions that are based upon them, is to move away from ‘representative’ to ‘appropriate’ sampling. An ‘appropriate’ sample is one for which the resultant measurement value has an uncertainty that is fit for its intended purpose. Evidence that sampling can be judged ‘appropriate’ could be that results of a validation procedure in which the measurement uncertainty arising from sampling according to a given protocol was deemed fit for purpose. Samples derived from the subsequent applications of this validated protocol to other sampling targets could be considered appropriate if sampling and analytical quality control procedures showed no significant deviation from the values found at the validation.
M. H. Ramsey (University of Sussex) and B. Barnes (Environment Agency)
This Technical Brief was drafted on behalf of the Subcommittee for Uncertainty from Sampling and approved by the Analytical Methods Committee on 29/04/16.
References
- ISO, 2014 ISO 3534:2014, Statistics – Vocabulary and symbols Part 4: Survey sampling.
- W. Horwitz, IUPAC nomenclature for sampling in analytical chemistry, Pure Appl. Chem., 1990, 62, 1193–1208 CrossRef CAS.
- Eurachem/EUROLAB/CITAC/Nordtest/AMC Guide, Measurement uncertainty arising from sampling: a guide to methods and approaches, ed. M. H. Ramsey and S. L. R. Ellison, 2007 Search PubMed.
- Oxford English Dictionary, 8th July 2015, http://www.oup.com/.
- P. M. Gy, Sampling particulate material systems, Elsevier, Amsterdam, 1st edn, 1979, p. 431 Search PubMed.
- M. H. Ramsey, Accredit. Qual. Assur., 2002, 7, 274–280 CrossRef.
- M. Thompson and M. H. Ramsey, Analyst, 1995, 120, 261–270 RSC.
- M. Thompson and T. Fearn, Analyst, 1996, 121, 275–278 RSC.
| This journal is © The Royal Society of Chemistry 2016 |


