Inter-tube adhesion mediates a new pearling mechanism†
Tongtao
Yue
a,
Falin
Tian
b,
Mingbin
Sun
a,
Xianren
Zhang
*b and
Fang
Huang
*a
aState Key Laboratory of Heavy Oil Processing, Center for Bioengineering and Biotechnology, China University of Petroleum (East China), Qingdao, 266580, China. E-mail: fhuang@upc.edu.cn
bState Key Laboratory of Organic-Inorganic Composites, Beijing University of Chemical Technology, Beijing, 100029, China. E-mail: zhangxr@mail.buct.edu.cn
First published on 19th November 2015
Abstract
A common mechanism for intracellular transport is the controlled shape transformation, also known as pearling, of membrane tubes. Exploring how tube pearling takes place is thus of quite importance to not only understand the bio-functions of tubes, but also promote their potential biomedical applications. While the pearling mechanism of one single tube is well understood, both the pathway and the mechanism of pearling of multiple tubes still remain unclear. Herein, by means of computer simulations we show that the tube pearling can be mediated by the inter-tube adhesion. By increasing the inter-tube adhesion strength, each tube undergoes a discontinuous transition from no pearling to thorough pearling. The discontinuous pearling transition is ascribed to the competitive variation between tube surface tension and the extent of inter-tube adhesion. Besides, the final pearling instability is also affected by tube diameter and inter-tube orientation. Thinner tubes undergo inter-tube lipid diffusion before completion of pearling. The early lipid diffusion reduces the extent of inter-tube adhesion and thus restrains the subsequent pearling. Therefore, only partial or no pearling can take place for two thinner tubes. For two perpendicular tubes, the pearling is also observed, but with different pathways and higher efficiency. The finite size effect is discussed by comparing the pearling of tubes with different lengths. It is expected that this work will not only provide new insights into the mechanism of membrane tube pearling, but also shed light on the potential applications in biomaterials science and nanomedicine.
1 Introduction
Lipid membranes are essential for compartmentalization of cells and organelles. One of the characteristic morphologies of lipid membranes is the membrane tube, which plays an important role in a variety of cellular activities, like intracellular transport,1,2 intercellular communication,3,4 and storage of excess membrane area.5,6 In recent years, both the pathway and the mechanism of membrane tube formation and subsequent shape transformation have become a very active field of study.In vivo, membrane tubes are pulled by motor proteins or induced by membrane deformations.7,8 In experiments, membrane tubes can be formed by application of an external force, which can be accomplished via optical or magnetic tweezers,9–15 micropipette aspiration,16,17 or hydrodynamic flow.18 To the best of our knowledge, the mechanism of membrane tube formation is extremely diverse in reality. Besides the intrinsic membrane properties, like membrane tension, spontaneous curvature, membrane asymmetry and membrane bending rigidity, both the formation and stabilization of membrane tubes require the participation of relevant proteins. One typical example is the membrane mediated aggregation of Nematogens, which can both induce and stabilize the membrane tubulation.19 The linear aggregation of nanoparticles on the membrane surface can also induce the membrane tubulation.20,21 The detailed molecular structure of membrane tether formation was reported by Tieleman and his co-workers using molecular dynamics simulations.22 By Monte Carlo simulations, the force barriers for membrane tube formation were measured by Koster et al.23
Once membrane tubes form, both their functions and subsequent fate will be strongly affected by their shape transformation, also known as pearling. In recent years, the mechanisms of membrane tube pearling have been widely investigated both experimentally and theoretically. In general, external interventions are required to induce the membrane tension that can overcome the restoring bending energy. In experiments, the induced tension can be realized by a variety of methodologies. Bar-Ziv and Moses first discovered that the stability of membrane tubes is lost if subjected to optical tweezers.24 They demonstrated that the membrane tube pearling is a competition between membrane tension and membrane curvature. Subsequently, the tension-driven pearling induced by other factors, like magnetic or electric field25,26 and osmotic perturbation,27,28 has been reported. Besides the membrane tension, another parameter to drive tube pearling is the spontaneous membrane curvature,29,30 which can be generated by polymer anchorage31,32 and nanoparticle adsorption.33 Our previous simulations showed that the tube pearling can be accomplished by increasing the inner water pressure and is strongly affected by nanoparticle adsorption onto the outer leaflet.34
It is noteworthy that biological membranes often form highly dynamic tubular networks.35 One typical example is the endoplasmic reticulum that relies on an elaborate tubular membrane network to transport proteins inside the cell. Generally, these tubes are highly dynamic for achieving controllable material transport, moving rapidly and pearling and fusing frequently.35,36 Besides, the adjacent animal cells were found to be connected by long cylindrical membrane tubes, which play important roles in the intercellular communication.37–39 When two membrane tubes meet, the inter-tube adhesion from lipid molecules or specific proteins may induce tube fusion or pearling. For example, recent in vitro experiments showed that the bending instability of a membrane tube could be induced by mechanical adhesion to the neighboring tube.40 Three-way junctions were also observed when two tubes of the same vesicle were brought close to each other.41,42 Nevertheless, the question of how the inter-tube interaction affects the pearling instability still remains largely unsolved.
Our present work is thus motivated by these facts, and aims to elucidate the interaction between two adhering membrane tubes. To this end, two adhering membrane tubes, either parallel or perpendicular to each other, are constructed. By performing both explicit and implicit solvent Dissipative Particle Dynamics (DPD) simulations, we show that the tube pearling can be mediated by the inter-tube adhesion. A number of factors, like inter-tube adhesion strength, tube diameter, and inter-tube orientation, are determinants of the final pearling instability.
2 Models and simulation methods
2.1 Models
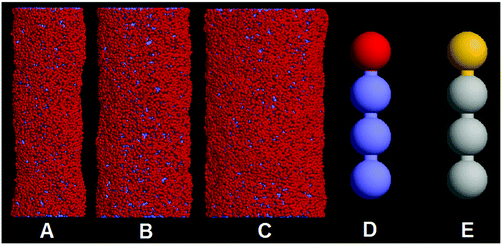
Fig. 1 shows the summary of system components used for the simulations. A number of membrane tubes with different diameters (D = 20 nm, 28 nm, and 36 nm) are constructed (Fig. 1A–C). The simulation box sizes are set to 115 nm × 75 nm × 75 nm and 75 nm × 115 nm × 75 nm for two parallel and perpendicular membrane tubes, respectively. In this work, the lipid molecule is represented by the H1T3 model, where H and T denote the hydrophilic lipid head and the hydrophobic lipid tail, respectively, (Fig. 1D and E). The H1T3 lipid model was first introduced to investigate the dynamics of domain growth in multi-component lipid vesicles.43 Recently, we applied this model to simulate the pearling of a single membrane tube.34 Here, we prepare each membrane tube by initially arranging a number of lipids in a defined cylindrical surface. In order to eliminate the effects of predefined initial configuration and balance the pressure difference across the membrane, each tube is relaxed at a higher temperature for 50![[thin space (1/6-em)]](https://www.rsc.org/images/entities/char_2009.gif) 000 time steps, and then annealed slowly from T = 2.0 to T = 1.0. After 100
000 time steps, and then annealed slowly from T = 2.0 to T = 1.0. After 100![[thin space (1/6-em)]](https://www.rsc.org/images/entities/char_2009.gif) 000 time step equilibrium simulation, two membrane tubes are brought together. In order to distinguish the lipids belonging to different membrane tubes, the hydrophilic beads (H1 and H2) and hydrophobic beads (T1 and T2) of lipids in different tubes are represented by different colors (Fig. 1E). All simulations are performed in the NVT ensemble with constant particle number N, simulation box volume V, and temperature T. The periodic boundary conditions are adopted in three directions.
000 time step equilibrium simulation, two membrane tubes are brought together. In order to distinguish the lipids belonging to different membrane tubes, the hydrophilic beads (H1 and H2) and hydrophobic beads (T1 and T2) of lipids in different tubes are represented by different colors (Fig. 1E). All simulations are performed in the NVT ensemble with constant particle number N, simulation box volume V, and temperature T. The periodic boundary conditions are adopted in three directions.
We notice that the relative short tube length in our simulation might induce the finite size effect that affects the tube–vesicle transformation. In order to confirm that our simulations are free from this effect, we first simulated the pearling of a single tube with a diameter of 28 nm. To accelerate tube pearling, we artificially transferred a number of water beads from the outside to the inside,34 and found that no transformation from tubes to vesicles occurs under lower inner water pressure. Under higher inner water pressure, the cylindrical tubes finally transit to vesicles. Importantly, after pearling occurs, no inverse transformation from vesicles to tubes has been observed after a long simulation time. This implies that the finite size effect plays a minor role in our simulation results.
2.2 Explicit solvent DPD method
The coarse-grained molecular dynamics simulations adopted in this work are based on the DPD technique, a Lagrangian method developed to simulate the hydrodynamic behavior of complex fluids.44–46 Recently, DPD has been successfully and widely used to study the mesoscale behavior of lipid membranes.47–57 In DPD, the elementary units are soft beads whose dynamics are governed by Newton's equation of motion dvi/dt = fi/m. Typically, there are three types of pairwise additive forces acting on bead i by bead j: the conservative force, the dissipative force, and the random force.The conservative force used to model the repulsive interaction of beads i and j is determined using
FCij = aij![[r with combining tilde]](https://www.rsc.org/images/entities/i_char_0072_0303.gif) ijmax{1 − rij/rc,0} ijmax{1 − rij/rc,0} | (1) |
![[r with combining tilde]](https://www.rsc.org/images/entities/i_char_0072_0303.gif) ij = rij/|rij| is the unit vector, rc is the cut-off radius of the force, and aij represents the maximum repulsive strength between beads i and j. For any two beads of same type, we take the repulsive parameter aii = 25, and for any two beads of different types, we set the interaction parameter to denote the hydrophilic/hydrophobic property of the beads as follows: aij = 25, if the two beads are both hydrophilic or hydrophobic, while aij = 200 if one is hydrophilic and the other is hydrophobic. In order to model the inter-tube adhesion, we set the interaction parameter aH1H2 < 25 and vary its value to regulate the inter-tube adhesion strength. Note that when exploring the NP–membrane interaction by DPD simulations, Guo et al. demonstrated that the value of −0.31 kBT/rc2 yields a close agreement between simulations and theoretical analysis.56 As we applied the similar simulation method and parameter set, the value of −0.31 kBT/rc2 can thus approximately represent the relatively strong inter-tube adhesion in the present work. Although some atomic details are sacrificed in the coarse-grained DPD method, the essential features of the system are reproduced by the simulation model and the parameter set.34,43
ij = rij/|rij| is the unit vector, rc is the cut-off radius of the force, and aij represents the maximum repulsive strength between beads i and j. For any two beads of same type, we take the repulsive parameter aii = 25, and for any two beads of different types, we set the interaction parameter to denote the hydrophilic/hydrophobic property of the beads as follows: aij = 25, if the two beads are both hydrophilic or hydrophobic, while aij = 200 if one is hydrophilic and the other is hydrophobic. In order to model the inter-tube adhesion, we set the interaction parameter aH1H2 < 25 and vary its value to regulate the inter-tube adhesion strength. Note that when exploring the NP–membrane interaction by DPD simulations, Guo et al. demonstrated that the value of −0.31 kBT/rc2 yields a close agreement between simulations and theoretical analysis.56 As we applied the similar simulation method and parameter set, the value of −0.31 kBT/rc2 can thus approximately represent the relatively strong inter-tube adhesion in the present work. Although some atomic details are sacrificed in the coarse-grained DPD method, the essential features of the system are reproduced by the simulation model and the parameter set.34,43
The dissipative force has the form,
FDij = −γ(1 − rij/rc)2(![[r with combining tilde]](https://www.rsc.org/images/entities/i_char_0072_0303.gif) ij·vij) ij·vij)![[r with combining tilde]](https://www.rsc.org/images/entities/i_char_0072_0303.gif) ij ij | (2) |
The random force also acts between each pair of particles as
FRij = −σ(1 − rij/rc)2θij![[r with combining tilde]](https://www.rsc.org/images/entities/i_char_0072_0303.gif) ij ij | (3) |
For lipid molecules, we use a harmonic bond between neighboring beads to ensure the integrity of lipids:
FS = KS(rij − req)![[r with combining tilde]](https://www.rsc.org/images/entities/i_char_0072_0303.gif) ij ij | (4) |
| Fφ = −∇Uφ and Uφ = Kφ(1 − cos(φ − φ0)) | (5) |
2.3 Implicit solvent DPD method
In order to reduce the size effect of our observations, we simulate the pearling of membrane tubes with much longer lengths. To speed up the simulations and expand the simulation system, an implicit solvent DPD method was adopted in this work.58–60 In the solvent-free model, an attractive force between two hydrophobic beads belonging to lipids was chosen in accordance with the approach of Cooke et al.:58 | (6) |
Since the simulation model is solvent free, we are able to simulate membrane tubes without volume constraint. This scenario corresponds to long experimental time scales during which the leakage of the tube content occurs. To include the volume constraint during pearling of membrane tubes, we fill each tube with “cargo” beads, which not only mimic the volume constraint due to solvent, but also provide a pressure difference across the membrane.61 These cargo beads possess purely repulsive interactions with the hydrophobic part of lipids and interact with hydrophilic beads of lipids effectively as lipid heads. The cargo–cargo interaction is said to be the same as the lipid head–“cargo” interaction, i.e., there is no effective interaction between “cargo” beads. The pressure difference across the membrane can thus be modulated by varying the number of “cargo” beads inside the tube.
3 Results and discussion
3.1 Three types of pearling instabilities
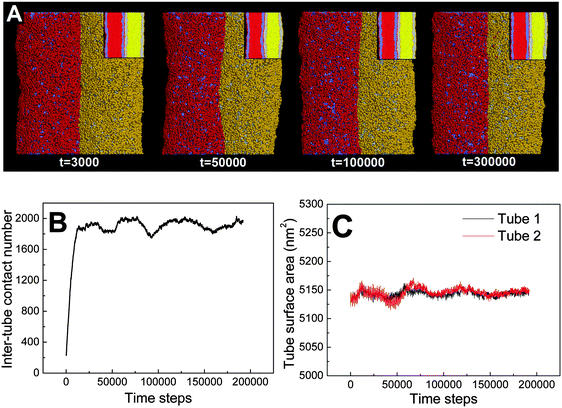
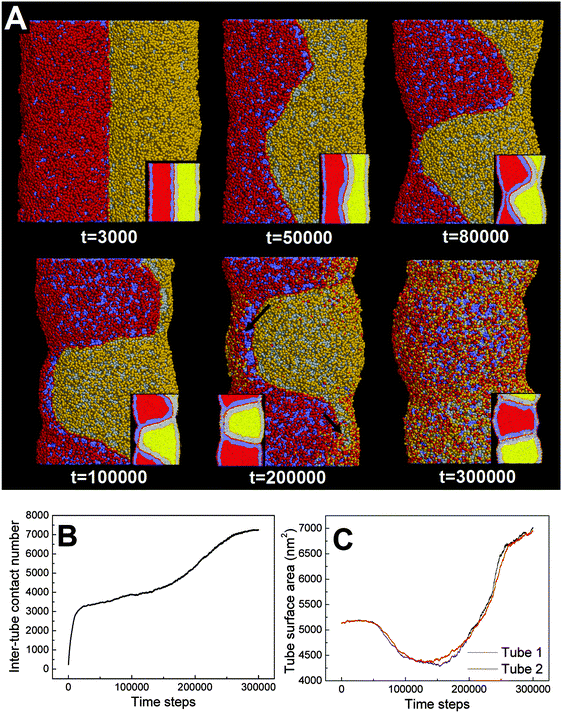
First, we adopt an explicit solvent DPD method to simulate the pearling of two shorter adhering membrane tubes. Here, the tube diameters and tube lengths are set to D1 = D2 = 28 nm and L1 = L2 = 75 nm, respectively. As we gradually increase the inter-tube adhesion strength, three types of pearling instabilities, namely no pearling, thorough pearling and pearling division, are observed. Specifically, no pearling refers to the state of stable tube–tube adhesion with no indication of pearling at all. For thorough pearling instability, each membrane tube is finally divided by two vesicles which are connected by a short cylindrical micelle. When each membrane tube finally transits to a separate vesicle, we define the pearling instability as pearling division.Theoretically, the pearling of two adhering tubes is similar to that of one separate tube. It has been demonstrated that the tube pearling is a competition between membrane tension and membrane curvature.24 For two adhering tubes, the tension increase responsible for tube pearling is derived from the inter-tube adhesion. To increase the inter-tube adhesion area, each tube undergoes a finite deformation in the cross-section (Fig. S1, ESI†). For cylindrical tubes with constant volume, the tube deformation increases the tube surface area and thus increases the membrane tension. On a molecular level, the increase of inter-tube adhesion area is also accomplished via directed lipid diffusion from the non-contact region to the inter-tube contact region. The directed lipid diffusion decreases the lipid density in the non-contact region and thus further increases the local membrane tension. In our previous work, we have found that vesicles undergo rupture when strongly adhering to a planar membrane.50 The vesicle rupture was ascribed to the high tension induced by both vesicle deformation and directed lipid diffusion. This is quite similar to our present case, in which the tension of both tubes is increased by inter-tube adhesion. Nevertheless, under such weak inter-tube adhesion strength (aH1H2 = 14), the resultant tension increase does not balance the membrane curvature. Therefore, no obvious pearling takes place for the two membrane tubes. We accordingly refer to the specific pearling instability as no pearling.
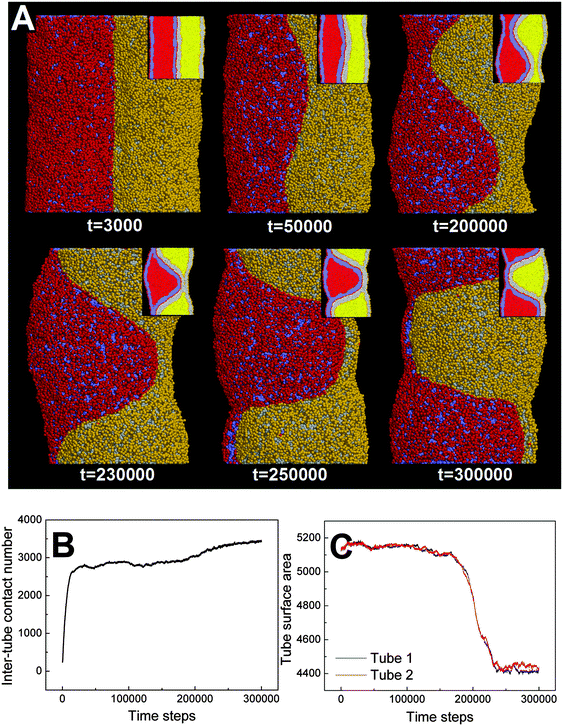
![[thin space (1/6-em)]](https://www.rsc.org/images/entities/char_2009.gif) 000). Therefore, the tube pearling will not terminate until the thorough pearling is completed. Here, the thorough pearling of two tubes is reflected by a striking decrease of the tube surface area (Fig. 3C).34 We note that a recent in vitro experiment demonstrated that the bending instability of a membrane tube could be induced by mechanical adhesion to the neighboring tube.40 Our simulations of tube pearling by inter-tube adhesion support the experimental results and furthermore provide a theoretical explanation for these experimental observations.
000). Therefore, the tube pearling will not terminate until the thorough pearling is completed. Here, the thorough pearling of two tubes is reflected by a striking decrease of the tube surface area (Fig. 3C).34 We note that a recent in vitro experiment demonstrated that the bending instability of a membrane tube could be induced by mechanical adhesion to the neighboring tube.40 Our simulations of tube pearling by inter-tube adhesion support the experimental results and furthermore provide a theoretical explanation for these experimental observations.
It should be noted that pearling of single membrane tubes is axisymmetric and the pearled tube surface can thus be described by a sinusoidal curve.24 For two adhering tubes, however, the axisymmetric pearling shape is strongly perturbed by the inter-tube adhesion. In more detail, the whole shape of the two adhering tubes gradually develops into a cylinder to minimize the surface tension as the pearling proceeds (Fig. 3A, t = 250![[thin space (1/6-em)]](https://www.rsc.org/images/entities/char_2009.gif) 000). But the shape of each pearled tube gradually changes to be polygon-like. The pearling shapes of two adhering tubes are complementary to each other to maximize the inter-tube adhesion (Fig. 3A).
000). But the shape of each pearled tube gradually changes to be polygon-like. The pearling shapes of two adhering tubes are complementary to each other to maximize the inter-tube adhesion (Fig. 3A).
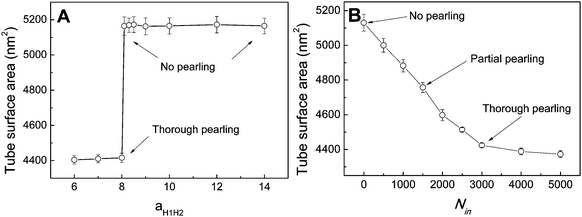
In fact, as we slowly decrease the interaction parameter from aH1H2 = 14 to aH1H2 = 8, the transition from no pearling to thorough pearling is not continuous. In other words, no intermediate pearling instability is observed when 8 <aH1H2 < 14. The discontinuous pearling transition is well reflected by the equilibrium surface area of two adhering tubes as a function of the interaction parameter (Fig. 4A). Specifically, the equilibrium surface area remains nearly unchanged when the interaction parameter aH1H2 is larger than 8.0. Once the value of aH1H2 is decreased from 8.1 to 8.0, the equilibrium surface area suddenly decreases from 5170 nm2 to about 4400 nm2. Accordingly, the discontinuous transition from no pearling to thorough pearling is observed.
We interpret the discontinuous pearling transition as a result of the complicated competition between tube surface tension and inter-tube adhesion. On the one hand, maximizing inter-tube adhesion energy is accomplished by increasing the inter-tube contact area. In the early stage, the sudden increase of the inter-tube contact area is mainly realized by tube deformation (Fig. S1, ESI†). Afterwards, lipid molecules from the non-contact region tend to diffuse and gather at the inter-tube contact region. The tube deformation as well as the directed lipid diffusion increases the tension of both tubes. Once the tension exceeds a critical value, it balances the membrane curvature and thus drives the subsequent pearling transition. On the other hand, the tube pearling is accompanied by a striking decrease of the tube surface area, which means tension release to some extent (Fig. 3C). Once the tension is somewhat released, the inter-tube contact area would further increase and thus leads to a higher extent of tube pearling (Fig. 3B, t > 200![[thin space (1/6-em)]](https://www.rsc.org/images/entities/char_2009.gif) 000). It is speculated that the competition process would not terminate until thorough pearling is completed for both tubes.
000). It is speculated that the competition process would not terminate until thorough pearling is completed for both tubes.
To further understand the discontinuous pearling transition of two adhering tubes, we then simulate the pearling of a single tube. In order to accomplish the tube pearling, a certain amount of solvent particles is transferred from the outside to the inside of the tube. The membrane tension can thus be indirectly modulated by varying the inner water pressure.34 After simulation completes, the average tube surface area is calculated under different inner water pressures. According to Fig. 4B, the average tube surface area decreases continuously with the inner water pressure. This suggests that the pearling transition for a single membrane tube is continuous. We analyze that once the tension of one single tube is released by pearling it will not be increased again during the whole pearling process. This is different from the case of two adhering tubes, for which the tension released by tube pearling can further promote the inter-tube adhesion to a higher extent. In return, the tension can further be increased by a higher extent of inter-tube adhesion. Therefore, the pearling proceeds until thorough pearling completes. Nevertheless, we must admit that a direct comparison between Fig. 4A and B is not meaningful. This is because the inter-tube adhesion strength for two adhering tubes and the inner water pressure for a single tube both determine the tube surface tension, but in different ways.
In our simulations, the pearling division of two adhering tubes is both thermodynamically and dynamically related. Energetically, the lower value of aH1H2 leads to a higher extent of inter-tube adhesion, which further results in a higher increase of membrane tension for both tubes (Fig. 5B). The higher tension increase is indirectly reflected by a larger inter-tube contact number after thorough pearling completes (Fig. 5B, t = 150![[thin space (1/6-em)]](https://www.rsc.org/images/entities/char_2009.gif) 000). After a short equilibrium, both tubes undergo the pearling division, which is accompanied by a striking increase of the tube surface area (Fig. 5C). This is different from that of a single tube, the pearling division of which is reflected by a striking area decrease.34 The opposite trend is because we calculate the tube surface area by cutting each membrane tube into a number of slices and summing the area of each slice. Therefore, the sudden increase of the calculated tube surface area is ascribed to the inter-tube lipid diffusion (Fig. 5A, t = 200
000). After a short equilibrium, both tubes undergo the pearling division, which is accompanied by a striking increase of the tube surface area (Fig. 5C). This is different from that of a single tube, the pearling division of which is reflected by a striking area decrease.34 The opposite trend is because we calculate the tube surface area by cutting each membrane tube into a number of slices and summing the area of each slice. Therefore, the sudden increase of the calculated tube surface area is ascribed to the inter-tube lipid diffusion (Fig. 5A, t = 200![[thin space (1/6-em)]](https://www.rsc.org/images/entities/char_2009.gif) 000). Theoretically, when lipids of two tubes are completely mixed, the real tube surface area will be half of the final calculated value for each tube. In other words, the tube surface area after pearling division is about 3500 nm2, which is much smaller than that after thorough pearling completes (Fig. 5C). Therefore, the final pearling division of two adhering tubes further releases the tube surface tension and is thus energetically favorable. Dynamically, the pearling division is accomplished via inter-tube fusion, which is first initiated at the point of contact between the cylindrical micelle of one tube and the membrane of the other tube (Fig. 5A, t = 200
000). Theoretically, when lipids of two tubes are completely mixed, the real tube surface area will be half of the final calculated value for each tube. In other words, the tube surface area after pearling division is about 3500 nm2, which is much smaller than that after thorough pearling completes (Fig. 5C). Therefore, the final pearling division of two adhering tubes further releases the tube surface tension and is thus energetically favorable. Dynamically, the pearling division is accomplished via inter-tube fusion, which is first initiated at the point of contact between the cylindrical micelle of one tube and the membrane of the other tube (Fig. 5A, t = 200![[thin space (1/6-em)]](https://www.rsc.org/images/entities/char_2009.gif) 000). Besides, once the inter-tube fusion is initiated the inter-tube lipid diffusion would continue until the lipids of two tubes are completely mixed. After the inter-tube fusion completes, both tubes finally transform into two adhering vesicles (Fig. 5A, t = 300
000). Besides, once the inter-tube fusion is initiated the inter-tube lipid diffusion would continue until the lipids of two tubes are completely mixed. After the inter-tube fusion completes, both tubes finally transform into two adhering vesicles (Fig. 5A, t = 300![[thin space (1/6-em)]](https://www.rsc.org/images/entities/char_2009.gif) 000).
000).
In order to verify the critical role of inter-tube fusion in pearling division, we purposely vary the interaction parameter between the hydrophobic tails of lipids belonging to different tubes. As we increase the interaction parameter to aT1T2 = 200, the inter-tube fusion is artificially restrained (Fig. 6). As a result, the thorough pearling turns to be stable and no pearling division is observed during our simulation. This suggests that for two parallel membrane tubes, the inter-tube membrane fusion is the only way to realize the transition from pearling to pearling division.
3.2 Effect of tube diameter on pearling
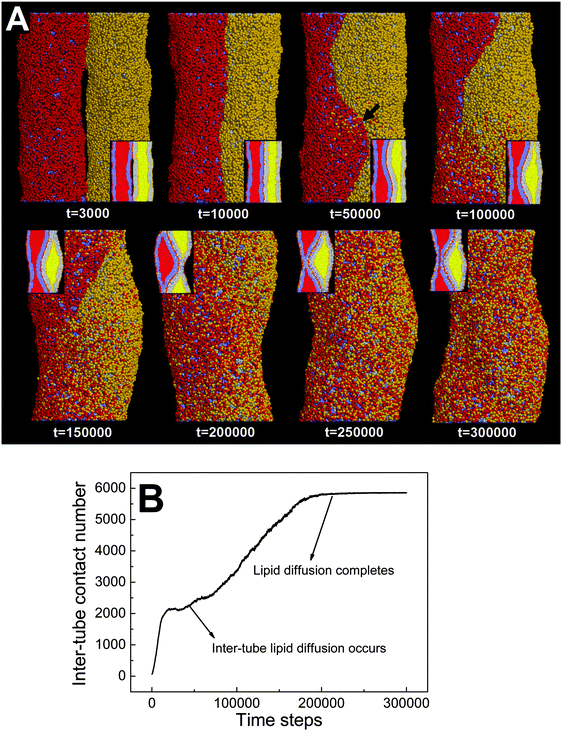
In the above section, we have shown that by varying the inter-tube adhesion strength three different pearling instabilities, namely no pearling, thorough pearling and pearling division, can take place. The inter-tube adhesion is interpreted to increase the tube surface tension, which overcomes the membrane bending energy and leads to the pearling transition. Besides the inter-tube adhesion strength, our simulations suggest that the final pearling instability is also affected by the tube diameter.We analyze that decreasing the tube diameter has two kinds of effects. One is to reduce the extent of membrane tube deformation (membrane bending energy dominated). The reduced membrane deformation leads to a lower extent of inter-tube adhesion (Fig. 7B), which further results in a lower increase of membrane tension. The other effect is that the inter-tube lipid diffusion is always observed for two thinner membrane tubes before tube pearling (Fig. 7A, t = 50![[thin space (1/6-em)]](https://www.rsc.org/images/entities/char_2009.gif) 000). Once the inter-tube lipid diffusion is initiated, the inter-tube contact number roughly increases linearly until the lipids of both membrane tubes are completely mixed (Fig. 7B). According to the linear increase of the inter-tube contact number, we approximately measure the lipid diffusion constant across the tube as 0.03 lipids per step. We should note that the inter-tube lipid diffusion constant is affected by a number of factors, like tube diameter and inter-tube adhesion strength. In our simulations, the early inter-tube lipid diffusion effectively reduces the real extent of inter-tube adhesion. More generally, whether a higher extent of tube pearling can take place is determined by the competition between pearling time and inter-tube lipid diffusion time.
000). Once the inter-tube lipid diffusion is initiated, the inter-tube contact number roughly increases linearly until the lipids of both membrane tubes are completely mixed (Fig. 7B). According to the linear increase of the inter-tube contact number, we approximately measure the lipid diffusion constant across the tube as 0.03 lipids per step. We should note that the inter-tube lipid diffusion constant is affected by a number of factors, like tube diameter and inter-tube adhesion strength. In our simulations, the early inter-tube lipid diffusion effectively reduces the real extent of inter-tube adhesion. More generally, whether a higher extent of tube pearling can take place is determined by the competition between pearling time and inter-tube lipid diffusion time.
Here, we should distinguish two interaction pathways. One is the inter-tube lipid diffusion and the other is the inter-tube fusion. Although both pathways are featured by the lipid movement from one tube to the other tube, only inter-tube fusion furthermore induces the topological change of the interacting tubes. Comparatively, inter-tube lipid diffusion generally occurs only for two thinner adhering tubes, which contrarily restrains tube pearling.
It should be pointed out that the inter-tube lipid diffusion is always initiated at the front of the inter-tube adhesion (Fig. 7A, t = 50![[thin space (1/6-em)]](https://www.rsc.org/images/entities/char_2009.gif) 000). The preferential lipid diffusion location is ascribed to the fact that the inter-tube lipid diffusion is mediated by lipid tail protrusion. It has been shown both theoretically and experimentally that the lipid tail protrusion is enhanced for a highly curved system.62–64 For example, a recent experiment demonstrated that membrane insertion of NPs mediated by lipid tail protrusion is preferentially initiated at the membrane edge with higher curvature.62 Besides, both MD and DPD simulations described that vesicle fusion via lipid protrusion would first take place at locations of high membrane curvature.65,66 This is consistent with our present case in which the local membrane curvature of the tube–tube–water interface is much higher than that of the tube–tube interface.
000). The preferential lipid diffusion location is ascribed to the fact that the inter-tube lipid diffusion is mediated by lipid tail protrusion. It has been shown both theoretically and experimentally that the lipid tail protrusion is enhanced for a highly curved system.62–64 For example, a recent experiment demonstrated that membrane insertion of NPs mediated by lipid tail protrusion is preferentially initiated at the membrane edge with higher curvature.62 Besides, both MD and DPD simulations described that vesicle fusion via lipid protrusion would first take place at locations of high membrane curvature.65,66 This is consistent with our present case in which the local membrane curvature of the tube–tube–water interface is much higher than that of the tube–tube interface.
![[thin space (1/6-em)]](https://www.rsc.org/images/entities/char_2009.gif) 000), the thinner tube first undergoes thorough pearling and pearling division (t = 200
000), the thinner tube first undergoes thorough pearling and pearling division (t = 200![[thin space (1/6-em)]](https://www.rsc.org/images/entities/char_2009.gif) 000, 300
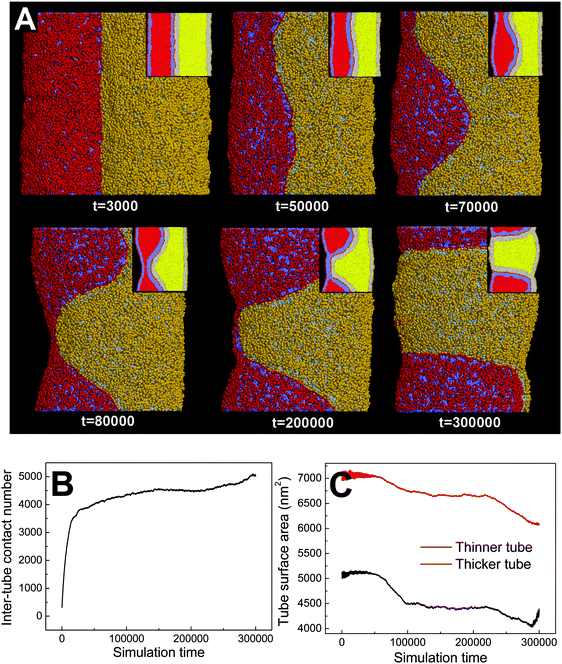
000, 300![[thin space (1/6-em)]](https://www.rsc.org/images/entities/char_2009.gif) 000). Comparatively, pearling of the thicker tube lags behind and no pearling division is observed during the simulation. The asynchronous pearling is well reflected by evolution of the tube surface area (Fig. 8C). In the partial pearling stage, the thinner tube surface area has a more striking decrease than that of the thicker tube (t < 100
000). Comparatively, pearling of the thicker tube lags behind and no pearling division is observed during the simulation. The asynchronous pearling is well reflected by evolution of the tube surface area (Fig. 8C). In the partial pearling stage, the thinner tube surface area has a more striking decrease than that of the thicker tube (t < 100![[thin space (1/6-em)]](https://www.rsc.org/images/entities/char_2009.gif) 000). In the late pearling stage, the thinner tube area undergoes a sudden increase reflecting the tube pearling division, which is however not found for the thicker tube (t > 280
000). In the late pearling stage, the thinner tube area undergoes a sudden increase reflecting the tube pearling division, which is however not found for the thicker tube (t > 280![[thin space (1/6-em)]](https://www.rsc.org/images/entities/char_2009.gif) 000).
000).
Dynamically, the pearling of each tube is accomplished via local tube shrinkage, which further transits to a cylindrical micelle and completes the pearling. We have shown that the pearling of two adhering tubes is complementary with each other. Therefore, a lower pearling efficiency for the thicker tube is because it takes more time to accomplish the local tube shrinkage. Energetically, the different pearling efficiency is being membrane bending energy dominated. In fact, the effect of diameter on pearling for single tubes has been theoretically analyzed by Bar-Ziv and Moses.24 Their energetic analysis illustrated that for thinner tubes the transition from the cylinder to finite amplitude peristaltic state is well balanced by the membrane bending energy. Here, we approximately treat each pearled tube as a number of vesicles which are connected by cylindrical micelles. Therefore, the membrane bending energy for each pearled tube can be approximated to a constant. Comparatively, the membrane bending energy for a tube is strongly affected by the tube diameter, i.e. Eb ∼ kπh/R, where k, h, and R represent the membrane bending modulus, the tube length and the tube radius, respectively. Therefore, when two tubes with different diameters adhere to each other, the stability of the thinner tube is first lost and pearling simultaneously takes place.
3.3 Pearling of two perpendicular tubes
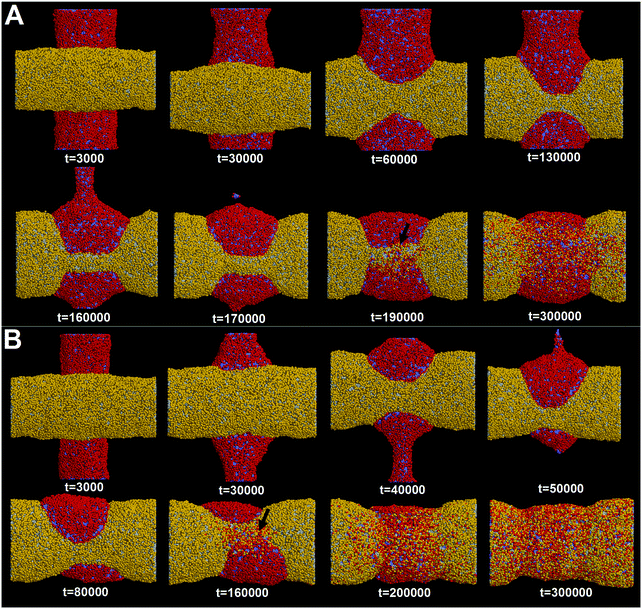
It should be noted that in reality multiple membrane tubes adjacent to each other generally have different orientations. Therefore, understanding how pearling takes place for two crossed tubes is equally important. Here, we construct two perpendicular membrane tubes with diameters D1 = D2 = 28 nm. The interaction parameter is set to aH1H2 = 8. Before our simulations, it was anticipated that the pearling for two perpendicular tubes may be less efficient than that of two parallel tubes. Our anticipation is based on the fact that the two perpendicular tubes have a much smaller initial inter-tube contact area.However, our simulation shows that the pearling of two perpendicular tubes is not limited but with a higher efficiency (Fig. 9A). In fact, the increase of the inter-tube adhesion area is accomplished via tube deformation along the axial direction, which is more energetically favorable than that along the radial direction for two parallel tubes (Fig. 3). After thorough pearling completes, the pearling division of one tube is first finished via fission of the cylindrical micelle (Fig. 9A, t = 170![[thin space (1/6-em)]](https://www.rsc.org/images/entities/char_2009.gif) 000), while the other tube is relatively stable until the pearling division is later initiated (t = 190
000), while the other tube is relatively stable until the pearling division is later initiated (t = 190![[thin space (1/6-em)]](https://www.rsc.org/images/entities/char_2009.gif) 000). Besides, the pearling division of the horizontal tube is accomplished via membrane fusion, similar to that of two parallel tubes.
000). Besides, the pearling division of the horizontal tube is accomplished via membrane fusion, similar to that of two parallel tubes.
Next, we fix the diameter of one tube to 28 nm and decrease that of the other tube to 20 nm. It is surprising that decreasing one tube diameter facilitates pearling of both tubes (Fig. 9B). Specifically, pearling division of the thinner tube is first accomplished via micelle fission at about t = 50![[thin space (1/6-em)]](https://www.rsc.org/images/entities/char_2009.gif) 000. For the thicker tube, the pearling division is mediated by the inter-tube membrane fusion at about t = 160
000. For the thicker tube, the pearling division is mediated by the inter-tube membrane fusion at about t = 160![[thin space (1/6-em)]](https://www.rsc.org/images/entities/char_2009.gif) 000. Both completion time is apparently shorter than that of two perpendicular tubes with diameters D1 = D2 = 28 nm (Fig. 9A). Moreover, the asynchronous pearling for two perpendicular tubes further suggests that the pearling division via micelle fission is more efficient than that via inter-tube membrane fusion.
000. Both completion time is apparently shorter than that of two perpendicular tubes with diameters D1 = D2 = 28 nm (Fig. 9A). Moreover, the asynchronous pearling for two perpendicular tubes further suggests that the pearling division via micelle fission is more efficient than that via inter-tube membrane fusion.
3.4 Size effect analysis
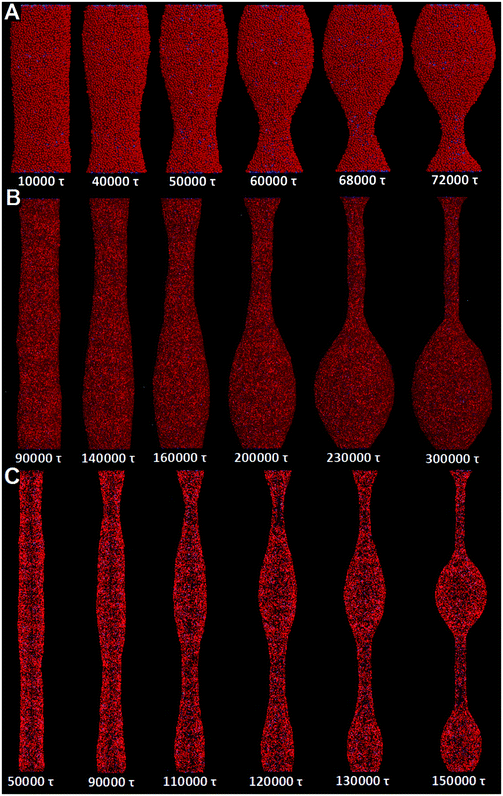
It is worth noting that the size effect is considerable in our simulations. Specifically, the tube length is 75 nm, while only a single wavelength of tube pearling fits in the simulation box. Therefore, our findings may somewhat be affected by the relatively short tube length. To reduce the size effect, we next adopt the implicit solvent DPD method to simulate the pearling of much longer membrane tubes. The detailed introduction of the solvent free DPD method is given in Section 2.3.For comparison, we first simulate the pearling of a single short membrane tube (L = 75 nm, D = 28 nm). As we gradually increase the number of “cargo” beads inside the tube, the stability is lost when the inner “cargo” number is larger than 2000. This is qualitatively consistent with our previous simulation work, in which the tube pearling can be induced by simply increasing the inner water pressure.34 According to the snapshots, only a single pearling wavelength is observed in the simulation box (Fig. 10A). We ascribe the single short pearling wavelength to the relatively short tube length as well as the periodic boundary condition. To reduce the size effect, we next fix the tube diameter and increase the tube length. For L = 250 nm, the pearling wavelength is apparently increased, although still only one tube wavelength fits in the simulation box (Fig. 10B). As we further increase the tube length to 500 nm, the tube finally transits to two separate vesicles (Fig. 10C). It is thus evident that the tube pearling with a single wavelength is ascribed to the size effect, which can be reduced by increasing the tube length.
Next, we try to simulate the pearling of two long adhering membrane tubes. The length and the inner “cargo” number for each tube are fixed to 500 nm and 3000, respectively. Under the same conditions, one separate tube is quite stable during a long simulation time. For two adhering tubes, surprisingly, the inter-tube adhesion does not induce pearling in the solvent free simulations (Fig. S7, ESI†). Comparing with that obtained by explicit solvent DPD simulations, the tube volume is not maintained during the solvent free DPD simulation. In more detail, each tube undergoes more striking shrinkage to increase the inter-tube adhesion area. The decreased tube volume reduces the tension increase, which is thus not capable of balancing the membrane bending energy and leads to tube pearling.
4 Conclusions
In summary, we have applied the DPD simulation method to systematically investigate the interaction between two adhering membrane tubes. We found that the inter-tube adhesion can increase the membrane tension, which balances the membrane curvature, and thus leads to tube pearling. By varying the inter-tube adhesion strength, three different pearling instabilities are observed. They are no pearling, thorough pearling and pearling division. Besides, the final pearling instability is affected by tube diameter and inter-tube orientation. Specifically, decreasing the tube diameter has two restraining effects on the pearling transition. One is the restrained tube deformation, and the other is the early stage inter-tube lipid diffusion. For two parallel tubes with different diameters, the pearling is asynchronous. For two perpendicular tubes, surprisingly, the pearling can also take place but with a different pathway and higher efficiency compared with that of two parallel tubes. The finite size effect can be reduced by increasing the tube length. Finally, our simulation observations are well supported by a simple energetic analysis.We expect that our simulations have implications for both bio-distribution and bio-function of membrane tubes. For example, it has been known that membrane tubes play a role in membrane trafficking by destabilization or scissioning to vesicles. Our simulations thus suggest that strong inter-tube adhesion can promote the transformation from tubes into vesicles and thus facilitate the trafficking process. We should point out that in reality multiple membrane tubes meeting with each other usually have different sizes, orientations and surface properties. Therefore, the pearling process of multiple membrane tubes should be much more complex. We hope that further experiments can be inspired by our simulations to further elucidate the pearling mechanism of multiple adhering membrane tubes. This will be of quite importance to both understand the biological function of membrane tubes and develop new biomaterials for applications in the field of nanomedicine.
Acknowledgements
This work was financially supported by the National Natural Science Foundation of China (No. 21303269 and 21273287) and the Natural Science Foundation for Distinguished Young Scholar of Shandong Province (No. JQ201008). T. YUE is grateful for the support of Natural Science Foundation of Shandong Province (ZR2013BQ029) and the Qingdao Science and Technology Project (No. 13-1-4-235-jch). The authors thank the National Supercomputing Center in Shenzhen for providing excellent computer time.References
- B. Alberts, A. Johnson, J. Lewis, M. Raff, K. Roberts and P. Walter, Molecular Biology of the Cell, Garland Science, New York, 5th edn, 2007 Search PubMed.
- A. Rustom, R. Saffrich, I. Markovic, P. Walther and H. Gerdes, Science, 2004, 303, 1007–1010 CrossRef CAS PubMed.
- S. C. Watkins and R. D. Salter, Immunity, 2005, 23, 309–318 CrossRef CAS PubMed.
- J. Hurtig, D. T. Chiu and B. Önfelt, WIREs Nanomed. Nanobiotechnol., 2010, 2, 260–276 CrossRef CAS PubMed.
- J. White, L. Johannes, F. Mallard, A. Girod, S. Grill, S. Reinsch, P. Keller, B. Tzschaschel, A. Echard, B. Goud and E. H. K. Stelzer, J. Cell Biol., 1999, 147, 743–760 CrossRef CAS PubMed.
- D. M. Davis and S. Sowinski, Nat. Rev. Mol. Cell Biol., 2008, 9, 431–436 CrossRef CAS PubMed.
- C. Leduc, O. Campàs, K. B. Zeldovich, A. Roux, P. Jolimaitre, L. Bourel-Bonnet, B. Goud, J. Joanny, P. Bassereau and J. Prost, Proc. Natl. Acad. Sci. U. S. A., 2004, 101, 17096–17101 CrossRef CAS PubMed.
- J. Zimmerberg and M. M. Kozlov, Nat. Rev. Mol. Cell Biol., 2006, 7, 9–19 CrossRef CAS PubMed.
- B. G. Hosu, M. Sun, F. Marga, M. Grandbois and G. Forgacs, Phys. Biol., 2007, 4, 67–78 CrossRef CAS PubMed.
- V. Heinrich and R. E. Waugh, Ann. Biomed. Eng., 1996, 24, 595–605 CrossRef CAS PubMed.
- D. Raucher and M. P. Sheetz, Biophys. J., 1999, 77, 1992–2002 CrossRef CAS PubMed.
- Z. Li, B. Anvari, M. Takashima, P. Brecht, J. H. Torres and W. E. Brownell, Biophys. J., 2002, 82, 1386–1395 CrossRef CAS PubMed.
- A. Upadhyaya and M. P. Sheetz, Biophys. J., 2004, 86, 2923–2928 CrossRef CAS PubMed.
- D. K. Fygenson, J. F. Marko and A. Libchaber, Phys. Rev. Lett., 1997, 79, 4497–4500 CrossRef CAS.
- G. Koster, M. VanDuijn, B. Hofs and M. Dogterom, Proc. Natl. Acad. Sci. U. S. A., 2003, 100, 15583–15588 CrossRef CAS PubMed.
- E. Evans, H. Bowman, A. Leung, D. Needham and D. Tirrell, Science, 1996, 273, 933–935 CAS.
- J. Y. Shao and R. M. Hochmuth, Biophys. J., 1996, 71, 2892–2901 CrossRef CAS PubMed.
- R. E. Waugh, Biophys. J., 1982, 38, 29–37 CrossRef CAS PubMed.
- N. Ramakrishnan, P. B. S. Kumar and J. H. Ipsen, Biophys. J., 2013, 104, 1018–1028 CrossRef CAS PubMed.
- A. arić and A. Cacciuto, Phys. Rev. Lett., 2012, 109, 188101 CrossRef PubMed.
- A. H. Bahrami, R. Lipowsky and T. R. Weikl, Phys. Rev. Lett., 2012, 109, 188102 CrossRef PubMed.
- S. Baoukina, S. J. Marrink and D. P. Tieleman, Biophys. J., 2012, 102, 1866–1871 CrossRef CAS PubMed.
- G. Koster, A. Cacciuto, I. Derényi, D. Frenkel and M. Dogterom, Phys. Rev. Lett., 2005, 94, 068101 CrossRef PubMed.
- R. Bar-Ziv and E. Moses, Phys. Rev. Lett., 1994, 73, 1392–1395 CrossRef PubMed.
- C. Ménager, M. Meyer, V. Cabuil, A. Cebers, J.-C. Bacri and R. Perzynski, Eur. Phys. J. E: Soft Matter Biol. Phys., 2002, 7, 325–337 Search PubMed.
- K. P. Sinha, S. Gadkari and R. M. Thaokar, Soft Matter, 2013, 9, 7274–7293 RSC.
- P. A. Pullarkat, P. Dommersnes, P. Fernández, J. Joanny and A. Ott, Phys. Rev. Lett., 2006, 96, 048104 CrossRef PubMed.
- J. Sanborn, K. Oglecka, R. S. Kraut and A. N. Parikh, Faraday Discuss., 2013, 161, 167–176 RSC.
- S. Chaïeb and S. Rica, Phys. Rev. E: Stat. Phys., Plasmas, Fluids, Relat. Interdiscip. Top., 1998, 58, 7733–7737 CrossRef.
- F. Campelo and A. Hernández-Machado, Phys. Rev. Lett., 2007, 99, 088101 CrossRef CAS PubMed.
- I. Tsafrir, D. Sagi, T. Arzi, M. Guedeau-Boudeville, V. Frette, D. Kandel and J. Stavants, Phys. Rev. Lett., 2001, 86, 1138–1141 CrossRef CAS PubMed.
- I. Tsafrir, Y. Caspi, M. Guedeau-Boudeville, T. Arzi and J. Stavants, Phys. Rev. Lett., 2003, 91, 138102 CrossRef PubMed.
- Y. Yu and S. Granick, J. Am. Chem. Soc., 2009, 131, 14158–14159 CrossRef CAS PubMed.
- T. Yue, X. Zhang and F. Huang, Phys. Chem. Chem. Phys., 2014, 16, 10799–10809 RSC.
- C. Lee and L. B. Chen, Cell, 1988, 54, 37–46 CrossRef CAS PubMed.
- N. B. Cole and J. Lippincott-Schwartz, Curr. Opin. Cell Biol., 1995, 7, 55–64 CrossRef CAS PubMed.
- H.-H. Gerdes, N. V. Bukoreshtliev and J. F. V. Barroso, FEBS Lett., 2007, 581, 2194–2201 CrossRef CAS PubMed.
- H.-H. Gerdes and R. Pepperkok, Cell Tissue Res., 2013, 352, 1–3 CrossRef PubMed.
- D. M. Davis and S. Sowinski, Nat. Rev. Mol. Cell Biol., 2008, 9, 431–436 CrossRef CAS PubMed.
- E. Hatta, Langmuir, 2011, 27, 10400–10406 CrossRef CAS PubMed.
- I. Derenyi, F. Julicher and J. Prost, Phys. Rev. Lett., 2002, 88, 238101 CrossRef PubMed.
- T. Lobovkina, P. Dommersnes, J. Joanny, J. Hurtig and O. Orwar, Phys. Rev. Lett., 2006, 97, 188105 CrossRef PubMed.
- M. Laradji and P. B. S. Kumar, Phys. Rev. Lett., 2004, 93, 198105 CrossRef PubMed.
- P. J. Hoogerbrugge and J. M. V. A. Koelman, Europhys. Lett., 1992, 19, 155–160 CrossRef.
- P. Español and P. Warren, Europhys. Lett., 1995, 30, 191–196 CrossRef.
- R. D. Groot and P. B. Warren, J. Chem. Phys., 1997, 107, 4423–4435 CrossRef CAS.
- X. Chen, F. Tian, X. Zhang and W. Wang, Soft Matter, 2013, 9, 7592–7600 RSC.
- J. C. Shillcock and R. Lipowsky, Nat. Mater., 2005, 4, 225–228 CrossRef CAS PubMed.
- T. Yue S. Li, X. Zhang and W. Wang, Soft Matter, 2010, 6, 6109–6118 RSC.
- T. Yue and X. Zhang, Soft Matter, 2013, 9, 559–569 RSC.
- T. Yue, X. Zhang and F. Huang, Soft Matter, 2014, 10, 2024–2034 RSC.
- K. Yang, B. Yuan and Y. Ma, Nanoscale, 2013, 5, 7988–8006 Search PubMed.
- H.-M. Ding and Y.-Q. Ma, Biomaterials, 2014, 35, 8703–8710 CrossRef CAS PubMed.
- N. Arai, K. Yasuoka and X. C. Zeng, Nanoscale, 2013, 5, 9089–9100 RSC.
- Y. Li, X. Li, Z. Li and H. Gao, Nanoscale, 2012, 4, 3768–3775 RSC.
- R. Guo, J. Mao and L.-T. Yan, ACS Nano, 2013, 7, 10646–10653 CrossRef CAS PubMed.
- R. Guo, J. Mao and L.-T. Yan, Biomaterials, 2013, 34, 4296–4301 CrossRef CAS PubMed.
- I. R. Cooke, K. Kremer and M. Deserno, Phys. Rev. E: Stat., Nonlinear, Soft Matter Phys., 2005, 72, 011506 CrossRef PubMed.
- Z.-J. Wang and M. Deserno, J. Phys. Chem. B, 2010, 114, 11207–11220 CrossRef CAS PubMed.
- H. Y. Yuan, C. J. Huang, G. Lykotrafitis, J. Li and S. Zhang, Phys. Rev. E: Stat., Nonlinear, Soft Matter Phys., 2010, 82, 011905 CrossRef PubMed.
- M. Fuhrmans and M. Müller, Langmuir, 2013, 29, 4335–4349 CrossRef CAS PubMed.
- W. A. Talbot, L. X. Zheng and B. R. Lentz, Biochemistry, 1997, 36, 5827–5836 CrossRef CAS PubMed.
- D. Mirjanian, A. N. Dickey, J. H. Hoh, T. B. Woolf and M. J. Stevens, J. Phys. Chem. B, 2010, 114, 11061–11068 CrossRef CAS PubMed.
- R. C. Van Lehn, M. Ricci, P. H. J. Silva, P. Andreozzi, J. Reguera, K. Voïtchovsky, F. Stellacci and A. Alexander-Katz, Nat. Commun., 2014, 5, 4482 CAS.
- S. J. Marrink and A. E. Mark, J. Am. Chem. Soc., 2003, 125, 11144–11145 CrossRef CAS PubMed.
- A. Grafmüller, J. Shillcock and R. Lipowsky, Biophys. J., 2009, 96, 2658–2675 CrossRef PubMed.
Footnote |
| † Electronic supplementary information (ESI) available. See DOI: 10.1039/c5cp04579g |
| This journal is © the Owner Societies 2016 |

