Frozen-density embedding theory with average solvent charge densities from explicit atomistic simulations
Received
22nd January 2016
, Accepted 3rd March 2016
First published on 3rd March 2016
Abstract
Besides molecular electron densities obtained within the Born–Oppenheimer approximation (ρB(r)) to represent the environment, the ensemble averaged density (〈ρB〉(r)) is also admissible in frozen-density embedding theory (FDET) [Wesolowski, Phys. Rev. A, 2008, 77, 11444]. This makes it possible to introduce an approximation in the evaluation of the solvent effect on quantum mechanical observables consisting of replacing the ensemble averaged observable by the observable evaluated at ensemble averaged ρB(r). This approximation is shown to affect negligibly the solvatochromic shift in the absorption of hydrated acetone. The proposed model provides a continuum type of representation of the solvent, which reflects nevertheless its local structure, and it is to be applied as a post-simulation analysis tool in atomistic level simulations.
1 Introduction
Frozen-density embedding theory (FDET) was originally formulated by Wesolowski and Warshel1 to derive self-consistent expressions for the energy and embedding potential as a universal functional of charge densities: the electrons in the environment (ρB(r)), the electron density of the embedded species (ρA(r)), and the nuclei in the environment generating the potential (vB(r)). The FDET approach provides thus an alternative formal framework to the ones used in commonly used QM/MM methods (see classical reviews given in ref. 2–8 or the reviews in volume 115 of Chemical Reviews published in 2015 dedicated entirely to such methods). In QM/MM methods, the embedded wavefunction is obtained using system-specific parameters, whereas the energy and the embedding potential are usually not self-consistent because special terms are a posteriori added. In the original formulation of FDET, a non-interacting reference system was used as a quantum descriptor of the embedded species. Generalizations of FDET to interacting systems have been formulated: for either a multi-determinant reference state9 or a one-particle spin-less reduced density matrix used as a quantum mechanical descriptor of the embedded species.10 In the present work, a non-interacting reference system case is considered. The focus is, however, on the treatment of ρB(r) in FDET if the structure of the environment fluctuates. The key feature of the FDET embedding potential is the fact that it is a functional determined uniquely by ρB(r), vB(r), and ρA(r):| |  | (1) |
for the definition of the functional Enadxct[ρA,ρB] see the original publications on FDET,1,9 whereas the approximations used in the present work are given in the corresponding sections of the present work. For the sake of discussion in the present work we will refer to the first two terms in the right-hand-side of eqn (1) as electrostatic components of the embedding potential (velectrB(r)).
Usually, the two input quantities ρB(r) and vB(r) needed to evaluate the embedding potential vemb[ρA,ρB,vB](r) are obtained from some approximate method to solve the many-electron problem within the Born–Oppenheimer approximation. Such use of the FDET framework could be called “conventional” as it has been used by many researchers (see our recent review11 or relevant parts of reviews by others,12–15 for instance). Other authors developed computational methods sharing some elements with FDET.16–18 One of possible applications of the FDET type of multi-scale method is modeling solvatochromism. In this case, the computational advantages of “conventional” applications originate from the fact that, as in any QM/MM type of modeling, the number of electrons treated explicitly is reduced compared to the full quantum mechanical treatment of the whole system. It is especially important because the embedded wavefunction must be evaluated for many configurations of the environment representing the statistical ensemble. Recently, we proposed an alternative strategy to deal with the solvent effect which concerns the choice made for the input quantities in FDET which are used as the descriptors of the environment: ρB(r) and vB(r).19 Instead of averaging excitation energies obtained in an ensemble of configurations, the excitation energy is evaluated only once but using the FDET embedding potential corresponding to ensemble averaged charge densities: 〈ρB〉(r) and 〈vB〉(r). Such a strategy hinges, however, on the method to evaluate the average charge densities. In the original work19 and in the subsequent publications,20,21 the site-probabilities, i.e., local concentrations of each type of atom of the solvent, dressed up with electrons were used. The site-probabilities were obtained by solving the classical-statistical model of the liquid: 3D-RISM.22 In the present work, a refined model is proposed in which the average charge densities are also generated from site probabilities but the latter are obtained from explicit molecular dynamics simulations at the atomistic level. We aim at the robust computational protocol to evaluate the solvent effect on a specific observable which could be used as a post-simulation analysis of the sample of instantaneous configurations representing the solvent and the solvated species at statistical equilibrium. Such an approach corresponds to the following approximation:
| | | 〈ΔÔ[ρB]〉ensemble ≈ ΔÔ[〈ρB〉ensemble], | (2) |
where
Ô represents the operator in question. The significance of the approximation given in
eqn (2) is analyzed in the present work using the solvatchromism of acetone in water as a study case. The numerical set-up of the present work is such that it addresses only the approximation given in
eqn (2) and not other approximations affecting the calculated excitation energies.
2 FDET based non-uniform continuum model of the solvent
2.1 Frozen-density embedding theory
Frozen-density embedding theory concerns the following constrained search problem in which the number of electrons NAB, the external potential vAB(r), and some non-negative function ρB(r) are given quantities:| |  | (3) |
If the trial densities in the above search ρ(r) are represented as:| |  | (4) |
where ΨA has the form of a NA-electron function, the condition ∀ rρ(r) ≥ ρB(r) is automatically satisfied.
Expressing the total energy as a functional EEWFAB[ΨA,ρB], which depends explicitly on ΨA and ρB(r), makes it possible to use the Euler–Lagrange equation in order to find stationary many-electron wave functions:
| |  | (5) |
where
λI is the Lagrange multiplier associated with the normalization. The index I indicates that the present work concerns not only in the lowest-energy solution but also other stationary states.
The total energy functional denoted as EEWFAB[ΨA,ρB] reads:
| |  | (6) |
where the functional
Enadxct[
ρA,
ρB] comprises three components:
| | | Enadxct[ρA,ρB] = Tnads[ρA,ρB] + Enadxc[ρA,ρB] + ΔFSC[ρA]. | (7) |
The non-additive bi-functionals
Tnads[
ρA,
ρB] and
Enadxc[
ρA,
ρB], and the functional Δ
FSC[
ρA] are defined by means of the constrained search procedure (see
ref. 9).
The necessary condition for ΨIA to satisfy eqn (5) takes the form resembling the conventional Schrödinger equation for many-electrons:
| | (ĤA + ![[v with combining circumflex]](https://www.rsc.org/images/entities/i_char_0076_0302.gif) emb)ΨIA = εIΨIA, emb)ΨIA = εIΨIA, | (8) |
where
![[v with combining circumflex]](https://www.rsc.org/images/entities/i_char_0076_0302.gif) emb
emb denotes the “embedding operator” given in the form of the potential which in turn is uniquely determined by the charge densities
ρA(
r) and
ρB(
r) and the fixed potential
vB(
r). The functional for this potential is obtained as the functional derivative of the corresponding terms in the total energy functional (
eqn (6)) and it is given in
eqn (1).
The FDET embedding potential comprises the classical electrostatic components (velectrB(r)) and the terms which are defined as the functional derivatives of the density functionals: Tnads[ρA,ρB], Enadxc[ρA,ρB], and ΔFSC[ρA]. The latter are, therefore, also the functionals of ρA and ρB, whereas velectrB(r) (the sum of the first two terms in the RHS of eqn (1)) does not depend on ρA(r) at all.
Concerning the functional ΔFSC(WFT)[ρ], its definition depends on what is used as ĤA and on the search domain. It is neglected in practical applications of FDET based simulations. Moreover, in the case of using a non-interacting reference system for embedded species, as in the present work, it does not contribute to the embedding potential at all.
In multi-scale simulation methods based on FDET, the exact density functionals in eqn (7), Tnads[ρA,ρB], Enadxc[ρA,ρB], and ΔFSC(WFT)[ρA], are replaced by their approximate counterparts: ![[T with combining tilde]](https://www.rsc.org/images/entities/i_char_0054_0303.gif) nads[ρA,ρB], Ẽnadxc[ρA,ρB], and Δ
nads[ρA,ρB], Ẽnadxc[ρA,ρB], and Δ![[F with combining tilde]](https://www.rsc.org/images/entities/i_char_0046_0303.gif) SC(WFT)[ρA].
SC(WFT)[ρA].
2.1.1 Local excitations in embedded species from LR-TDDFT.
FDET can be used to obtain excitation energies either as other-then-ground state stationary solutions of the Euler–Lagrange equation for the embedded wavefunction (see eqn (8)) or through the Linear-Response Time-Dependent DFT (LR-TDDFT) approach23 if the embedded species is described by means of a non-interacting reference system.24 In the present work, the second strategy is used. The fact that the embedding potential depends on ρA(r) results in an additional contribution (femb[ρA,ρB](r,r′)) to the response kernel for the isolated species (fA[ρA](r,r′)). This kernel can be conveniently represented as:| | | fA(emb)[ρA,ρB](r,r′) = fA[ρA](r,r′) + femb[ρA,ρB](r,r′), | (9) |
where the contribution to the kernel due to the embedding potential reads:24| |  | (10) |
Note that the electrostatic components of the FDET embedding potential do not contribute to femb[ρA,ρB](r,r′) because they do not depend on ρA(r).
The above combination of FDET embedding potential with the LR-TDDFT approach to the excitation energy represents a physical approximation consisting of neglecting frequency-dependent response of the environment to the oscillating electric field. For that reason we refer to it as Neglect of Dynamic Response of the Environment (NDRE). Extension going beyond NDRE was formulated by Casida and Wesolowski.25 Neugebauer developed a formalism based on this extension treating efficiently the case of chromophores absorbing at similar wavelengths which are localized in different subsystems.17
2.1.2 Average 〈ρB〉(r) from statistical ensembles for structurally flexible environments.
So far ρB(r) was assumed to have a quantum-mechanical origin and was associated with some molecular system at a given geometry. The FDET formal framework admits also wider choices for ρB(r) such as the ensemble averaged ρB(r). One can rewrite the FDET equations replacing ρB(r) by the statistical ensemble averaged electron density, which is denoted with 〈ρB〉(r) throughout this work and with 〈vB〉(r) being the ensemble averaged potential generated by the nuclei in the environment. The advantage of such an approach is that while a straightforward calculation of the statistically averaged property 〈O[ρB]〉 (left-hand-side of eqn (2)) requires M calculations of Oi[ρB] for every configuration i = 1…M in the ensemble, the use of the averaged density enables finding 〈O[ρB]〉 in one step (the right-hand-side of eqn (2)).
In the work of Kaminski et al.19 〈ρB〉(r) was obtained by means of solving the 3D-RISM equations to obtain the 3D solute-solvent site distribution function gγ(r) for each solvent site γ. In the next step, each site probability gγ(r) was dressed up with spherically averaged atomic densities ργ(r − r′). Specifically, the contribution of each atom is obtained subsequently as the convolution of the site probability with a simple (spherically symmetric) model of electron density of the atom ργ(r − r′), where qγ is the number of electrons associated with each solvent site γ.
| |  | (11) |
In the method proposed in ref. 19, 〈ρB〉(r) obtained from the above procedure is used to evaluate the FDET embedding potential and subsequently the embedded wavefunction and its response needed for LR-TDDFT evaluation of the excitation energy. The solvatochromic shifts were obtained from eqn (2) which takes the following form:
Despite several successful applications, the method proposed by Kaminski
et al. is not free from drawbacks. In particular, the 3D-RISM method is known to suffer from the numerical instability problem, arising from the non-unique partitioning of the charge density among atoms. Additionally, the difference between the shift obtained in the LHS and the RHS of
eqn (12) cannot be attributed only to moving the averaging from shifts to densities but also to the closure used in 3D-RISM which represents an additional approximation.
The purpose of our study was to develop a new method to generate 〈ρB〉(r) based not on solving 3D-RISM equations but using explicit numerical simulations at the atomistic level such as classical Molecular Dynamics (MD) simulations.
The procedure to generate 〈ρB〉MD(r) corresponding to the ensemble of instantaneous geometries considered in the previous section consists of the following steps: (a) generation of the solvent–solute distribution function i.e. the map in 3D of concentrations of each type of the atom of the solvent and (b) dressing up with electrons the concentrations obtained in the previous step. Compared to ref. 19 the procedure used in the previous work differs in the first step. The solvatchromic shift is evaluated also using the approximation given in eqn (12).
The nuclear part of the FDET embedding potential depends on neither ρB(r) nor ρA(r) and averaging is straightforward. The steps needed for the evaluation of the above averaged quantities are described in detail in the subsequent sections.
2.1.3 Generation of a 3D solute–solvent distribution function from the MD trajectory.
In the first step, a 3D solute–solvent distribution function gk(r), which gives the number of particles of the given atom type k of solvent in the given volume element d3r, is computed using the ensemble of coordinates of solvent molecules {RBj} produced by the MD simulation. For the MD trajectory with M configurations the first geometry of the solute RA1 is considered to be a reference whose geometrical center is located at the point  where P is the number of atoms of solute, ri is a coordinate vector of the solute atom i. Following the algorithm of Kabsch et al.,26,27 for every geometry RAj, j = 2…M we compute a translation vector Tj = Oj − O1 and a rotation matrix Uj and apply the obtained transformation to the geometry RAj
| | ![[R with combining tilde]](https://www.rsc.org/images/entities/b_char_0052_0303.gif) Aj = Uj(RAj − Tj), j = 2…M Aj = Uj(RAj − Tj), j = 2…M | (13) |
to get a new set of transformed geometries {![[R with combining tilde]](https://www.rsc.org/images/entities/b_char_0052_0303.gif) Aj} which minimizes the Root-Mean-Square-Deviation (RMSD) of atomic positions computed for the geometries RA1 and RAj as follows:
Aj} which minimizes the Root-Mean-Square-Deviation (RMSD) of atomic positions computed for the geometries RA1 and RAj as follows:| |  | (14) |
| |  | (15) |
As a result the set of matrices Uj and translation vectors Tj contains all information about the translational, vibrational and rotational degrees of freedom of the solute molecule surrounded with solvent.
In the subsequent step, the set of coordinates of the nuclei of solvent {RBj} is averaged over the ensemble of M configurations. To do that, the rotation Uj and translation Tj transformations are applied to the ensemble of solvent geometries {RBj} to yield a new set of geometries {![[R with combining tilde]](https://www.rsc.org/images/entities/b_char_0052_0303.gif) Bj}
Bj}
| | ![[R with combining tilde]](https://www.rsc.org/images/entities/b_char_0052_0303.gif) Bj = Uj(RBj − Tj), j = 2…M Bj = Uj(RBj − Tj), j = 2…M | (16) |
With the two sets of coordinates {
![[R with combining tilde]](https://www.rsc.org/images/entities/b_char_0052_0303.gif) Aj
Aj} and {
![[R with combining tilde]](https://www.rsc.org/images/entities/b_char_0052_0303.gif) Bj
Bj} sharing the same origin located at the point
O1, one can finally determine the 3D solvent distribution function
gk(
r). For that purpose the whole volume
V occupied by the system is divided into small boxes

and the number
nα,k of occurrences of the given atom type
k into each elementary volume
vα is computed. A uniform set of cubic elementary volumes
vα of (0.3)
3 size each was used to construct the 3D solvent distribution function
gk(
r). Consequently, the 3D solvent distribution function
gk(
α) for the given atom type
k in the box
α reads:
| |  | (17) |
where
k is an atom type of solvent,
α is the index that runs over every elementary volume
vα and
N is the total number of nuclei.
2.1.4 Dressing up with electrons the 3D solvent distribution functions to obtain 〈ρB〉(r).
To begin with, we first assume that each solvent site γ located at r′ is surrounded by an effective spherically averaged electronic density cloud ργ(r − r′) moving together with that nucleus, the general formula for the statistical ensemble averaged electron density 〈ρB〉(r) takes on the following form:| |  | (18) |
Another approximation is that the whole electronic density is concentrated in the same point r′ as that of the nucleus with the total integrated charge being equal to the number of electrons qγ associated with each site γ.| | | ργ(r − r′) = qγδ(r − r′) | (19) |
that results in the following expression for statistical ensemble averaged density| |  | (20) |
where qγ is the number of electrons associated with each site γ. The assumption 19 is valid when the ργ(r − r′) is a short-range function confined in the elementary volume vα that enables us to replace the integral over the space coordinates by the sum over the elementary volumes α so that 20 can be rewritten as follows| |  | (21) |
where qk is the number of electrons associated with each type of atoms of solvent k and gk(α) is the 3D solvent distribution function giving the average number of atoms of the type k in the elementary volume vα.
2.1.5 Generation of the electrostatic part of the embedding potential.
Once the ensemble averaged density 〈ρB〉(r) is determined, the ensemble averaged electrostatic potential of the environment is computed as| |  | (22) |
where rα′ denotes a center of the volume vα, qk is the number of electrons associated with each type of atom of solvent k, Zk is a nuclear charge of the atom type k and gk(α) is a 3D solvent distribution function. It is worthwhile to recall that a similar approximation was introduced in ref. 28 where the averaged electrostatic potential was used. Compared to the method used in the present work, we average not the potential but the charge-densities. Averaging potential is equivalent to averaging the charge density only in the case of embedding potentials which are order-one homogeneous in ρB(r) such as the electrostatic potential averaged in ref. 28. The FDET embedding potential (either exact or approximated) is, however, not order-one homogeneous in ρB(r) because it contains the non-electrostatic component (the last term in eqn (1)).
2.2 Computational details
In order to validate the approximation given in eqn (2), either the left-hand-side or the right-hand-side of eqn (2) was evaluated using the method introduced in ref. 24 which uses the FDET embedding potential in the general framework of the LR-TDDFT approach to the excited states.23 The solvatochromic shift for the lowest n → π* transition in an acetone molecule was calculated as the difference of the respective excitation energies in gas and in the solvent Δε = εH2O − εgas. Subjected to the extensive theoretical29,30 and experimental study,31–34 acetone is a very convenient model system to test novel computational approaches for prediction of solvatochromic shifts. To evaluate either sides of eqn (12), the M = 121 instantaneous geometries taken from the QM/MM MD simulation by Adias et al.35 were used. The simulation reported in ref. 35 was performed at 298.15 K for the fixed geometry acetone molecule embedded in 511 explicit water molecules. The acetone molecule was treated at the QM level, while the rest of the system was treated classically. The used instantaneous geometries correspond to a 10 ps long equilibrated trajectory. The excitation energies were evaluated using the ADF code36 featuring the implementation of LR-TDDFT FDET equations by Wesolowski24 subsequently improved by Jacob et al.37 The Slater Type AUG-TZP basis sets were used. The Statistical Averaged Orbital Potential (SAOP) approximation for the exchange–correlation potential in ĤAo was used in calculations for both isolated and embedded chromophores, the local-density approximation was used for both Tnads[ρA,ρB] and Enadxc[ρA,ρB]. Note that the same approximations (basis sets and functionals) were used in solving LR-TDDFT FDET equations for evaluating both sides of eqn (12). As a result, any differences between the obtained numerical values could be attributed only to the approximation eqn (12) investigated in this work and not to other factors.
For atomistic simulations (the left-hand-side of eqn (2)) the used computational protocol is essentially the same as the one used in the paper of Neugebauer et al.29 applied also for evaluation of absorption band shapes in ref. 38 and 20. Here we report only its key elements and the details specific for the present calculations. The corresponding absorption spectra were computed for M = 121 conformations sampled during the QM/MM MD simulations using the LR-TDDFT FDET method. To make LR-TDDFT FDET calculations affordable we reduce the number of water solvent atoms by introducing a 8 cut off radius whose origin is situated at the center of mass of the acetone. The selected molecular cluster comprises 68 water molecules contributing to ρB(r). At each instantaneous geometry, ρB(r) is evaluated as a superposition of atomic densities (for the performance of FDET with such construction of ρB(r) see ref. 39):
| |  | (23) |
where
i refers to the atom in embedding subsystem
B,
N is the total number of atoms of the solvent and
ρiB(
r) is the normalized spherically symmetric electron density of the solvent,
ZiB is the total charge equal to the atomic number of the atom
i and
niB is the net charge of the atom
i.
As in ref. 19, the solvent net oxygen and hydrogen charges were taken to be nOB = − 0.80e and nHB = +0.40e respectively. Those charges correspond to the formal ionic charges. The STO-DZP basis sets were used for the calculation of ρB(r). Given the M cluster models, the 8 lowest excitation energies and their corresponding oscillator strengths were computed and averaged over the whole statistical ensemble of M configurations. The number of excitations chosen could be expected to affect the final excitation energies for two reasons. First of all, the n → π* transition is optically forbidden and its small oscillator strength in the solvent is the result of breaking the symmetry in the instantaneous geometry. It is possible therefore that the higher more intense excitations could affect the position of the maximum of the lowest absorption band. In the considered case it is not the case because of the large gap between the two relevant excitation energies. The mean energy of the lowest excitation equals 4.78 eV (the oscillator strength of this transition does not exceed f ≈ 7 × 10⁻⁵). The lowest excitation energy varies between 4.6 eV and 5.0 eV in the considered ensemble. The energy of the second lowest excitation, which has a significantly higher oscillator strength f ≈ 0.01, varies between 6.14 eV and 7.12 eV. The other reason why the number of explicitly considered excitations could affect the calculated solvatochromic shifts is the fact that the quality of higher excitation energies deteriorates due to the wrong asymptotic behavior of the used approximation for the exchange–correlation functional and due to the use of the Davidson diagonalization procedure to solve Casida's equations. The ultimate verification of the importance of the above factors was made by repeating the calculations using different number of excitations (6, 8, or 10). The average excitation energies evaluated for the considered trajectories using any of the chosen number of excitations are practically the same (see Table 1).
Table 1 The ensemble averaged energy of the lowest excitation for the solvated acetone evaluated using different numbers of excitations in solving Casida's equations by means of Davidson's diagonalization procedure
| Number of states |
6 |
8 |
10 |
| Energy, eV |
4.7823043 |
4.7823043 |
4.7823044 |
All the solvatochromic shifts in the n → π* transition reported in the present work use the reference value of 4.606 eV for this excitation. It was evaluated using the same approximations in LR-TDDFT equations as the ones for the embedded species and the same geometry as the one used in the original MD simulations. After that the electronic spectra of acetone in solution were convoluted with Gaussian functions to mimic the broadening of the electronic transitions due to the vibronic degrees of freedom and the thermal fluctuations of the solvent. For a given transition γ of the frequency ωγ the molar extinction coefficient  , which shows the ability of a chemical substance to absorb light at a given wavelength ω, reads (eqn (24)).
| |  | (24) |
In
eqn (24),
M is the number of the solute molecular configurations,
ωiγ and
fiγ are the excitation energy and the corresponding oscillator strength of the transition
γ computed for the molecular configuration
i,
D = 3.4819 × 10
−5 mol cm eV
−1 is a constant and
b is the full width at half maximum (FWHM) chosen to be 0.08 eV. The molar extinction coefficient

computed for the first 8 excited state transitions is given by
eqn (25)| |  | (25) |
For each volume element, ρB(r) was evaluated as a sum of delta-functions eqn (19) and was computed using eqn (21) that reads as 〈ρB〉MD(r) = (−0.6e)gH(r) + (−8.8e)gO(r), where gH(r) and gHO(r) are the 3D distribution functions for the oxygen and hydrogen atoms, qH = −0.6e and qO = −8.8e being the respective effective net charges.
3 Results
3.1 The absorption band shape from atomistic simulations
Fig. 6 shows the absorption band shape obtained using atomistic simulations. The solvatochromic shifts for the lowest n → π* transition in acetone in comparison with available theoretical and experimental data are collected in Table 2. While the atomistic simulations lead to Δε = 0.18 eV, the experimental shift of the maxima of the absorption band is reported to lie between 0.19–0.22 eV.31–34
Table 2 Solvatochromic shifts from the water to gas phase of the lowest n → π* transition (in eV)
| LR-TDDFT/atomistic |
CCSD/MD30 |
Exp.31–34 |
| 0.18 |
0.20 |
0.19–0.22 |
The recent reported theoretical value of Δε = 0.20 eV30 obtained by means of the combined linear response coupled cluster/molecular mechanics agrees also very well with the result of our atomistic simulations which justifies to use the obtained value and the used approximations (for functionals, basis sets, and the construction of ρB(r)) as a reference for analysis of the approximation given in eqn (2).
3.2 Solvatochromic shift from the nonuniform-continuum model: Δε[〈ρB〉MD]
Fig. 1 shows the map of 〈ρB〉(r) featuring a low density region around the solute indicating that the solvent density 〈ρB〉(r) does not penetrate the interior of the acetone molecule. The radius of the cavity surrounding the acetone nuclei is about 1.5–2. A first solvation shell is present and has a pronounced diffuse character.
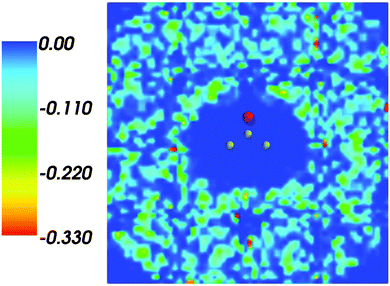 |
| | Fig. 1 Statistical ensemble averaged embedding density 〈ρB〉(r) given in a.u. | |
Fig. 2 shows the map of the net charge. Being the sum of positively charged nuclei and negatively charged electron density distributions the net density takes on both positive and negative values. Similar to the map of 〈ρB〉(r) shown in Fig. 1 and Fig. 2 also features a cavity representing the solute. Two positively charged clouds located in vicinity to the acetone oxygen atom are associated with the protons of molecules of water and indicate the existence of two hydrogen bonds. The statistical ensemble averaged electrostatic potential of the environment velectrB[〈ρB〉] is shown in Fig. 3. The blue region near the negatively charged ion of the oxygen atom of acetone signifies the field generated by positive charges. On the other hand, negative values of the electrostatic potential prevail in the bottom of the picture that signifies the polarization of the solvent. The acetone's oxygen is situated in a region where the magnitude of the electrostatic potential is close to zero.
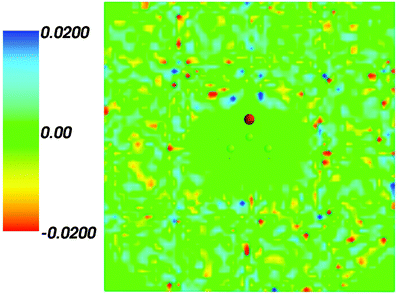 |
| | Fig. 2 Statistical ensemble averaged net density 〈ρNet〉(r) given in a.u. | |
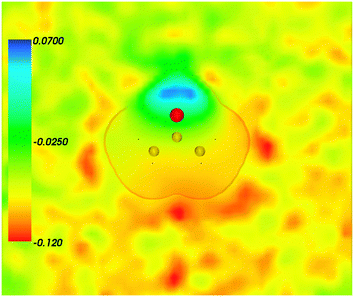 |
| | Fig. 3 Statistical ensemble averaged embedding electrostatic potential of the environment velectrB[〈ρNet〉MD](r) given in a.u. The transparent contour represents the Kohn–Sham electronic density of the acetone with isovalue ρA = 0.001 a.u. | |
Fig. 4 shows the embedding potential vemb(r) generated using the nonuniform-continuum model. To compare the contribution of the non-additive terms Enadxct[ρA,ρB] in eqn (7) and that of the electrostatic term vB[〈ρNet〉MD] to the embedding potential, the map of the embedding potential was plotted on the same scale as the one used for electrostatic potential (Fig. 5). A zero-line passes between the atoms of carbon and oxygen and slightly changes its location upon the addition of the non-additive terms Enadxct[ρA,ρB]. A comparison of Fig. 5 with Fig. 3 shows that a highly attractive embedding potential, which overlaps the electronic density of the solute, appears in the proximity of the oxygen atom of acetone. The magnitude of embedding potential within the cavity comprising the acetone molecule in Fig. 3 remains unchanged as compared to the Fig. 5 due to the absence of the embedding density near the solute.
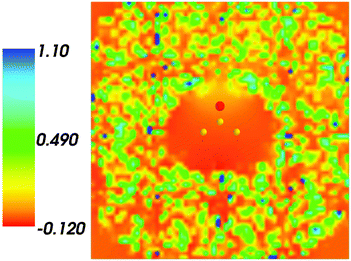 |
| | Fig. 4 The FDET embedding potential (in a.u.) evaluated at average charge densities of the environment for acetone in water. | |
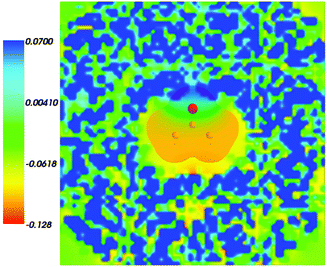 |
| | Fig. 5 The FDET embedding potential (in a.u.) evaluated at average charge densities of the environment for acetone in water together with the isovalue of ρA = 0.001 of ρA(r). | |
The solvatochromic shifts obtained with various methodologies are collected in Table 3.
Table 3 Solvatochromic shifts (in eV) from the water to gas phase for the lowest n → π* transition
| Methodology |
Solvatochromic shift |
|
Present work.
Ref. 19.
|
| FDET/non-uniform continuuma |
0.20 |
| FDET/atomistica |
0.18 |
| FDET/non-uniform continuumb |
0.21 |
| QM/MM30 |
0.20 |
| Exp.31–34 |
0.19–0.22 |
The solvatochromic shift obtained using the non-uniform continuum model and the average charge densities obtained from explicit atomistic simulations (0.20 eV) are in excellent agreement with both of the theoretical (0.20 eV) and the experimental (0.19–0.22 eV) values. It is also close to that obtained using atomistic simulations described in the previous section (0.18 eV) which justifies the applicability of the approximation given in eqn (2). A reduction of the computational expense (one calculation of the excitation energy instead of more than one hundred) is accompanied by the relative change of the calculated shift by only about 10%. Compared to the shifts obtained using an alternative FDET based non-uniform model using 3D-RISM site probabilities to obtain average charge densities, the model presented in this work also leads to a very similar value. The difference between 0.21 eV (3D-RISM) and 0.18 eV (this work) can be attributed to different force field parameters which are used in both methods and to the closure relation needed to solve 3D-RISM equations.
The n → π* excitation involves the HOMO and LUMO orbitals in the transition as shown in Fig. 7 and 8.
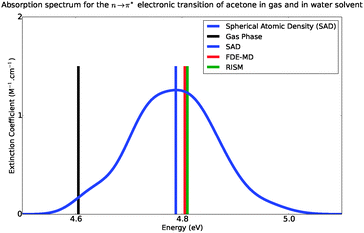 |
| | Fig. 6 Simulated absorption spectra of acetone in water, from 4.4 eV to 5.4 eV. | |
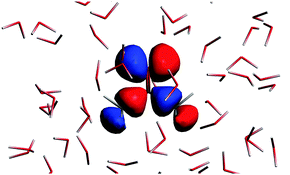 |
| | Fig. 7 The highest occupied molecular orbital for the solvated acetone at one of the conformations of the solvent used for averaging. | |
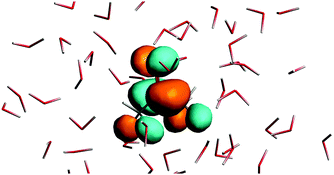 |
| | Fig. 8 The lowest unoccupied orbital for the solvated acetone at one of the conformations of the solvent used for averaging. | |
3.3 Approaching the statistical limit for 〈ρB〉(r)
The quality of the calculated solvatchromic shift in the approach proposed in the present work and discussed in the previous sections depends critically on the representability of the sample of the used configurations. The averaged density considered in the previous section was obtained using a relatively small sample of instantaneous configurations. A straightforward way to approach the statistical limit would consist of using a longer equilibrated MD trajectory. This is not always possible as we propose the current approach as a post-simulation tool to be used independently of the simulations providing the instantaneous configurations. In the present section, we address the issue of representability of the used sample by exploiting two features of the investigated system and FDET: the C2v symmetry of the chromophore, which results in the same symmetry of 〈ρB〉(r) in the statistical limit, and the fact that 〈ρB〉(r) (input quantity in FDET equations) is a real function in 3D which can be a subject of manipulations. We notice that the averaged densities and potentials shown in Fig. 1–4 are not symmetric and look very “grainy”. That indicates that the used sample does not represent the statistical limit. In the following, we estimate the effect of this distortion of the symmetry on the calculated shifts. To this end, the asymmetric density 〈ρB〉(r) can be symmetrized in a straightforward manner:| | | 〈ρsymmB〉(r′) = 〈ρsymmB〉(r′′) = 〈ρsymmB〉(r′′′) = 〈ρsymmB〉(r) | (26) |
where| | | 〈ρsymmB〉(r) = 0.25(〈ρB〉(r) + 〈ρB〉(r′) + 〈ρB〉(r′′) + 〈ρB〉(r′′′)) | (27) |
and where r, r′, r′′, and r′′′, are related by symmetry operations. Compared to their symmetric counterparts the symmetrized charge densities and potentials shown in Fig. 9 and 10, which feature the right symmetry, are smoother because of the smearing out the deviations from the symmetry.
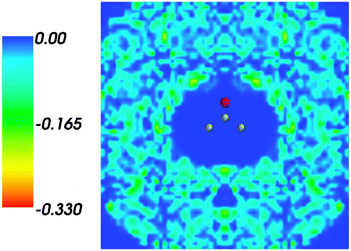 |
| | Fig. 9 Symmetrized statistical ensemble averaged embedding density 〈ρsymmB〉(r) given in a.u. | |
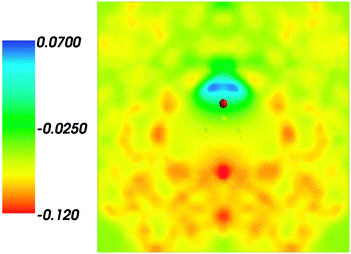 |
| | Fig. 10 Symmetrized statistical ensemble averaged embedding electrostatic potential of the environment velectrB[〈ρsymmNet(r)〉MD](r) given in a.u. | |
The symmetrization affects negligibly the calculated excitation energy (ε[ρsymmB(r)] = 4.8053 eV vs. ε[〈ρB(r)〉] = 4.8048 eV). As expected, the oscillator strength of the considered excitation approaches zero (it is actually f[〈ρsymmB(r)〉] = 0.2836 × 10⁻¹² due to the used numerical procedures) due to the fact that the lowest n → π* state in acetone (1A2 state in the C2v symmetry) is optically forbidden. Interestingly, the oscillatory strength in the asymmetric case although small is non-zero f[〈ρB(r)〉] = 0.3023 × 10⁻⁶.
4 Discussion and conclusions
Replacing the averaging the quantum mechanical observable evaluated in an ensemble of frozen densities (ρB(r)i) by evaluating the observable at the ensemble average of the charge density of the environment (〈ρB〉(r)) is the principal approximation analyzed in this work. This approximation has a compact mathematical form expressed in eqn (2). Physically, it represents replacing the explicit atomistic level of description for the statistical ensemble representing the solvent by two continuous fields: 〈ρB〉(r) and the average potential generated by the nuclei 〈vB〉(r).
In practice, approximation given in eqn (2) leads to huge potential computational savings. With explicit description of the solvent, the evaluation of the observable in question (vertical excitation energy in the present study) must be performed for each configuration representing the statistical ensemble. The use of the continuum fields involves, however, just one evaluation of the quantum mechanical observable. The exact savings depend on the case: costs of generating the statistical ensemble used to generate 〈ρB〉(r), the costs of the evaluation of the FDET embedding potential as a functional of charge densities, for instance. In the present study, the CPU timings needed for right-hand-side and left-hand-side of the eqn (2) differ by almost two orders of magnitude.
The idea of using an average embedding potential is not new, to our knowledge, it was introduced by Coutinho et al.,28 where only the electrostatic component of the embedding potential was considered. The present work concerns the complete local embedding potential, which includes also the non-electrostatic term, which as shown in ref. 1 and 9 has the form of a universal functional of charge-densities. Similar to the method introduced in one of our earlier works19 and opposite to the approach of Coutinho et al., it is not the potential but the charge density of the environment which is averaged. The distinction is not necessary in the case of electrostatic-only embedding because the embedding potential depends linearly on the charge density of the environment. The non-electrostatic term (the functional derivative of Enadxct[ρA,ρB]) can be associated with the quantum confinement effects. In this work, as in other applications of FDET, Enadxct[ρA,ρB] is approximated by an analytic expression Ẽnadxct[ρA,ρB]. The fact that Enadxct[ρA,ρB] is order-one homogeneous40 in neither ρA nor ρB lies at the origin of the fact that eqn (2) is an approximation and not an exact relation. The same concerns Ẽnadxct[ρA,ρB]. The present results show that the inhomogeneity in ρB of the used approximated density functional for Enadxct[ρA,ρB] results in a negligible error in the solvatochromic shift (in the 0.02 eV range). Concerning the inhomogeneity in ρA, it leads to coupling between the electronic structure of the embedded species and the structure of the solvent if the observable is evaluated form the left-hand-side of eqn (2). For each geometry of the solvent, the corresponding ρA(r) is different, because the embedding potential depends on ρA(r). In the right-hand-side of eqn (2) such couplings are completely neglected.
The actual results presented in this work concern a simple and rigid chromophore solvated in liquid water. In such a case, different configurations representing the statistical ensemble differ but the differences concern mainly the solvent and not the solute. The FDET based averaging approach proposed in the present work can be expected to be adequate used for studies of rigid chromophores in structurally disordered and fluctuating environments. It can be used without further modifications also for studies of a flexible solute provided its structure oscillates around a common global geometry. In the case of a solute occurring in several conformations (cis/trans forms, different tautomeric forms, etc.), the approach proposed in the present work can also be adopted in a straightforward manner. To this end eqn (2) shall be applied for each conformer separately. Such applications are beyond the scope of this article and are subject of our current research.
Using an explicit ρA,ρB-dependent analytic formula to approximate the functional Enadxct[ρA,ρB] leads also to the corresponding analytic approximated expressions in the embedding potential. Replacing ρB by 〈ρB〉 can always be made in the analytic formula. In the case of the exact functional, the situation is more involved. Whereas Enadxct[ρA,〈ρB〉] is well defined for any pair of N-representable densities,9 the existence of the corresponding potential hinges on a more stringent condition – v-representability of either ρA(r) or ρA(r) + 〈ρB〉(r). Similar to any other density functional theory formulations, this condition cannot be assured in practice. We notice, however, that 〈ρB〉(r) is a significantly smoother function that any instantaneous ρB(r) taken from the statistical ensemble. It becomes even uniform for non-structured liquids.
The embedding potential (vFDETemb[ρA,〈ρB〉,〈vB〉](r)) evaluated as a functional of the non-uniform continuum descriptors of the solvent: ρA(r), 〈ρB〉(r), and 〈vB〉(r) derived from the statistical ensemble of conformations of the solvent molecules obtained in atomistic simulations was used in the present work to evaluate the solvatochromic shifts in absorption within the general framework of LR-TDDFT. The embedded wavefunction (both interacting or non-interacting) can be, however, used to evaluate any quantum mechanical observable associated with an operator Ô according to the formula given in eqn (2). Although the adequacy of the approximation given in eqn (2) shall be subject to numerical validation similar to that presented in the present work, the presented numerical results indicate that the prospects of using this approximation for other observables are promising.
Acknowledgements
This research was supported by grants from Swiss National Science Foundation (200021_152779). The authors are grateful to Prof. Kurt Mikkelsen for providing the trajectories used for averaging the quantities discussed in this work.
References
- T. A. Wesolowski and A. Warshel, J. Phys. Chem., 1993, 97, 8050–8053 CrossRef CAS.
- J. Åquist and A. Warshel, Chem. Rev., 1993, 93, 2523–2544 CrossRef.
- D. Bakowies and W. Thiel, J. Phys. Chem., 1996, 100, 10580–10594 CrossRef CAS.
- C. J. Cramer and D. G. Truhlar, Chem. Rev., 1999, 99, 2161–2200 CrossRef CAS PubMed.
- J. Sauer, P. Ugliengo, E. Garrone and V. R. Sounders, Chem. Rev., 1994, 94, 2095 CrossRef CAS.
- J. Tomasi, B. Mennucci and R. Cammi, Chem. Rev., 2005, 105, 2999–3093 CrossRef CAS PubMed.
- H. M. Senn and W. Thiel, Angew. Chem., Int. Ed., 2009, 48, 1198–1229 CrossRef CAS PubMed.
-
J. Gao, Reviews in Computational Chemistry, John Wiley & Sons, Inc., 2007, pp. 119–185 Search PubMed.
- T. A. Wesolowski, Phys. Rev. A: At., Mol., Opt. Phys., 2008, 77, 012504 CrossRef.
- K. Pernal and T. A. Wesolowski, Int. J. Quantum Chem., 2009, 109, 2520–2525 CrossRef CAS.
- T. A. Wesolowski, S. Shedge and X. Zhou, Chem. Rev., 2015, 115, 5891–5928 CrossRef CAS PubMed.
- J. Neugebauer, Phys. Rep., 2010, 489, 1–87 CrossRef CAS.
- C. R. Jacob and J. Neugebauer, Wiley Interdiscip. Rev.: Comput. Mol. Sci., 2014, 4, 325–362 CrossRef CAS.
- A. S. P. Gomes and C. R. Jacob, Annu. Rep. Prog. Chem., Sect. C: Phys. Chem., 2012, 108, 222–277 RSC.
- F. Libisch, C. Huang and E. A. Carter, Acc. Chem. Res., 2014, 47, 2768–2775 CrossRef CAS PubMed.
- N. Govind, Y. A. Wang, A. J. R. da Silva and E. A. Carter, Chem. Phys. Lett., 1998, 295, 129–134 CrossRef CAS.
- J. Neugebauer, J. Chem. Phys., 2007, 97, 134116 CrossRef PubMed.
- M. Pavanello, J. Chem. Phys., 2013, 138, 204118 CrossRef PubMed.
- J. W. Kaminski, S. Gusarov, T. A. Wesolowski and A. Kovalenko, J. Phys. Chem. A, 2010, 114, 6082–6096 CrossRef CAS PubMed.
- X. Zhou, J. W. Kaminski and T. A. Wesolowski, Phys. Chem. Chem. Phys., 2011, 13, 10565–10576 RSC.
- S. V. Shedge and T. A. Wesolowski, ChemPhysChem, 2014, 15, 3291–3300 CrossRef CAS PubMed.
-
A. Kovalenko, Molecular Theory of Solvation, Springer Netherlands, 2003, pp. 169–275 Search PubMed.
-
M. E. Casida, Recent Advances in Computational Chemistry, World Scientific, Singapore, 1995, vol. 1, part 1, p. 155 Search PubMed.
- T. A. Wesolowski, J. Am. Chem. Soc., 2004, 126, 11444–11445 CrossRef CAS PubMed.
- M. E. Casida and T. A. Wesolowski, Int. J. Quantum Chem., 2004, 96, 577–588 CrossRef CAS.
- W. Kabsch, Acta Crystallogr., Sect. A: Cryst. Phys., Diffr., Theor. Gen. Crystallogr., 1976, 32, 922–923 CrossRef.
- W. Kabsch, Acta Crystallogr., Sect. A: Cryst. Phys., Diffr., Theor. Gen. Crystallogr., 1978, 34, 827–828 CrossRef.
- K. Coutinho, H. C. Georg, T. L. Fonseca, V. Ludwig and S. Canuto, Chem. Phys. Lett., 2007, 437, 148–152 CrossRef CAS.
- J. Neugebauer, M. J. Louwerse, E. J. Baerends and T. A. Wesolowski, J. Chem. Phys., 2005, 122, 094115 CrossRef PubMed.
- K. Aidas, J. Kongsted, A. Osted, K. V. Mikkelsen and O. Christiansen, J. Phys. Chem. A, 2005, 109, 8001–8010 CrossRef CAS PubMed.
- I. Renge, J. Phys. Chem. A, 2009, 113, 10678–10686 CrossRef CAS PubMed.
- W. P. Hayes and C. J. Timmons, Spectrochim. Acta, 1965, 21, 529–541 CrossRef CAS.
- N. S. Bayliss and E. G. McRae, J. Phys. Chem., 1954, 58, 1002–1006 CrossRef CAS.
- C. W. Porter and C. Iddings, J. Am. Chem. Soc., 1926, 48, 40–44 CrossRef CAS.
- K. Aidas, K. V. Mikkelsen, B. Mennucci and J. Kongsted, Int. J. Quantum Chem., 2011, 111, 1511–1520 CrossRef CAS.
- ADF 2014.06, SCM, Theoretical Chemistry, Vrije Universiteit, Amsterdam, The Netherlands, http://www.scm.com.
- C. R. Jacob, J. Neugebauer and L. Visscher, J. Comput. Chem., 2008, 29, 1011–1018 CrossRef CAS PubMed.
- J. Neugebauer, C. R. Jacob, T. A. Wesolowski and E. J. Baerends, J. Phys. Chem. A, 2005, 109, 7805–7814 CrossRef CAS PubMed.
- M. Humbert-Droz, X. Zhou, S. V. Shedge and T. A. Wesolowski, Theor. Chem. Acc., 2014, 133, 1405 CrossRef.
- A. Zech, F. Aquilante and T. A. Wesolowski, Mol. Phys., 2015 DOI:10.1080/00268976.2015.1125027.
|
| This journal is © the Owner Societies 2016 |
Click here to see how this site uses Cookies. View our privacy policy here.  Open Access Article


![[v with combining circumflex]](https://www.rsc.org/images/entities/i_char_0076_0302.gif) emb)ΨIA = εIΨIA,
emb)ΨIA = εIΨIA,![[v with combining circumflex]](https://www.rsc.org/images/entities/i_char_0076_0302.gif) emb denotes the “embedding operator” given in the form of the potential which in turn is uniquely determined by the charge densities ρA(r) and ρB(r) and the fixed potential vB(r). The functional for this potential is obtained as the functional derivative of the corresponding terms in the total energy functional (eqn (6)) and it is given in eqn (1).
emb denotes the “embedding operator” given in the form of the potential which in turn is uniquely determined by the charge densities ρA(r) and ρB(r) and the fixed potential vB(r). The functional for this potential is obtained as the functional derivative of the corresponding terms in the total energy functional (eqn (6)) and it is given in eqn (1).
![[T with combining tilde]](https://www.rsc.org/images/entities/i_char_0054_0303.gif) nads[ρA,ρB], Ẽnadxc[ρA,ρB], and Δ
nads[ρA,ρB], Ẽnadxc[ρA,ρB], and Δ![[F with combining tilde]](https://www.rsc.org/images/entities/i_char_0046_0303.gif) SC(WFT)[ρA].
SC(WFT)[ρA].

 where P is the number of atoms of solute, ri is a coordinate vector of the solute atom i. Following the algorithm of Kabsch et al.,26,27 for every geometry RAj, j = 2…M we compute a translation vector Tj = Oj − O1 and a rotation matrix Uj and apply the obtained transformation to the geometry RAj
![[R with combining tilde]](https://www.rsc.org/images/entities/b_char_0052_0303.gif) Aj = Uj(RAj − Tj), j = 2…M
Aj = Uj(RAj − Tj), j = 2…M![[R with combining tilde]](https://www.rsc.org/images/entities/b_char_0052_0303.gif) Aj} which minimizes the Root-Mean-Square-Deviation (RMSD) of atomic positions computed for the geometries RA1 and RAj as follows:
Aj} which minimizes the Root-Mean-Square-Deviation (RMSD) of atomic positions computed for the geometries RA1 and RAj as follows:

![[R with combining tilde]](https://www.rsc.org/images/entities/b_char_0052_0303.gif) Bj}
Bj}![[R with combining tilde]](https://www.rsc.org/images/entities/b_char_0052_0303.gif) Bj = Uj(RBj − Tj), j = 2…M
Bj = Uj(RBj − Tj), j = 2…M![[R with combining tilde]](https://www.rsc.org/images/entities/b_char_0052_0303.gif) Aj} and {
Aj} and {![[R with combining tilde]](https://www.rsc.org/images/entities/b_char_0052_0303.gif) Bj} sharing the same origin located at the point O1, one can finally determine the 3D solvent distribution function gk(r). For that purpose the whole volume V occupied by the system is divided into small boxes
Bj} sharing the same origin located at the point O1, one can finally determine the 3D solvent distribution function gk(r). For that purpose the whole volume V occupied by the system is divided into small boxes  and the number nα,k of occurrences of the given atom type k into each elementary volume vα is computed. A uniform set of cubic elementary volumes vα of (0.3)3 size each was used to construct the 3D solvent distribution function gk(r). Consequently, the 3D solvent distribution function gk(α) for the given atom type k in the box α reads:


 , which shows the ability of a chemical substance to absorb light at a given wavelength ω, reads (eqn (24)).
 computed for the first 8 excited state transitions is given by eqn (25)


