 Open Access Article
Creative Commons Attribution 3.0 Unported Licence
Characterisation of the surface of freshly prepared precious metal catalysts
Stewart F.
Parker
*a,
Devashibhai
Adroja
a,
Mónica
Jiménez-Ruiz
b,
Markus
Tischer
c,
Konrad
Möbus
d,
Stefan D.
Wieland
d and
Peter
Albers
e
aISIS Facility, STFC Rutherford Appleton Laboratory, Chilton, Didcot, OX11 0QX, UK. E-mail: stewart.parker@stfc.ac.uk
bInstitut Laue-Langevin, 71 avenue des Martyrs, CS 20156 38042 Grenoble Cedex 9, France
cDESY Photon Science, Notkestr. 85, D-22607 Hamburg, Germany
dEvonik Industries AG, Rodenbacher Chaussee 4, D-63457 Hanau/Wolfgang, Germany
eEvonik Technology & Infrastructure GmbH, Rodenbacher Chaussee 4, D-63457 Hanau/Wolfgang, Germany
First published on 9th March 2016
Abstract
A combination of electron microscopy, X-ray and neutron spectroscopies and computational methods has provided new insights into the species present on the surface of freshly prepared precious metal catalysts. The results show that in all cases, at least half of the surface is metallic or nearly so, with the remainder covered by oxygen, largely as hydroxide. Water is also present and is strongly held; weeks of pumping under high vacuum is insufficient to remove it. The hydroxyls are reactive as shown by their reaction with or displacement by CO and can be removed by hydrogenation. This clearly has implications for how precious metal catalysts are activated after preparation.
Introduction
After synthesis, almost all heterogeneous catalysts undergo some form of activation procedure. For some catalysts the reasons are clear; thus zeolites made by a templating procedure may retain the template in the pores, thus its removal (usually by calcination) is essential in order to allow the reactants into the pores.1 For Ni/Al2O3 methane reforming catalysts, the synthesis results in NiO, reduction of this to Ni metal is required for an active catalyst.2 In the case of Pt or Pd precious metal catalysts the rationale is less clear. The synthesis is usually carried out in aqueous solution by reduction of a precious metal salt. The catalyst is then dried and reduced, the assumption being that an oxide layer has formed on the catalyst.The aim of this paper is to investigate the nature of the surface of an as-prepared catalyst, with a view to better understanding how to optimise the activation procedure. To this end, we have used a combination of structural (transmission electron microscopy (TEM) and extended X-ray absorption fine structure (EXAFS)), spectroscopic (inelastic neutron scattering (INS), X-ray photoelectron spectroscopy (XPS)) and computational techniques to characterise the bulk and surface of a series of freshly prepared precious metal catalysts and blacks.
Experimental
Materials
Commercial high purity palladium (99.11%; CAS No. 7440-05-3) and platinum (98.44%; CAS No. 7440-06-4) black samples were purchased from Umicore Precious Metals Chemistry. The product specification is based on gravimetric analysis and inductively coupled plasma spectroscopy/optical emission spectral analysis (ICP-OES). The BET surface area in both cases is ≥25 m2 g−1. The presence of traces of alkaline elements (Na, K) is noted in the specification of the Pt black.Supported precious metal catalysts were prepared by wet impregnation3,4 to give monometallic Pd(20%)/C and Pt(40%)/C catalysts and a bimetallic Pt(40%)Ru(20%)/C alloy catalyst with a nominal 1![[thin space (1/6-em)]](https://www.rsc.org/images/entities/char_2009.gif) :
:![[thin space (1/6-em)]](https://www.rsc.org/images/entities/char_2009.gif) 1 Pt
1 Pt![[thin space (1/6-em)]](https://www.rsc.org/images/entities/char_2009.gif) :
:![[thin space (1/6-em)]](https://www.rsc.org/images/entities/char_2009.gif) Ru ratio. (All of the catalyst compositions are in wt%). Alloying was induced by reductive high-temperature annealing in a tube furnace using N2/H2 (95/5) forming gas. High purity carbon black with a nitrogen surface area of ca. 60 m2 g−1 was used as the support.
Ru ratio. (All of the catalyst compositions are in wt%). Alloying was induced by reductive high-temperature annealing in a tube furnace using N2/H2 (95/5) forming gas. High purity carbon black with a nitrogen surface area of ca. 60 m2 g−1 was used as the support.
Transmission electron microscopy (TEM)
A Jeol 2010F field emission transmission electron microscope (FE-TEM) was operated at 200 keV acceleration voltage. A powder sample was dispersed in chloroform and transferred onto holey carbon foil supported by a 200 mesh copper grid. For statistical evaluation of the primary particle sizes of the supported platinum and platinum/ruthenium alloy particles the I-TEM software of Soft Imaging Systems (SIS), Münster, was utilized. The calibration, quality and stability of the TEM system was carried out with the Magical no. 641 standard (Norrox Scientific Ltd., Beaver Pond, Ontario, Canada). For spot analyses of the supported precious metal particles of the Pt(40%)Ru(20%)/C catalyst energy dispersive X-ray nano-spot-analyses (EDX) were performed using a Noran SiLi detector with a 30 mm2 crystal and a Noran System Six device. This allows assessment of the degree of alloying down to the nanometer scale.X-ray photoelectron spectroscopy (XPS)
XPS spectra were recorded using monochromatic AlKα radiation (1486.68 eV) at 150 W. A ThermoFisher ESCALAB 250Xi instrument electron energy analyzer was operated at 50 eV pass energy in the fixed analyzer transmission mode, step 0.1 eV, 30 scans, X-ray spot size 650 μm.Extended X-ray absorption fine structure (EXAFS)
Complementary to FE-TEM/EDX, the alloying treatment was monitored by probing changes of the local coordination numbers of the Pt and Ru atoms by means of EXAFS. The measurements were performed at beamline X1 at the storage ring Doris III at the DESY synchrotron (Hamburg, Germany) in transmission geometry. Ionisation chambers were utilised to record the absorption of a sample as a function of energy. A third ionisation chamber was used to monitor a reference standard sample simultaneously for cross-check. Evaluation of the EXAFS signals was performed according to well-established standard routines. The data-fit was based on the assumption of certain neighbour atoms as backscatterers in the EXAFS process. The corresponding backscatter-amplitudes and – phases (in the present case Pt, Pt-oxides, Ru, Ru-oxides etc.) were determined by ab initio calculations. The data on the reference samples were also fitted using these backscatter-amplitudes and – phases and showed good agreement with the known crystal structures. In the course of the data analyses a variety of backscatter-surroundings were tested. The good agreement between fits and data indicated a positive test of the chosen model. Atomic distances and coordination numbers determined in the alloy catalyst sample show an error of ca. 0.02 nm or ca. 20% for a significantly contributing neighbour shell.Computational methods
Periodic density functional theory (periodic-DFT) calculations were carried out using the plane wave pseudopotential method as implemented in the CASTEP code.5 Exchange and correlation were approximated using the PBE functional. The plane-wave cut-off energy was 830 eV. Brillouin zone sampling of electronic states was performed on 1 × 8 × 8 Monkhorst–Pack grid. The equilibrium structure, an essential prerequisite for lattice dynamics calculations was obtained by BFGS geometry optimization after which the residual forces were converged to zero within ±0.007 eV Å−1. Phonon frequencies were obtained by diagonalisation of dynamical matrices computed using density-functional perturbation theory.6 The atomic displacements in each mode that are part of the CASTEP output, enable visualization of the modes to aid assignments and are also all that is required to generate the INS spectrum using the program ACLIMAX.7Inelastic neutron scattering (INS)
Bulk quantities of the samples (Pd black: 60.5 g, Pd(20%)/C: 31.9 g, Pt black: 40.7 g, Pt(40%)/C: 28.1 g, Pt(40%)Ru(20%)/C: 33.5 g) were measured in cylindrical Viton O-ring sealed stainless steel cans with a wall thickness of 0.5 mm and a base thickness of 1.00 mm. Before the first INS measurement of each sample, it was evacuated at room temperature for one week and, subsequently, at 383 K for one week using a turbomolecular pump to remove residual adsorbed humidity and other potential adsorbates. After the measurement of the catalyst in the freshly prepared state, it was then either cleaned with successive hydrogenation/dehydrogenation cycles or exposed to CO.For most of the samples, there was a measurement during cooling to base temperature of the cryostat (∼5 K) of the INS spectrometer, typically 1.5 hours, followed by a low temperature measurement of 6–8 hours. The cooling runs were almost superimposable on the measurement runs except at the lowest energies (<250 cm−1, due to residual thermal population of excited vibrational states during cooling). To improve the signal-to-noise ratio, in some cases the cooling and measurement runs have been co-added. Spectra were recorded using IN1-Lagrange8 at the Institut Laue-Langevin (Grenoble, France) and MERLIN9 at the ISIS Facility (Chilton, UK). With IN1-Lagrange the samples were measured with the Cu(220) monochromator, over the range 170–4000 cm−1. However, for reasons explained10 elsewhere, the instrument is optimal in the range below 2000 cm−1. In a few cases the region 8–300 cm−1 was also recorded using the Si(111) and Si(311) monochromators. For MERLIN, incident energies of 4840 and 2825 cm−1 were used and the different mode of operation allows access to the 2000–4000 cm−1 range10 with modest resolution. Note that all the spectra are presented as difference spectra, either the cleaned sample or the ‘CO exposed’ sample was used as the background.
Results and discussion
Morphology, size, composition and surface chemistry of the precious metal particles
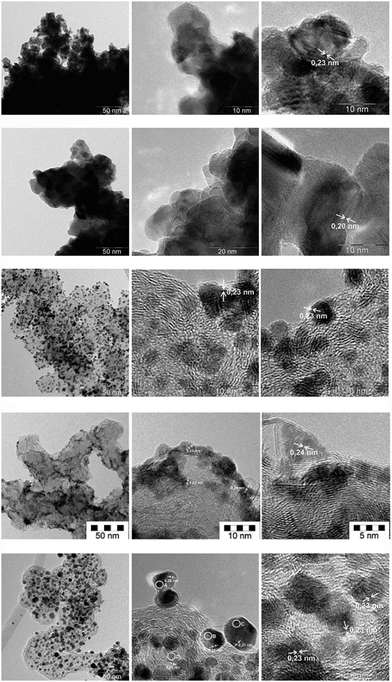
Fig. 1 compares the morphology of the precious metal particles. The platinum and palladium blacks are formed by primary crystallites of varying size which are grown together to form strongly bound large polydisperse aggregates and loosely adherent agglomerates. Lattice imaging reveals the 0.20 nm (palladium[200]) and 0.23 nm (platinum[111]) orientation. The supported monometallic and the alloyed bimetallic platinum catalyst particles, however, are mainly formed by isolated primary crystallites and a few very small aggregates. Comparison of the supported platinum-only and the Pt/Ru catalyst shows small numerical differences in the primary particle size and dispersity (Table 1).| wt% | DNa (nm) | S DN (nm) | DAc (nm) | EMSd (m2 g−1) |
|---|---|---|---|---|
| a DN: primary particle size (arithmetical average) and its standard deviation; DN = (Σnidi)/N. b S DN: primary particle size (arithmetical average) and its standard deviation; DN = (Σnidi)/N. c DA: primary particle size averaged over the surface, DA = (Σnidi3)/(Σnidi2). d EMS: calculated electron microscopic surface; EMS = 6000/(DA × ρ); ρ: density. | ||||
| Pd(20%)/C | 2.24 | 0.25 | 2.29 | 218.8 |
| Pt(40%)/C | 3.11 | 0.65 | 3.39 | 82.8 |
| Pt(40%)Ru(20%)/C | 4.78 | 1.93 | 6.47 | 43.4 |
The EMS values relate to the precious metal surface area and are distinct from the BET surface area of the carbon before wet impregnation (60 m2 g−1). For the case of a monodisperse system DN = DA. The comparison in Table 1 shows that the differences between the DN and DA values are small indicating a narrow distribution function of particle sizes in the ca. 2–6.5 nm range. A low degree of polydispersity of the supported primary particles is established especially for the palladium- and platinum-only catalysts, whereas the difference between DN and DA is higher for the alloy catalyst and also some larger particles appear as a consequence of the alloying procedures. Also the Pd(20%)/C catalyst does show a very narrow distribution of the primary entities. It consists of about 2.5 nm sizes primary crystallites which are partly isolated and partly grown to linear chain-like aggregates of about 10–30 nm length at the edges of the carbon support’s surface which is of enhanced sp2 character.
Table 2 compares results of non-destructive nano-spot elemental analysis by FE-TEM/EDX obtained by focusing the electron beam onto the primary particles of the Pt(40%)Ru(20%)/C final catalyst, (i.e. after annealing and reduction). The alloying between platinum and ruthenium is largely complete: no isolated single Pt- or Ru-only particles were observed in the TEM. The local Pt/Ru ratios are quite similar. As a minor trend, we note that the smaller the particles the (slightly) higher the Ru-concentration which is in line with previous observations on this catalyst.11
| Area | Pt Lα | Error | Ru Lα | Error |
|---|---|---|---|---|
| A | 48.6 | ±2.4 | 51.4 | ±3.4 |
| B | 56.0 | ±3.8 | 44.0 | ±2.5 |
| C | 54.2 | ±2.5 | 45.8 | ±3.3 |
| D | 46.9 | ±2.5 | 53.1 | ±2.6 |
The progress of the alloying process in this catalyst has been monitored by EXAFS. In Fig. 2 the sequential changes of the average coordination numbers (new, fresh catalyst /N, annealed /A, annealed and reduced with forming gas /F) are compared. Probing the PtL3 and RuK absorption edge it is observed that the Pt–O coordination number decreases while the Pt–Ru coordination number increases, whereas the Pt–Pt coordination number increases as oxygen is removed and then partly decreases again as Pt–Ru alloying occurs, with a corresponding increase in the Pt–Ru coordination number. In parallel, the Ru–O coordination in the first and second coordination shell decreases while the Ru–Ru and Pt–Ru coordination number increases. The rise in the Ru–Ru coordination number continues because the average oxidation state of the finely divided Ru was higher than for Pt. This conclusion is supported by the XPS data (see later).
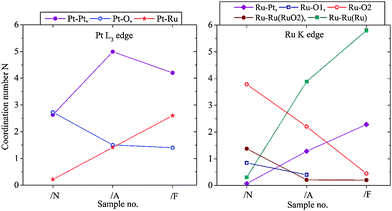 | ||
Fig. 2 Changes of the metal–oxygen and metal–metal coordination from freshly prepared Pt(40%)Ru(20%)/C induced by annealing and annealing/reduction with forming gas (N2/H2 95![[thin space (1/6-em)]](https://www.rsc.org/images/entities/char_2009.gif) : :![[thin space (1/6-em)]](https://www.rsc.org/images/entities/char_2009.gif) 5). 5). | ||
In Fig. 2 (right) the metallic Ru–Ru surrounding is shown in green, Ru–Ru distance = 0.265 nm and 0.270 nm. The RuO2 surrounding is marked in blue and red; there are two inequivalent Ru–O shells and, correspondingly, as next neighbour also a Ru–Ru shell in RuO2 with Ru–Ru distance of 0.354 nm (coordination number N = 8); this is marked as “Ru–RuRuO2”. The decrease of this coordination number implies that the Ru-oxide contribution in the sample is higher dispersed and/or there is decreasing long-range order and increasing sub-stoichiometry in the Ru-oxide content with increasing metal–metal coordination due to the progress of the alloying and removal of Ru-oxide contributions – all sensitive indicators for the progress of the formation of the alloyed bimetallic catalyst.
The nature of the topmost atomic regions of the freshly prepared samples is compared in Table 3 (results of XPS survey analyses). Apart from the residual oxygen, the presence of significant amounts of other electronegative elements such as chlorine etc. is ruled out and supports the conclusions from Fig. 2. Therefore, chemical shifts of the XPS signals of the precious metal atoms are solely due to partial surface oxidation or hydroxylation, and alloying (Table 3). The small decrease in the Pt level comparing the Pt-only (7.5%) and the alloy catalyst (6.9%) is consistent with the small changes in the particle dispersion (Table 1, DN, DA; Fig. 1). For the Pt 4f region, a broadened doublet was detected with signal maxima at 71.2, 71.5 and 71.8 eV in the binding energy region close to pure metallic platinum (ca. 70.9–71.3 eV). A shift of ca. 0.3 eV between the mono- and bimetallic catalyst can be attributed to the alloying and the influence of adjacent Ru-related residual oxygen. No evidence for the presence of significant amounts of stoichiometric PtO or other bivalent Pt species was found. Evaluating the signal widths and asymmetries with respect to the Pt 4f7/2/Pt 4f5/2 ratio by Gaussian/Lorentzian line shape approximation, it was found that in the topmost atomic regions of the samples predominantly metallic (or alloyed, respectively) Pt (ca. 50% at 71.1 eV (Pt black) 55% at 71.3 eV (Pt(40%)/C) and 65% at 71.5 eV (Pt(40%)Ru(20%)/C)) is present together with sub-stoichiometric PtOx and Pt(OH)x, (x < 1), in the condition “as received”. For palladium ca. 60% metallic Pd and ca. 40% surface PdO and/or PdOH is calculated. For Ru ca. 55% metallic/alloyed Ru at 280.3 eV is calculated, plus RuO2 (30% RuO2 at 281.0 eV) and sub-stoichiometric/hydroxylated surface-oxide (15% at 281.7 eV) species. Thus for all of the catalysts, at least 50% of the surface is metallic, or nearly so.
| Element | Pt black | Pt(40%)/C | Pt(40%) Ru(20%)/C | Pd black | Pd(20%)/C |
|---|---|---|---|---|---|
| Pd 3d | — | — | — | 83.2 | 7.3 |
| Pt 4f | 77.4 | 7.5 | 6.9 | — | |
| Ru 3d | — | — | 6.3 | — | |
| C 1s | 1.4 | 81.8 | 80.5 | 5.3 | 80.2 |
| O 1s | 17.8 | 10.6 | 6.3 | 10.9 | 12.2 |
| Na 1s | 0.4 | 0.1 | — | 0.6 | 0.3 |
| N 1s | 2.0 | — | — | — | |
| Pt 4f7/2 max. | 71.2 | 71.5 | 71.8 | ||
| Pd 3d5/2 max. |
334.9
+336.3 |
335.0
335.9 |
|||
| Ru 3d5/2 max. | 280.5 |
Inelastic neutron scattering spectroscopy
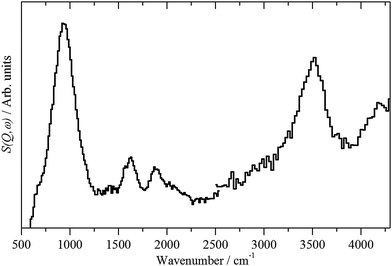
INS spectroscopy is a form of vibrational spectroscopy.12 For the study of catalysts the major advantages of the technique are that the scattering is dominated by modes that involve hydrogen and that all of the other elements present in these samples only make a minor contribution to the spectrum. This means that the complete spectra range 0–4000 cm−1 is, in principle, available. However, for reasons explained elsewhere,10 for instruments of the type of IN1-Lagrange, while the C–H and O–H stretch region is observable, the information content is limited and the best results are obtained for the 0–2000 cm−1 range. For MERLIN, the full 0–4000 cm−1 range is readily accessible, but at reduced resolution in comparison to Lagrange.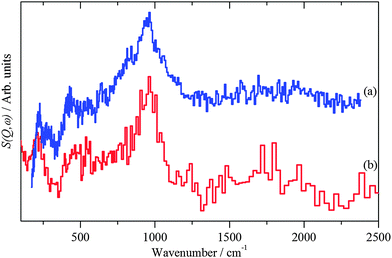 | ||
| Fig. 3 INS spectra of: (a) freshly prepared Pd black recorded on Lagrange and (b) PdO·xH2O (x ∼ 0.31)13 recorded on TOSCA. | ||
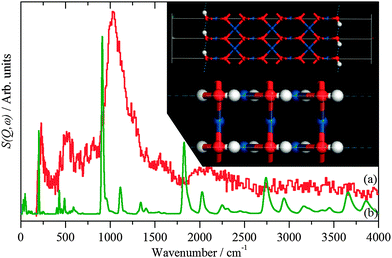 | ||
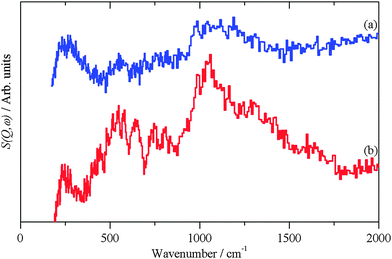
| Fig. 5 INS spectra recorded on Lagrange of: (a) freshly prepared Pt black and (b) generated from the hydroxylated PtO model structure shown in the inset. | ||
The hydroxylated surface was modelled by a hydrogen-terminated surface of PtO, shown in the inset to Fig. 5. A 3.5 layer slab of PtO was generated from the bulk structure of PtO,16 this was constructed to have only oxygen atoms in the top- and bottom-most layers. These were then changed to hydroxyls, the structure was then geometry optimised and the INS spectrum generated from the subsequent phonon calculation. The result is shown in Fig. 5b. The position of the bending mode is slightly underestimated (905 vs. 1035 cm−1), but the overall pattern is correct. Attempts to model the surface as a hydroxylated metal surface i.e. Pt(111)/OH, gave very poor agreement. This finding clarifies the assignment of the XPS binding energy values (Table 3) indicating that no stoichiometric PtO and no Pt(OH)2 is present but suggesting PtOx and/or Pt(OH)x, (x < 1), the latter being verified by Fig. 5. The results strongly suggest that the surface consists of patches of bare metal and sub-stoichiometric hydroxylated PtOx.
| 2OH + CO → H2O + CO2 |
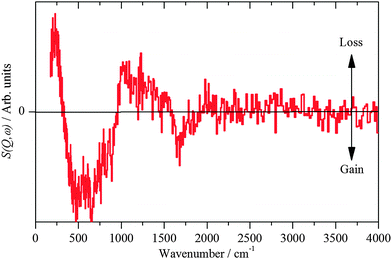 | ||
| Fig. 7 INS spectra recorded on Lagrange of freshly prepared Pt(40%)Ru(20%)/C after reaction with CO. | ||
The hydroxyl bending mode is considerably broader on the PtRu catalyst than on the monometallic catalysts, indicating a much more heterogeneous surface. This is in agreement with the TEM/EDX and EXAFS results that show a broader range of adsorption/coordination sites as compared to the Pt-only catalyst: Pt, PtxRuy, RuOz, Pt/OH, PtRu/OH.
Conclusions
A combination of electron microscopy, X-ray and neutron spectroscopies and computational methods has provided new insights into the species present on the surface of freshly prepared precious metal catalysts. The results show that in all cases, at least half of the surface is metallic, or nearly so, and half is covered by oxygen. A substantial fraction, and perhaps all, of the oxygen is present as hydroxide. There is also water present, for the Pd catalysts and the PtRu catalyst, this is directly observed by INS. The similarity of the Pd black and PdO·H2O spectra (Fig. 3) argues that the water is hydrogen-bonded to the hydroxyls, rather than on the bare metal surface. The water is strongly held; weeks of pumping under high vacuum is insufficient to remove it completely. The hydroxyls are reactive as shown by their reaction with or displacement by CO and can be removed by hydrogenation. This clearly has implications for how catalysts are activated after preparation. Indeed, the presence of bare metal suggests that an activation process is only necessary if the full activity of the catalyst is needed immediately.Acknowledgements
This work is based, in part, on experiments performed at the IN1-Lagrange instrument at the Institut Laue-Langevin (ILL), Grenoble, France. The STFC Rutherford Appleton Laboratory is thanked for access to neutron beam facilities. Computing resources (time on the SCARF compute cluster for the CASTEP calculations) was provided by STFC's e-Science facility. Parts of this research were carried out at the light source DORIS III at DESY, a member of the Helmholtz Association (HGF).Notes and references
- J.-L. Guth and H. Kessler, Synthesis of Aluminosilicate Zeolites and Related Silica-Based Materials in Catalysis and Zeolites: Fundamentals and Applications, ed. J. Weitkamp and L. Poppe, Springer-Verlag, Berlin, 1999, ch. 1 Search PubMed.
- A. McFarlane, L. McMillan, I. P. Silverwood, N. G. Hamilton, D. Siegel, S. F. Parker, D. T. Lundie and D. Lennon, Catal. Today, 2010, 155, 206–213 CrossRef CAS.
- N. Giordano, E. Passalacqua, L. Pino, A. Arico, K. Antonucci, M. Vivaldi and K. Kinoshita, Electrochim. Acta, 1991, 36, 1979 CrossRef CAS.
- A. Honji, T. Mori and Y. Hishinuma, J. Electrochem. Soc., 1990, 137, 2084 CrossRef CAS.
- S. J. Clark, M. D. Segall, C. J. Pickard, P. J. Hasnip, M. J. Probert, K. Refson and M. C. Payne, Z. Kristallogr., 2005, 220, 567 CAS.
- V. Milman, A. Perlov, K. Refson, S. J. Clark, J. Gavartin and B. Winkler, J. Phys.: Condens. Matter, 2009, 21, 485404 CrossRef PubMed.
- A. J. Ramirez-Cuesta, Comput. Phys. Commun., 2004, 157, 226 CrossRef CAS.
- A. Ivanov, M. Jiménez-Ruiz and J. Kulda, J. Phys.: Conf. Ser., 2014, 554, 012001 CrossRef.
- R. I. Bewley, R. S. Eccleston, K. A. McEwen, S. M. Hayden, M. T. Dove, S. M. Bennington, J. R. Treadgold and R. L. S. Coleman, Physica B, 2006, 385–386, 1029–1031 CrossRef CAS.
- S. F. Parker, D. Lennon and P. W. Albers, J. Appl. Spectrosc., 2011, 65, 1325–1341 CrossRef CAS.
- P. W. Albers, W. Weber, K. Kunzmann, M. Lopez and S. F. Parker, Surf. Sci., 2008, 602, 3611 CrossRef CAS.
- P. C. H. Mitchell, S. F. Parker, A. J. Ramirez-Cuesta and J. Tomkinson, Vibrational spectroscopy with neutrons, with applications in chemistry, biology, materials science and catalysis, World Scientific, Singapore, 2005 Search PubMed.
- S. F. Parker, K. Refson, A. C. Hannon, E. Barney, S. J. Robertson and P. Albers, J. Phys. Chem. C, 2010, 114, 14164–14172 CAS.
- J.-C. Li, J. D. Londono, D. K. Ross, J. L. Finney, S. M. Bennington and A. D. Taylor, J. Phys.: Condens. Matter, 1992, 4, 2109–2116 CrossRef CAS.
- T. J. Udovic, R. R. Cavanagh and J. J. Rush, J. Am. Chem. Soc., 1988, 110, 5590 CrossRef CAS.
- W. J. Moore and L. Pauling, J. Am. Chem. Soc., 1941, 63, 1392–1394 CrossRef CAS.
- S. F. Parker, Chem. Commun., 2011, 47, 1988–1990 RSC.
| This journal is © the Owner Societies 2016 |

