Catalytic mechanism of C–F bond cleavage: insights from QM/MM analysis of fluoroacetate dehalogenase†
Yanwei
Li
a,
Ruiming
Zhang
a,
Likai
Du
b,
Qingzhu
Zhang
*a and
Wenxing
Wang
a
aEnvironment Research Institute, Shandong University, Jinan 250100, PR China. E-mail: zqz@sdu.edu.cn; Fax: +86 531 8836 1990
bKey Laboratory of Bio-based Materials, Qingdao Institute of Bio-energy and Bioprocess Technology, Chinese Academy of Sciences, Qingdao 266101, PR China
First published on 16th September 2015
Abstract
The catalytic mechanisms of fluoroacetate dehalogenase (FAcD) toward substrates fluoroacetate and chloroacetate were studied by a combined quantum mechanics/molecular mechanics (QM/MM) method. There are twenty snapshots considered for each of the three individual systems. By analyzing multiple independent snapshots, positive or negative relationships between energy barriers and structural parameters in defluorination and dechlorination processes were established. We have also shown that conformational variations may cause enzymatic preference differences toward competitive pathways. Besides residues Arg111, Arg114, His155, Trp156, and Tyr219, the importance of residues His109, Asp134, Lys181, and His280 during the defluorination process were also highlighted through electrostatic analysis. These results may provide clues for designing new biomimetic catalysts toward degradation of fluorinated compounds.
1. Introduction
Fluorinated compounds are widely used in numerous industries and presently compose up to 20% of all pharmaceuticals and 30% of all the agrochemicals.1–3 Their large-scale applications have caused increasing environmental concerns due to their toxicity, global warming potential, environmental persistence, and bioaccumulation character.4–6 It is thus critically important to set up strategies to minimize continued exposure of these fluorinated compounds. Environmental biotransformation, one of the most promising strategies with the lowest energy consumption, has provided some encouraging results in cleaving the highly stable C–F bond, whose dissociation energy is the highest among all the natural products (~130 kcal mol−1).1 For example, fluoroacetate dehalogenase (FAcD) discovered in bacteria Burkholderia sp. FA1 was found to catalyze the dehalogenation process of its natural substrate fluoroacetate (FAc).1 FAc is very stable and toxic, and has been widely manufactured and used as a vertebrate pest control agent in many countries like the United States, Mexico, Australia, and New Zealand.7,8 The dehalogenation process catalyzed by FAcD has attracted the most interest and currently serves as the model system for enzymatic defluorination investigations.1,9–18The catalytic mechanism of FAcD has been investigated for many decades, mainly using site-directed mutagenesis and electrospray mass spectrometry.9–11 Jitsumori et al. reported the first crystallization structure of FAcD (from Burkholderia sp. FA1), which makes the mechanical elucidation of FAcD at the molecular level possible.13 They also found that defluorination of FAcD requires a catalytic triad Asp–His–Asp, and the aspartate acts as a nucleophile and directly ejects the fluoride anion from FAc. Because the substrate FAc was not co-crystallized in the crystal (PDB code 1Y37), Yoshizawa and coworkers predicted the binding mode of FAc with FAcD and investigated the subsequent mechanisms through quantum mechanics/molecular mechanics (QM/MM) calculations.14,17 In these two excellent pioneering studies, the authors not only managed to determine the reaction barrier of defluorination and dechlorination, but also explored the roles of residues near the halide ion. However, the theoretically predicted binding mode of the substrate is quite different from the binding mode found in the co-crystallized FAcD–FAc complex (PDB code 3R3V) extracted in another bacterium Rhodopseudomonas palustris CGA009.14,16,17 This inconformity raises interest to further investigate the catalytic mechanism of FAcD (PDB code 3R3V) and answer the question of what are the structural requirements that enable defluorination rather than dechlorination.16 Understanding defluorination details of FAcD may be helpful in enzyme engineering or biomimetic catalysis to remove harmful fluorinated compounds from the environment. The relative locations of key active site residues and substrate FAc are illustrated in Fig. S1, ESI.†
Flexibility is one of the most intriguing characteristics of enzymes. Recent room-temperature single molecule experiments have shown that enzyme molecules exhibit large turnover rate fluctuations with a broad range of time scales (1 ms–100 s).19,20 This leads to the proposal that each of the conformational states of an enzyme are long-lived, and correspond to a different turnover rate constant.21,22 Thus, although it is still not common, considering multiple snapshots is highly recommended when modelling enzymatic reactions.23–25 Multiple snapshots should be considered when theoretically exploring why FAcD prefers defluorination rather than dechlorination.
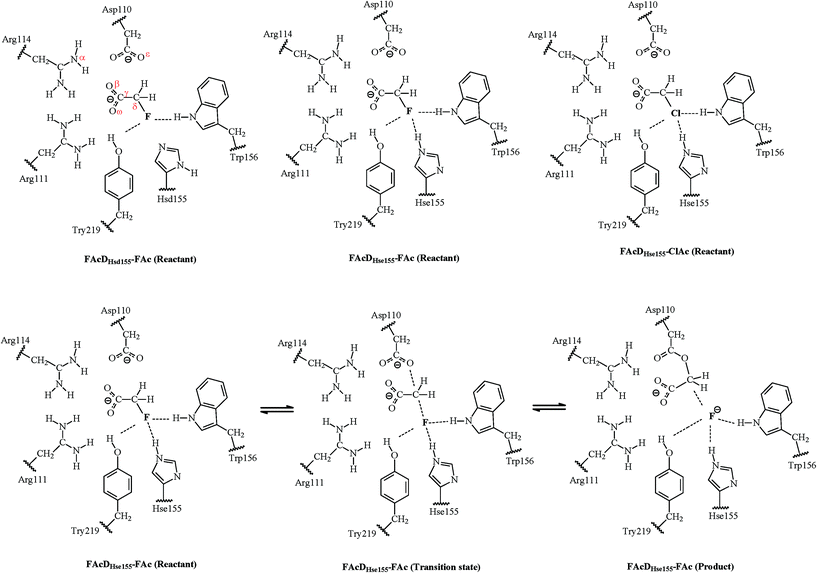
One of the main purposes of the current QM/MM analysis is to investigate what are the structural requirements for FAcD (from bacterium Rhodopseudomonas palustris CGA009, PDB code 3R3V) in enabling defluorination rather than dechlorination by considering twenty snapshots. This may help in designing de novo enzymes or biomimetic catalysts for degradation of other fluorinated compounds. The present study also tries to provide solutions on how to identify the two possible states of a neutrally charged histidine (Hsd155 or Hse155, as shown in Scheme 1) of FAcD. This is valuable because currently there are still no better solutions than visual inspection of the local hydrogen-bonding environment in distinguishing these two neutrally charged states.26 In total, there are sixty reaction pathways studied, forty for defluorination (with Hsd155 and Hsd155) and twenty for dechlorination by FAcD.
2. Methods
2.1 MD simulation
The initial models for the present simulation were built on the basis of the X-ray crystal structure of FAcDD110N–FAc binary complex (PDB code 3R3V, resolution 1.50 Å) obtained from the Protein Data Bank (http://www.rcsb.org).16 The mutated residue (D110N) presented in the crystal structure was manually transformed back into its natural form. The missing hydrogen atoms in the crystal structure were added through a CHARMM22 force field in the HBUILD module of the CHARMM package.27–29 The whole enzyme was dissolved in a water droplet (TIP3P model)30 with a radius of 35 Å. Then, the enzyme-water system was neutralized by sodium ions via random substitution of solvent water molecules before being relaxed through energy minimizations. The whole system was first heated from absolute zero to 298.15 K within 50 ps (1 fs per step) and equilibrated thermally for 500 ps (1 fs per step) to reach the equilibration state. After that, a 10 ns stochastic boundary molecular dynamics (SBMD) simulation was performed at 298.15 K using a NVT ensemble for conformational sampling.31 During the SBMD simulations, the whole system moved freely except the substrate, the coordinates of which are restrained to keep consistence with its positions in the crystal structure. The leap-frog algorithm and Langevin temperature coupling method implemented in the CHARMM program were applied during the simulations. The obtained root-mean-square deviation is provided in Fig. S2, ESI.†2.2 QM/MM calculations
The QM/MM calculations were performed using the ChemShell32 platform, which can integrate the programs Turbomole33 and DL-POLY.34 The charge shift model35 and electrostatic embedding method36 were used during the QM/MM calculations. The geometries of the intermediates were optimized using hybrid delocalized internal coordinates optimizer, whereas transition state searches were carried out using the microiterative TS optimizer under the B3LYP/6-31G(d,p)//CHARMM22 level.37 Frequency calculations were performed to validate the one imaginary frequency character of transition state structures, and the suitability of the transition vector was also confirmed. Additional single point energy calculations were carried out at the RIMP2/cc-pVTZ//CHARMM22 level for better description of the energy profiles.Three systems have been investigated in the present study. For convenience of the description, they are named as FAcDHsd155–FAc, FAcDHse155–FAc, and FAcDHse155–ClAc. The QM regions contain residues Asp110, Arg111, His155, Trp156, Tyr219, a water molecule, and a substrate (FAc or ClAc), as labeled in Scheme 1. This results in 90 QM atoms in total. For all these three systems, the MM atoms within 20 Å of element F or Cl were allowed to move, whereas the other MM atoms were fixed during the QM/MM calculations. Twenty snapshots were extracted from the 10 ns molecular dynamics trajectory with an interval of 0.5 ns for each of the three systems.
2.3 Boltzmann-weighted average
To analyze the computed energy barrier spreads among twenty snapshots, the average barrier were calculated by Boltzmann-weighted average method38–40 as follows:where ΔE is the average barrier, R is the gas constant, n is the number of snapshots, ΔEi is the energy barrier of path i, and T is the temperature. For a small n value, if the set of starting geometries include one with an anomalously low energy barrier, this will have a disproportionate effect on the Boltzmann-weighted average barrier. The disproportionate effect can be evaluated by the following equation:
where DE represents the disproportionate effect, ΔEa−l is the Boltzmann-weighted average barrier calculated by neglecting the snapshot with the lowest energy barrier and ΔEa is the Boltzmann-weighted average barrier with all the snapshots considered.
3. Results and discussion
The first step of this study is to identify the reliability of the calculation method. Due to the absence of the X-ray crystal structure of the FAcDwild–FAc binary complex, it is difficult to make a direct comparison between the calculated results and the experimental data. To verify the reliability of the computational results, we optimized the available crystal structure of FAcDD110N–FAc binary complex at the B3LYP/6-31G(d,p)//CHARMM22 level. The calculated results agree well with the available experimental values. For example, the spatial distances of Nα–Oβ, Oβ–Cγ, Cγ–Cδ, and Cδ–F are 2.79, 1.26, 1.52, and 1.44 Å, in accordance with the X-ray data of 2.98, 1.19, 1.54, and 1.42 Å (atomistic labels are shown in Scheme 1).16 Consequently, it might be inferred that the choice of the B3LYP/6-31G(d,p) method for QM region geometric optimizations is appropriate in the present study.3.1 Reaction mechanism and potential energy profiles
The one-step dehalogenation reaction of FAcD toward FAc was shown in Scheme 1. The reaction is triggered by a negatively charged residue Asp110. Asp110 acts as a nucleophile and attacks Cδ atom of substrate FAc, which eventually lead to the C–F bond cleavage and F ion elimination, similar with the previously proposed dehalogenation mechanism.14 However, the binding mode of substrate FAc is different, as indicated in Fig. S1(a–d) and Table S1, ESI.† In addition, a water molecule was found to stabilize the leaving F ion through a hydrogen bond, which has not been reported.14 It is likely that this water molecule is crucial in the ejection process of the F ion, as indicated in Fig. S1(e), ESI.† More structural analysis on the dehalogenation itineraries will be discussed in the following section. For system FAcDHsd155–FAc, a substantial energy barrier spread, 12.5–26.8 kcal mol−1, among twenty different snapshots has been found. Similar substantial energy barrier spreads for systems FAcDHse155–FAc (9.7–21.5 kcal mol−1) and FAcDHse155–ClAc (13.0–23.6 kcal mol−1) were also found. By assuming that each snapshot extracted from the dynamics trajectory corresponds to a local rate constant,41 these calculated energy barrier fluctuations may be helpful in rationalizing recent single molecule experiment findings that the reaction rate of a single enzyme molecule is not constant but exhibits large fluctuations with a broad range.19,20,22,39The Boltzmann-weighted average barriers, energy barrier spreads, and the disproportionate effects for the three systems were provided in Table 1. The detailed barriers and imaginary frequencies for each reaction pathway were provided in Table 2. No anomalously low energy barriers were found for all the three systems, as indicated by the low value of disproportionate effects (2.9%, 8.8%, and 4.8%). The Boltzmann-weighted average barrier of system FAcDHsd155–FAc is 13.8 kcal mol−1, which is 2.4 kcal mol−1 higher than that of system FAcDHse155–FAc. This implies that FAcDHse155 structure is slightly feasible than FAcDHsd155. By analyzing the energy barriers of twenty different snapshots, about 70% of the barriers in system FAcDHsd155–FAc were found to be higher than the barriers in corresponding snapshots in system FAcDHse155–FAc, as shown in Table 2. Although it is credible at a relatively high ratio (about 70%) in predicting the feasibility of competitive pathways using a single snapshot, errors may also occur. For example, if only snapshot 6 ns is used in distinguishing the competitive pathways, error occurs: FAcDHsd155 (ΔE = 14.6 kcal mol−1) may seem more feasible than FAcDHse155 (ΔE = 19.3 kcal mol−1).
| Systems | Barrier spreads/(kcal mol−1) | Boltzmann-weighted average barriers/(kcal mol−1) | Disproportionate effects |
|---|---|---|---|
| FAcDHsd155–FAc | 12.5–26.8 | 13.8 | 2.9% |
| FAcDHse155–FAc | 9.7–21.5 | 11.4 | 8.8% |
| FAcDHse155–ClAc | 13.0–23.6 | 14.5 | 4.8% |
| Systems | FAcDHsd155–FAc | FAcDHse155–FAc | FAcDHse155–ClAc | |||
|---|---|---|---|---|---|---|
| Snapshots/ns | Barrier/(kcal mol−1) | Imaginary frequency/(cm−1) | Barrier/(kcal mol−1) | Imaginary frequency/(cm−1) | Barrier/(kcal mol−1) | Imaginary frequency/(cm−1) |
| 0.5 | 12.5 | 315i | 14.3 | 294i | 15.4 | 213i |
| 1 | 18.9 | 312i | 18.6 | 327i | 17.8 | 239i |
| 1.5 | 19.6 | 317i | 15.1 | 298i | 20.4 | 211i |
| 2 | 22.6 | 329i | 20.2 | 302i | 17.6 | 251i |
| 2.5 | 19.1 | 307i | 10.7 | 330i | 19.2 | 226i |
| 3 | 21.7 | 297i | 20.5 | 281i | 17.4 | 215i |
| 3.5 | 21.4 | 311i | 16.0 | 309i | 19.8 | 209i |
| 4 | 20.7 | 321i | 9.7 | 277i | 13.6 | 199i |
| 4.5 | 19.8 | 299i | 15.5 | 289i | 13.0 | 224i |
| 5 | 22.1 | 329i | 17.8 | 297i | 18.5 | 231i |
| 5.5 | 26.8 | 311i | 21.9 | 301i | 23.3 | 224i |
| 6 | 14.6 | 300i | 19.3 | 276i | 14.8 | 218i |
| 6.5 | 12.7 | 285i | 15.0 | 296i | 23.6 | 212i |
| 7 | 22.6 | 333i | 16.5 | 306i | 14.6 | 217i |
| 7.5 | 27.9 | 311i | 15.3 | 292i | 23.4 | 282i |
| 8 | 13.1 | 352i | 16.9 | 314i | 18.0 | 176i |
| 8.5 | 16.2 | 305i | 16.5 | 309i | 19.4 | 274i |
| 9 | 18.4 | 308i | 16.2 | 295i | 21.0 | 247i |
| 9.5 | 25.3 | 331i | 21.5 | 308i | 17.2 | 243i |
| 10 | 25.4 | 328i | 20.3 | 286i | 20.0 | 252i |
The following dehalogenation investigations toward substrate FAc and ClAc were mainly investigated on the basis of structure FAcDHse155 because it is energetically feasible than structure FAcDHsd155. The Boltzmann-weighted average barrier of system FAcDHse155–FAc (11.4 kcal mol−1) is 3.1 kcal mol−1 lower than that of system FAcDHse155–ClAc (14.5 kcal mol−1), which indicates that defluorination is more feasible than dechlorination. Interestingly, gas phase calculations (without protein environment) performed at the RIMP2/cc-pVTZ//B3LYP/6-31G(d,p) level using Gaussian 09 program42 showed that energy barriers for defluorination (105.8 kcal mol−1) is 33.1 kcal mol−1 higher than that of dechlorination (72.7 kcal mol−1) (Scheme S1, ESI†). By considering the contribution from side chains of Arg111 and Arg114, significant lower barriers were found for defluorination (37.7 kcal mol−1) and dechlorination (18.1 kcal mol−1). This highlights the importance of residues Arg111 and Arg114 in dehalogenation reactions. However, residues Arg111 and Arg114 are not responsible for the fact that FAcD prefers defluorination (11.4 kcal mol−1) rather than dechlorination (14.5 kcal mol−1). Discussions on this issue will be provided in detail in the following paragraphs through both structural and energetic aspects.
3.2 Dehalogenation itineraries
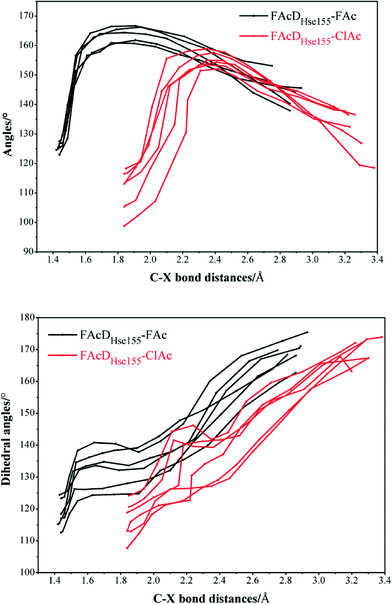
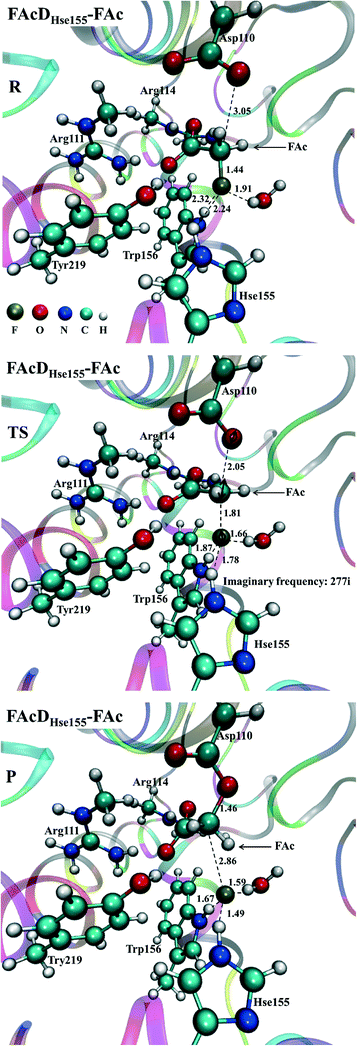
Among all the twenty studied snapshots, six snapshots with lowest energy barriers in systems FAcDHse155–FAc (0.5 ns, 1.5 ns, 2.5 ns, 4 ns, 6.5 ns, and 7.5 ns) and FAcDHse155–ClAc (0.5 ns, 4 ns, 4.5 ns, 6 ns, 7 ns, and 9.5 ns) were chosen for the following dehalogenation itinerary investigations. The variations of two crucial geometry parameters, angle OεCδX and dihedral OωCγCδOε, along the dehalogenation processes (indicated by bond Cδ–X increase) were provided in Fig. 1. For a more direct view, the spatial locations of active site residues in the structures of reactants, transition states and products for systems FAcDHse155–FAc (4 ns, ΔE = 9.7 kcal mol−1) and FAcDHse155–ClAc (4.5 ns, ΔE = 13.0 kcal mol−1) were representatively displayed in Fig. 2 and Fig. S3,† respectively. Fig. 2 shows that residues Arg111 and Arg114 provide hydrogen network stabilization for the carboxy group of FAc or ClAc, whereas residues His155, Trp156, and Tyr219 provide stabilization for F or Cl. As shown in Fig. 1, the calculated Cδ–X bond distances in the reactant structures of systems FAcDHse155–FAc (1.42–1.44 Å) and FAcDHse155–ClAc (1.84–1.85 Å), and the calculated dihedral OωCγCδOε in the products of system FAcDHse155–FAc (162.7–175.4°) are all in promising agreement with the available crystal data (1.42 Å, 1.79 Å, and 172.2°, respectively).16 The angles of OεCδF and OεCδCl in the transition states locate at the range of 161.0–166.8° and 149.3–157.9°, which are slightly deviated from the theoretical value (180°) for an SN2 reaction. Another interesting issue is the variation of dihedral OωCγCδOε. Previous ab initio calculations in free solutions indicate an orthogonal direction (~90°) of the dihedral OωCγCδOε during the dehalogenation process, whereas the crystal data of the product (3R3Y, resolution 1.15 Å) indicate a nearly coplanar dihedral OωCγCδOε (172.2°).43To get a more comprehensive understanding, more analysis on the dehalogenation process were performed, and a dynamic property of dihedral OωCγCδOε during the dehalogenation processes was found. For example, OωCγCδOε varies from 112.6–124.4° (reactants) to 125.1–138.6° (transition states) and finally to 162.7–175.4° (products) during defluorination processes by enzyme FAcD. In addition, the natural population analysis (NPA) on systems FAcDHse155–FAc and FAcDHse155–ClAc were performed and the natural charge variations are provided in Table S2, ESI.† The natural charges of the halide atoms in two systems are significantly different: natural charges of atom F changes from −0.43 ± 0.02 to −0.73 ± 0.04, whereas the natural charges of atom Cl changes from −0.18 ± 0.02 to −0.89 ± 0.02 during the dehalogenation processes. The natural charges of halide ions in the products indicate a better stabilization of FAcD toward F (−0.73 ± 0.04) than Cl (−0.89 ± 0.02).
3.3 Potential energy profiles versus key structural parameters
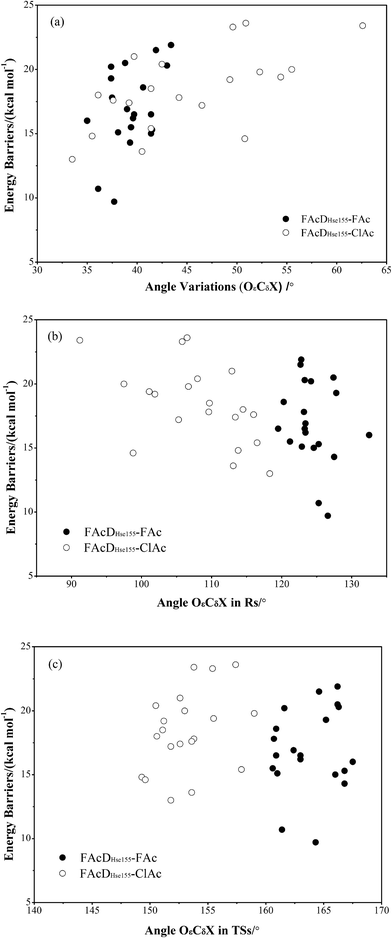
To gain a more comprehensive understanding between potential energy profiles and structural parameters, twenty energy barriers in both defluorination and dechlorination reactions as a function of the corresponding angle OεCδX (X = F or Cl) variations (from reactants to transition states), the values of angle OεCδX in the reactants, and the values of angle OεCδX in the transition states were provided, as shown in Fig. 3. Although it is not possible to establish a precise correlation, in some way the barriers tend to increase as the angle OεCδX variations becomes larger (Fig. 3a). Because distribution ranges of angle OεCδX in the transition states (within 10°) are about two or three times narrower than that in the reactants, the established barrier increasing tendency was mainly associated with the value of angle OεCδX in reactants, as shown in Fig. 3b and c. This may at least provide one suggestion for biomimetic catalyst or de novo enzyme designing in enhancing the C–F or C–Cl bond cleavage: try to increase the value of angle OεCδX in the reactant structures. The relatively smaller angles of OεCδCl (91.2–118.3°) compared with OεCδF (119.5–132.5°) in the reactants were mainly due to the improper binding of ClAc in the smaller active site pocket designed for accommodating the natural substrate (FAc) of FAcD. This highlights the importance of residues Arg111, Arg114, His155, Trp156, and Tyr219 during the dehalogenation processes. For example, mutations of Arg111Lys or His155Asn may change the topology of the active site and increase the angle values. Plots displaying the potential energy barriers versus different structural parameters (such as dihedral OωCγCδOε and bond OεCδ) are provided in Fig. S4 and S5† for searching any other promising correlation between barrier and structure.3.4 Residue electrostatic influence
The activation energy difference caused by amino acid i can be described as follows:| ΔEi–0 = ΔEi − ΔE0 |
The electrostatic influences of twenty residues on defluorination and dechlorination processes are schematically represented in Fig. 4. The electrostatic contacts from residues His155, Trp156, and Tyr219 have been proposed to be important in dehalogenation processes of FAcD,14 which was confirmed in the present study. In addition, the electrostatic influences of His155, Trp156, and Ty219 on defluorination are considerably stronger than on dechlorination. Our analysis also highlights four residues (His109, Asp134, Lys181, and His280) for defluorination reactions and two residues (His109 and His280) for dechlorination reactions. These residues have a strong electrostatic influence on the reaction barrier (−2.0 kcal mol−1 < ΔEi–0 < 2.0 kcal mol−1) and may serve as candidate residues for the following mutation studies. The other residues were found to have relatively weaker electrostatic influence on the reaction barrier.
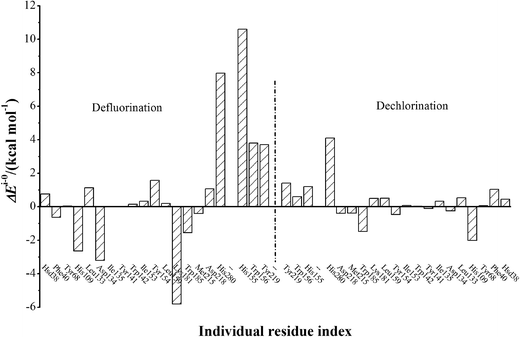 | ||
| Fig. 4 ΔEi–0 values of twenty individual residues toward defluorination and dechlorination processes of FAcD. | ||
4. Conclusions
By analyzing the energy barriers of twenty snapshots and comparing the Boltzmann weighted average barriers, we proved that structure FAcDHse155 is more energetically feasible than structure FAcDHsd155 for enzyme FAcD, whereas FAcDHse155 prefers defluorination rather than dechlorination process. A positive correlation between energy barriers and key structural parameter (angle OεCδX) was found. This may help biomimetic catalyst or de novo enzyme designing in enhancing the C–F or C–Cl bond cleavage. Besides residues Arg111, Arg114, His155, Trp156, and Tyr219, the important role of residues His109, Asp134, Lys181, and His280 during the defluorination process were also highlighted. In addition, we found that conformational variations may cause different enzymatic preferences toward competitive pathways. Thus, studying only one snapshot in distinguishing competitive reaction pathways is not reliable.Acknowledgements
The study was financially supported by NSFC (National Natural Science Foundation of China, project no. 21337001, 21577082, 21507073 and 21177077), SPNSFC (Shandong Provincial Natural Science Foundation, China, project no. ZR2015PB002), FRFSU (Fundamental Research Funds of Shandong University, project no. 2015GN007), and GFGCPSF (General Financial Grant from the China Postdoctoral Science Foundation, project no. 2015M570594).References
- P. Goldman, Science, 1969, 164, 1123–1130 CAS.
- K. Muller, C. Faeh and F. Diederich, Science, 2007, 317, 1881–1886 CrossRef PubMed.
- B. D. Key, R. D. Howell and C. S. Criddle, Environ. Sci. Technol., 1997, 31, 2445–2454 CrossRef CAS.
- C. Douvris and O. V. Ozerov, Science, 2008, 321, 1188–1190 CrossRef CAS PubMed.
- A. M. Calafat, L. Y. Wong, Z. Kuklenyik, J. A. Reidy and L. L. Needham, Environ. Health Perspect., 2007, 115, 1596–1602 CrossRef CAS PubMed.
- M. Houde, J. W. Martin, R. J. Letcher, K. R. Solomon and D. C. Muir, Environ. Sci. Technol., 2006, 40, 3463–3473 CrossRef CAS PubMed.
- X. Zhang, T. Lai and Y. Kong, Top. Curr. Chem., 2012, 308, 365–404 CrossRef CAS PubMed.
- A. T. Proudfoot, S. M. Bradberry and J. A. Vale, Toxicol. Rev., 2006, 25, 213–219 CrossRef CAS PubMed.
- J. Q. Liu, T. Kurihara, S. Ichiyama, M. Miyagi, S. Tsunasawa, H. Kawasaki, K. Soda and N. Esaki, J. Biol. Chem., 1998, 273, 30897–30902 CrossRef CAS PubMed.
- T. Kurihara and N. Esaki, Chem. Rec., 2008, 8, 67–74 CrossRef CAS PubMed.
- T. Kurihara, T. Yamauchi, S. Ichiyama, H. Takahata and N. Esaki, J. Mol. Catal. B: Enzym., 2003, 23, 347–355 CrossRef CAS.
- Y. Zhang, Z. S. Li, J. Y. Wu, M. Sun, Q. C. Zheng and C. C. Sun, Biochem. Biophys. Res. Commun., 2004, 325, 414–420 CrossRef CAS PubMed.
- K. Jitsumori, R. Omi, T. Kurihara, A. Kurata, H. Mihara, I. Miyahara, K. Hirotsu and N. Esaki, J. Bacteriol., 2009, 191, 2630–2637 CrossRef CAS PubMed.
- T. Kamachi, T. Nakayama, O. Shitamichi, K. Jitsumori, T. Kurihara, N. Esaki and K. Yoshizawa, Chem. – Eur. J., 2009, 15, 7394–7403 CrossRef CAS PubMed.
- P. W. Y. Chan, M. Wong, J. Guthrie, A. V. Savchenko, A. F. Yakunin, E. F. Pai and E. A. Edwards, Microb. Biotechnol., 2010, 3, 107–120 CrossRef PubMed.
- P. W. Y. Chan, A. F. Yakunin, E. A. Edwards and E. F. Pai, J. Am. Chem. Soc., 2011, 133, 7461–7468 CrossRef CAS PubMed.
- T. Nakayama, T. Kamachi, K. Jitsumori, R. Omi, K. Hirotsu, N. Esaki, T. Kurihara and K. Yoshizawa, Chem. – Eur. J., 2012, 18, 8392–8402 CrossRef CAS PubMed.
- C. K. Davis, R. I. Webb, L. I. Sly, S. E. Denman and C. S. McSweeney, FEMS Microbiol. Ecol., 2012, 80, 671–684 CrossRef CAS PubMed.
- H. P. Lu, L. Xun and X. S. Xie, Science, 1998, 282, 1877–1882 CrossRef CAS PubMed.
- W. Min, B. P. English, G. Luo, B. J. Cherayil, S. C. Kou and X. S. Xie, Acc. Chem. Res., 2005, 38, 923–931 CrossRef CAS PubMed.
- H. Yang, G. Luo, P. Karnchanaphanurach, T. M. Louie, I. Rech, S. Cova, L. Xun and X. S. Xie, Science, 2003, 302, 262–266 CrossRef CAS PubMed.
- X. S. Xie, Science, 2013, 342, 1457–1459 CrossRef CAS PubMed.
- A. Warshel, P. K. Sharma, M. Kato, Y. Xiang, H. Liu and M. H. Olsson, Chem. Rev., 2006, 106, 3210–3235 CrossRef CAS PubMed.
- H. M. Senn and W. Thiel, Angew. Chem., Int. Ed., 2009, 48, 1198–1229 CrossRef CAS PubMed.
- G. G. Hammes, S. J. Benkovic and S. Hammes-Schiffer, Biochemistry, 2011, 50, 10422–10430 CrossRef CAS PubMed.
- R. Lonsdale, J. N. Harvey and A. J. Mulholland, Chem. Soc. Rev., 2012, 41, 3025–3038 RSC.
- B. R. Brooks, R. E. Bruccoleri, B. D. Olafson, D. J. States, S. Swaminathan and M. Karplus, J. Comput. Chem., 1983, 4, 187–217 CrossRef CAS.
- B. R. Brooks, C. L. Brooks III, A. D. Mackerell, L. Nilsson, R. J. Petrella, B. Roux, Y. Won, G. Archontis, C. Bartels, S. Boresch, A. Caflisch, L. Caves, Q. Cui, A. R. Dinner, M. Feig, S. Fischer, J. Gao, M. Hodoscek, W. Im, K. Kuczera, T. Lazaridis, J. Ma, V. Ovchinnikov, E. Paci, R. W. Pastor, C. B. Post, J. Z. Pu, M. Schaefer, B. Tidor, R. M. Venable, H. L. Woodcock, X. Wu, W. Yang, D. M. York and M. Karplus, J. Comput. Chem., 2009, 30, 1545–1615 CrossRef CAS PubMed.
- A. D. MacKerell, B. Brooks, C. L. Brooks, L. Nilsson, B. Roux, Y. Won and M. Karplus, Encycl. Comput. Chem., John Wiley & Sons, New York, 1998, pp. 271–277 Search PubMed.
- W. L. Jorgensen, J. Chandrasekhar, J. D. Madura, R. W. Impey and M. L. Klein, J. Chem. Phys., 1983, 79, 926–935 CrossRef CAS.
- C. L. Brooks and M. Karplus, J. Chem. Phys., 1983, 79, 6312–6325 CrossRef CAS.
- P. Sherwood, A. H. D. Vries, M. F. Guest, G. Schreckenbach, C. R. A. Catlow, S. A. French, A. A. Sokol, S. T. Bromley, W. Thiel, A. J. Turner, S. Billeter, F. Terstegen, S. Thiel, J. Kendrick, S. C. Rogers, J. Casci, M. Watson, F. King, E. Karlsen, M. Sjovoll, A. Fahmi, A. Schafer and C. Lennartz, J. Mol. Struct.: THEOCHEM, 2003, 632, 1–28 CrossRef CAS.
- R. Ahlrichs, M. Bär, M. Häser, H. Horn and C. Kölmel, Chem. Phys. Lett., 1989, 162, 165–169 CrossRef CAS.
- W. Smith and T. R. Forester, J. Mol. Graphics, 1996, 14, 136–141 CrossRef CAS PubMed.
- A. H. de Vries, P. Sherwood, S. J. Collins, A. M. Rigby, M. Rigutto and G. J. Kramer, J. Phys. Chem. B, 1999, 103, 6133–6141 CrossRef CAS.
- D. Bakowies and W. J. Thiel, J. Phys. Chem., 1996, 100, 10580–10594 CrossRef CAS.
- S. R. Billeter, A. J. Turner and W. Thiel, Phys. Chem. Chem. Phys., 2000, 2, 2177–2186 RSC.
- R. Lonsdale, J. N. Harvey and A. J. Mulholland, J. Phys. Chem. B, 2010, 114, 1156–1162 CrossRef CAS PubMed.
- Y. Li, X. Shi, Q. Zhang, J. Hu, J. Chen and W. Wang, Environ. Sci. Technol., 2014, 48, 5008–5016 CrossRef CAS PubMed.
- Y. Li, R. Zhang, L. Du, Q. Zhang and W. Wang, RSC Adv., 2015, 5, 13871–13877 RSC.
- P. Saura, R. Suardíaz, L. Masgrau, J. M. Lluch and À. González-Lafont, ACS Catal., 2014, 4, 4351–4363 CrossRef CAS.
- M. J. Frisch, G. W. Trucks, H. B. Schlegel, G. E. Scuseria, M. A. Robb, J. R. Cheeseman, G. Scalmani, V. Barone, B. Mennucci, G. A. Petersson, H. Nakatsuji, M. Caricato, X. Li, H. P. Hratchian, A. F. Izmaylov, J. Bloino, G. Zheng, J. L. Sonnenberg, M. Hada, M. Ehara, K. Toyota, R. Fukuda, J. Hasegawa, M. Ishida, T. Nakajima, Y. Honda, O. Kitao, H. Nakai, T. Vreven, J. A. Montgomery Jr., J. E. Peralta, F. Ogliaro, M. Bearpark, J. J. Heyd, E. Brothers, K. N. Kudin, V. N. Staroverov, R. Kobayashi, J. Normand, K. Raghavachari, A. Rendell, J. C. Burant, S. S. Iyengar, J. Tomasi, M. Cossi, N. Rega, J. M. Millam, M. Klene, J. E. Knox, J. B. Cross, V. Bakken, C. Adamo, J. Jaramillo, R. Gomperts, R. E. Stratmann, O. Yazyev, A. J. Austin, R. Cammi, C. Pomelli, J. W. Ochterski, R. L. Martin, K. Morokuma, V. G. Zakrzewski, G. A. Voth, P. Salvador, J. J. Dannenberg, S. Dapprich, A. D. Daniels, O. Farkas, J. B. Foresman, J. V. Ortiz, J. Cioslowski and D. J. Fox, Gaussian 09, revision A.02; Gaussian, Inc., Wallingford, CT, 2009 Search PubMed.
- R. D. Bach, B. A. Coddens and G. J. Wolber, J. Org. Chem., 1986, 51, 1030–1033 CrossRef CAS.
Footnote |
| † Electronic supplementary information (ESI) available: Hydrogen bond distances between FAcD and the substrates (Table S1), NPA charge variations (Table S2), gas phase calculations (Scheme S1); binding of FAc with FAcD (Fig. S1), root-mean-square deviation (Fig. S2), structures involved in dechlorination process of system FAcDHse155–ClAc (Fig. S3), correlation between potential energy barriers and dihedral OωCγCδOε (Fig. S4), and correlation between potential energy barriers and bond OεCδ (Fig. S5). See DOI: 10.1039/c5cy00777a |
| This journal is © The Royal Society of Chemistry 2016 |

