 Open Access Article
Creative Commons Attribution 3.0 Unported Licence
Controlled manipulation of the Co–Alq3 interface by rational design of Alq3 derivatives†
Nicolas
Großmann
a,
Andrea
Magri
b,
Martin
Laux
a,
Benjamin
Stadtmüller
ac,
Philip
Thielen
ac,
Bernhard
Schäfer
b,
Olaf
Fuhr
b,
Mario
Ruben
*bd,
Mirko
Cinchetti
*e and
Martin
Aeschlimann
a
aFachbereich Physik and Research Center OPTIMAS, Technische Universität Kaiserslautern, Erwin-Schrödinger-Str. 46, 67663 Kaiserslautern, Germany
bInstitut für Nanotechnologie, Karlsruher Institut für Technologie, Helmholtz-Platz 1, 76344 Leopoldshafen-Eggenstein, Germany. E-mail: mario.ruben@kit.edu
cGraduate School of Excellence Materials Science in Mainz, Gottlieb-Daimler-Strasse 47, 67663 Kaiserslautern, Germany
dInstitute de Physique et Chimie de Matériaux de Strasbourg (IPCMS), CNRS-Université de Strasbourg, 23, rue du Loess, BP 43, 67034 Strasbourg Cedex 2, France
eExperimentelle Physik VI, Technische Universität Dortmund, 44221 Dortmund, Germany. E-mail: mirko.cinchetti@tu-dortmund.de
First published on 21st October 2016
Abstract
Recently, research has revealed that molecules can be used to steer the local spin properties of ferromagnetic surfaces. One possibility to manipulate ferromagnetic-metal–molecule interfaces in a controlled way is to synthesize specific, non-magnetic molecules to obtain a desired interaction with the ferromagnetic substrate. Here, we have synthesized derivatives of the well-known semiconductor Alq3 (with q = 8-hydroxyquinolinate), in which the 8-hydroxyquinolinate ligands are partially or completely replaced by similar ligands bearing O- or N-donor sets. The goal of this study was to investigate how the presence of (i) different donor atom sets and (ii) aromaticity in different conjugated π-systems influences the spin properties of the metal–molecule interface formed with a Co(100) surface. The spin-dependent metal–molecule-interface properties have been measured by spin-resolved photoemission spectroscopy, backed up by DFT calculations. Overall, our results show that, in the case of the Co–molecule interface, chemical synthesis of organic ligands leads to specific electronic properties of the interface, such as exciton formation or highly spin-polarized interface states. We find that these properties are even additive, i.e. they can be engineered into one single molecular system that incorporates all the relevant ligands.
Introduction
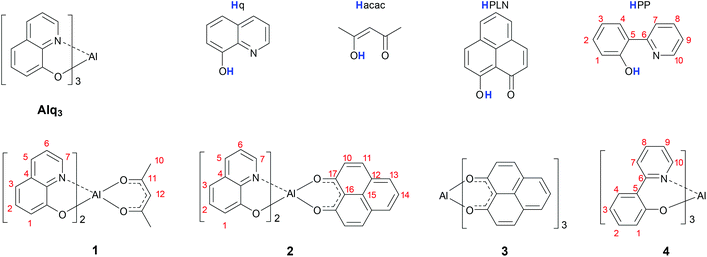
Molecular spintronics benefits of the chemical and physical functionalities of molecules to create unprecedented spintronics devices that exhibit new functionalities and better performances with respect to conventional spintronics components.1,2 A prominent example showing the potential of this approach is the ability to influence the spin properties of the surface of a ferromagnetic material by the hybridization of the surface metal atoms with molecules.3 It is nowadays known that the local magnetic properties of the surface, such as the exchange interaction or the coercive field, depend significantly on the hybridization strength across the metal–molecule interface.4–10 The main goal of this work is to investigate how the spin-properties of hybrid interfaces can be controlled by using molecules with differently extended π-faces that are specifically designed to achieve a desired hybridization strength. In particular, we have taken the well-characterized interface formed by cobalt and tris(quinolin-8-olate)-aluminum (Alq3) as a model system.11–14 To tune the magnetic properties of this interface, the structure of Alq3 was changed by substituting the ligands which coordinate to the central metal atom. The structural formulas of the four Alq3-derivatives 1–4 employed in this study are shown in Scheme 1. These Alq3 derivatives have been deposited by sublimation on the surface of a ferromagnetic cobalt (100) thin film. The formed hybrid systems were analysed by spin-resolved photoemission, to determine the spin-resolved density of states of the molecule–metal interface. By examining the obtained photoemission spectra in terms of spectroscopic signatures of the individual ligands, we have determined the impact of specific ligands on the interfacial electronic structure at the Fermi energy. Overall, our results show that the magnetic and electronic properties near the Fermi energy of the cobalt surface can be specifically influenced by the adsorption of suitable molecules.Experimental
All complexes of this study were synthesized in our laboratories with exception of Alq3, which is commercially available. For the synthesis of coordination complex 1, we have implemented a modified version of the procedure described by Yamaguchi et al.151 is formed with a yield of about 71% by the reaction between one equivalent of Al(CH3)3 and two equivalents of 8-hydroxyquinoline, Hq. Subsequently, the coordination sphere was completed by adding one equivalent of Hacac. Despite the introduction of a symmetric moiety such as 4-oxopent-2-en-2-ol (Hacac), 1 can form two geometrical isomers. In the pseudomer-isomer the two axial nitrogen donor atoms face each other. Conversely, in the pseudofac-isomer the two neighbouring nitrogen atoms face two oxygen atoms. Crystals were grown for single crystal X-ray diffraction measurements. They show that the pseudofac-isomer of 1 is obtained by applying the synthetic procedure.15The novel aluminium complex 2 was obtained from 1 after a substitution reaction of the acac ligand against 1-oxo-1H-phenalen-9-olate (PLN). Complex 2 can also form two isomers: the pseudomer-isomer, where the two nitrogen atoms face each other, and the pseudofac-isomer, where the nitrogen atoms face two oxygen atoms. The solid state molecular structure of 2 was determined by single crystal X-ray diffraction (see Fig. 1 and Tables 1 and 2 for the crystal data and structure refinement) and shows that complex 2 crystallizes in the pseudofac geometry.
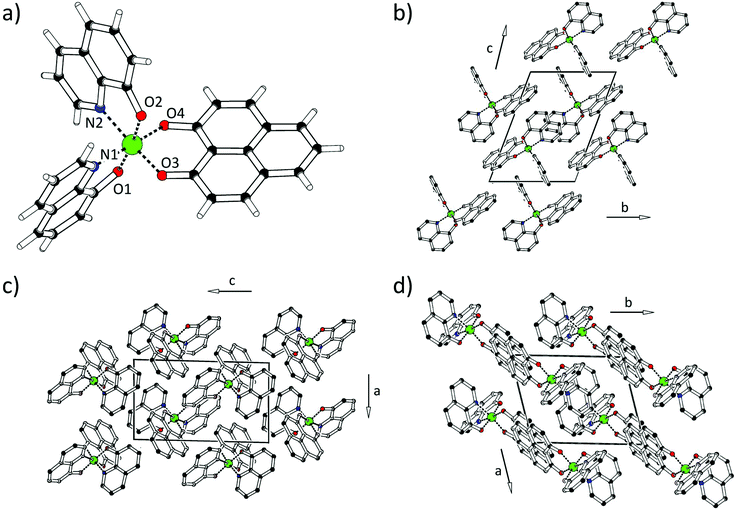 | ||
| Fig. 1 (a) Molecular structure of 2. The molecular packing in the single crystal of 2 is illustrated in (b) a (c) b (d) c direction (the unit cell is shown in black). | ||
| Empirical formula | C31H19N2O4Al |
| Formula weight/g mol−1 | 510.46 |
| Temperature/K | 150 |
| Crystal system | Triclinic |
| Space group |
P![[1 with combining overline]](https://www.rsc.org/images/entities/char_0031_0305.gif) |
| a/Å | 8.1895(17) |
| b/Å | 10.8580(17) |
| c/Å | 14.312(3) |
| α/° | 68.926(13) |
| β/° | 85.576(16) |
| γ/° | 74.327(14) |
| Volume/Å3 | 1143.1(4) |
| Z | 2 |
| ρ calc/mg mm−3 | 1.483 |
| μ/mm−1 | 0.134 |
| F(000) | 528.0 |
| Crystal size/mm3 | 0.07 × 0.05 × 0.01 |
| 2Θ range for data collection | 3.1 to 51.0° |
| Index ranges | −9 ≤ h ≤ 9, −13 ≤ k ≤ 11, −17 ≤ l ≤ 17 |
| Reflections collected | 9349 |
| Independent reflections | 4134 [Rint = 0.1759, Rσ = 0.5785] |
| Data/restraints/parameters | 4134/0/343 |
| Goodness-of-fit on F2 | 0.476 |
| Final R indexes [I ≥ 2σ(I)] | R 1 = 0.0487, wR2 = 0.0610 |
| Final R indexes [all data] | R 1 = 0.3069, wR2 = 0.1153 |
| Largest diff. peak/hole/e Å−3 | 0.19/−0.19 |
| CCDC number | 1493136 |
| Bond | Length [Å] | Bond | Angle [°] | Bond | Angle [°] |
|---|---|---|---|---|---|
| Al1–O1 | 1.844(5) | O1–Al1–O2 | 172.9(3) | O2–Al1–N2 | 81.9(3) |
| Al1–O2 | 1.863(5) | O1–Al1–O3 | 94.7(3) | O3–Al1–O4 | 92.1(3) |
| Al1–O3 | 1.868(6) | O1–Al1–O4 | 91.9(2) | O3–Al1–N1 | 91.2(3) |
| Al1–O4 | 1.861(5) | O1–Al1–N1 | 82.8(3) | O3–Al1–N2 | 172.4(3) |
| Al1–N1 | 2.051(6) | O1–Al1–N2 | 92.6(3) | O4–Al1–N1 | 174.0(3) |
| Al1–N2 | 2.035(7) | O2–Al1–O3 | 90.6(3) | O4–Al1–N2 | 89.7(3) |
| O2–Al1–O4 | 92.6(3) | N1–Al1–N2 | 87.6(3) | ||
| O2–Al1–N1 | 92.4(2) |
Due to a similar bite angle of PLN and acac, pseudofac-2 is characterized by similar bond angles, 81.9–94.7° and 172.4–174.0°, with respect to those of pseudofac-1. Accordingly, the bond distances between the chelating atoms of quinolinate and aluminum, Al–O1 (1.844 Å), Al–O2 (1.863 Å), Al–N1 (2.051 Å), and Al–N2 (2.035 Å), are similar to those of 1 and mer-Alq3. Furthermore, the bond lengths between the oxygens of phenalenyl and aluminum, Al–O3 (1.868 Å) and Al–O4 (1.861 Å), are analogous to those of 3. In the crystal lattice, the molecules of pseudofac-2 are oriented to maximize the interaction between quinolinates and phenalenyls. Interestingly, it can be noted that the quinolinates only face each other as well as the phenalenyl ligands.
The synthesis of molecule 3 was described by Koelsch et al.,16 improved by Haddon et al.,17 and slightly modified by us.18 The ligand 2-(pyridinyl-2-yl)phenol (HPP) was prepared as an “extended” quinolone in a Suzuki cross coupling reaction of 2-hydroxybenzenboronic acid and 2-bromopyridine.
To form complex 4, we reacted HPP with Al(CH3)3, which was formerly used to form complexes with similar ligands.19,20 Since the HPP ligand is asymmetric, 4 can occur in two geometrical isomers, the mer- and the fac-isomer. However, as described for Alq3, and reported for other HPP complexes with trivalent metals,21–23 the mer-isomer is normally formed. Hence, we have assumed that mer-isomer of 4 is the predominant species.
Rational design approach
As is shown in Scheme 1, we have selected three different ligands to substitute the quinolinate ligands in Alq3 with the aim to study the properties of the resulting ferromagnetic metal–molecule interfaces based on these substituted complexes:(i) The ligand 1-oxo-phenalen-9-olate (PLN) contains a sterically demanding aromatic phenalenyl unit and coordinates to the metal with two oxygen atoms. It is known that the wave function of the occupied hybrid states which form at the Co–Alq3 interface close to the Fermi energy are mainly localized on the oxygen donor atoms.12,18 This is why we have chosen this ligand, because it was possible to “chemically” enhance the strength of hybridization with the cobalt surface by coordinating the Al atom only with oxygen donor atoms. We have chosen two complexes, 2 and 3 (Scheme 1), including this PLN ligand in different stoichiometries. Following this strategy, it was possible to investigate the continuous change in ligand stoichiometry from complex 1 over 2 to 3.
(ii) The acac ligand is the sterically less demanding ligand of the whole series. It coordinates to Al with two oxygen donor atoms just like PLN. We synthesized one acac containing complex 1 (Scheme 1). By replacing one q-ligand with an acac-ligand we aimed at “structurally” increasing the hybridization strength between the molecule and the metal surface, since the acac ligand in 1 is less sterically demanding with respect to the q ligand in Alq3.
(iii) 2-(Pyridine-2yl)phenolate (PP) is similar to the quinolinate ligand q, nevertheless the two aromatic rings are not annulated but connected by a C–C single bond. This results in the formation of a six-membered ring upon coordination to the Al(III) ion. We have synthesized compound 4 with the aim to retain the homolepticity of the complex but to change the ligand geometry slightly at the same time.
Experimental results
To understand how the different ligands influence the electronic properties of the complexes and therefore the spin properties of the formed interface, we used photoemission spectroscopy. Our measurements can be differentiated in the following three types (details on the photoemission methods can be found in the Methods section):(i) Ultraviolet photoemission spectroscopy (UPS) measurements (photon energy hv = 21.2 eV) were performed on thick molecular layers (thickness = 4 monolayers, ML). Since UPS is extremely surface sensitive, these measurements provide the electronic properties of the quasi-free molecule and can be thus compared with theoretical DFT calculations of the free molecule.
(ii) Spin-resolved near-threshold photoelectron spectroscopy (NT-PES) measurements (hv = 5.95 eV) were performed on thin molecular layers (thickness 1 ML). NT-PES is interface sensitive.24 In the chosen configuration, it gives information about the electronic properties of the interface.
(iii) Spin-resolved two-photon photoemission (2PPE) spectroscopy measurements (hv = 3.1 eV) were performed on thin molecular layers. These measurements provide information about the occupied as well as the unoccupied electronic states at the interface.25
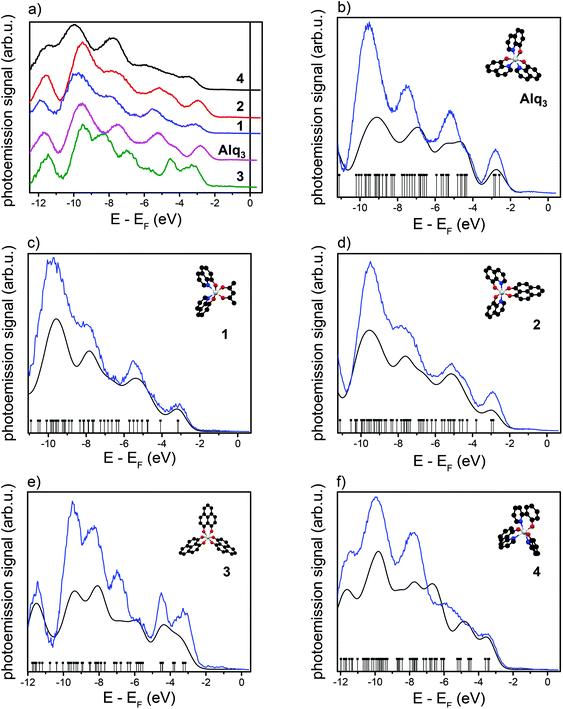
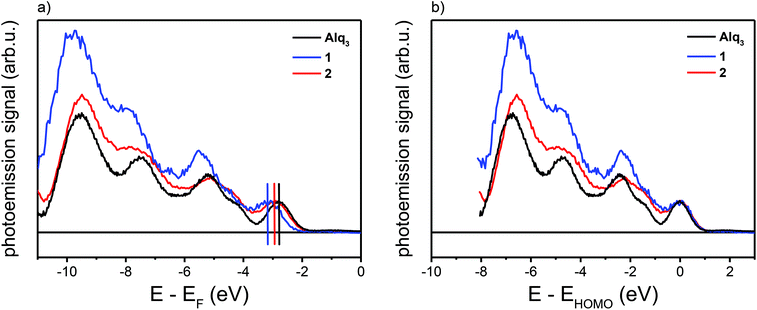
We start with the UPS measurements performed on thick layers, point (i). Since the intermolecular interaction between the molecules is rather weak, the outmost molecules of thick organic film can be assumed as quasi-free molecules. In this case a thick layer means a film thickness of 4 ML which roughly translates to 5–6 nm. Fig. 2(a) shows the UPS measurements of thick layers of all five molecules on the ferromagnetic cobalt surface. The secondary electron background has been removed using the method of Henrich et al.26 The features observed in the background-corrected UPS spectra arise from the occupied molecular orbitals, whose relative energy spacing can be compared to DFT calculations for the free molecules. The results of the DFT calculations are plotted together with the corresponding UPS spectra in Fig. 2(b–f). The DFT eigenvalues have been convoluted with a Gaussian (FWHM = 420 meV) to account for the inhomogeneous peak broadening due to the limited energy resolution in the photoemission experiments. The energy scale of the DFT eigenvalues was chosen by superimposing the HOMO eigenvalues on the HOMO in the UPS spectra. We observe a good agreement between the UPS data and the DFT calculations.
Now, we move to the measurements related to the interface properties, points (ii) and (iii). For both, NT-PES and 2PPE measurements, the interface-related spectra consist of different contributions: the spectral features of the quasi-freestanding molecular layer, the spectral features of the interface, and the photoemission signal of the underlying cobalt substrate, which is damped due to scattering at the organic layer. Furthermore, inelastic scattered electrons produce a secondary electron background.
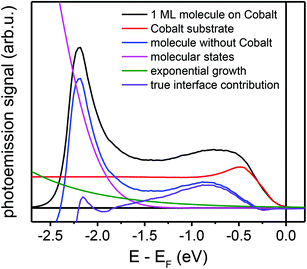
In order to extract the interface-related spectrum from the photoemission data, it is necessary to remove the other spectral contributions beforehand. For UPS spectra, a procedure has been described by Djeghloul et al.27 We had to choose a slightly adapted procedure because the photon energy in our experiments is lower than the one typically used for UPS measurements (5.95 eV vs. 21.2 eV). In particular, as discussed in detail in the Experimental section, we have subtracted a damped cobalt spectrum (to remove the influence of the photoelectrons originating from the cobalt substrate), a spectrum of the quasi-free molecules as inferred from the UPS measurements (to remove the influence of the molecular features), and an exponential decay (to remove the influence of the secondary electron background). Following this procedure, the only remaining part is the photoemission signal from the interface.
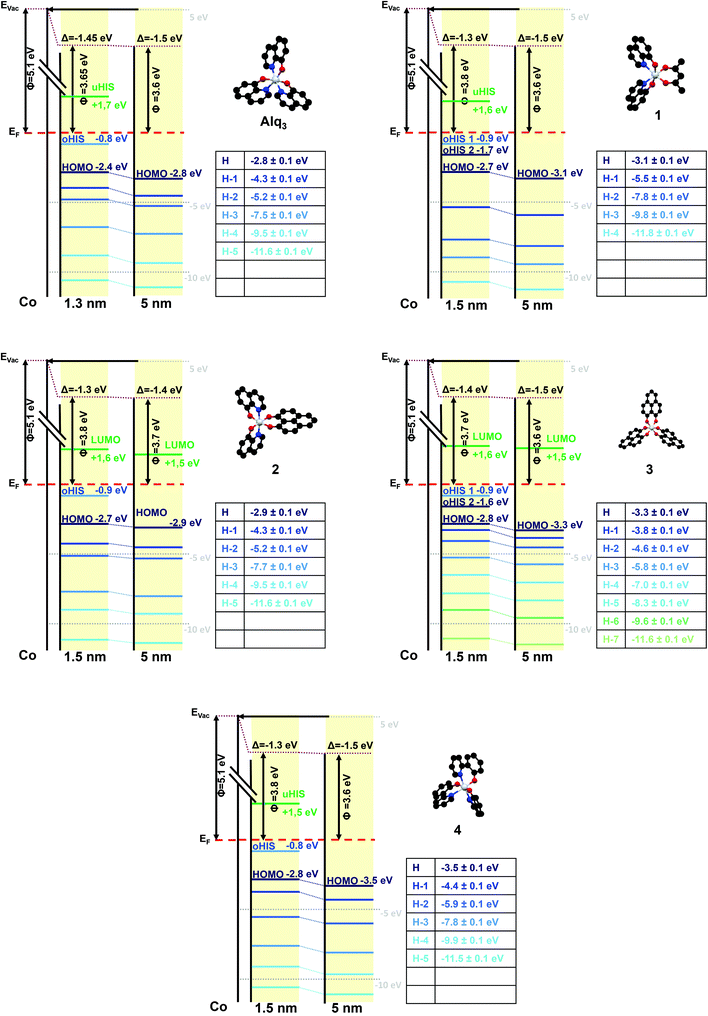
The obtained interface-related spectra are shown in Fig. 3a for occupied states (NT-PES) and Fig. 3b for unoccupied states (2PPE). For all molecules 1–4 as well as for Alq3 an interface contribution is measurable. To verify that the measured signal originates at the interface, NT-PES and 2PPE measurements for thick molecular layers were carried out. For the NT-PES measurements (not shown) the signal at the Fermi level was vanishing, proving that the measured signal of thin layers is indeed a contribution of the interface. This means that all the chosen Alq3-derivatives 1–4 lead to the formation of an occupied hybrid interface state (oHIS) on cobalt, as it was the case for the Co–Alq3 interface. On the other hand, the 2PPE measurements show a vanishing photoemission signal only for the molecules 1 and 4 (not shown), but not for the related molecules containing PLN ligands, where a spectral feature is observable in the 2PPE spectra even at high molecular coverages of 4 ML, Fig. 3c. This shows that, similarly to Alq3 (ref. 11, 14), 1 and 4 lead to the formation of an unoccupied hybrid interface state (uHIS) with the cobalt surface. The 2PPE spectra of 2 and 3, on the other hand, can be explained by assuming a direct optical excitation within the molecule itself, i.e. with the creation of an exciton. Since the exciton is a molecule-related feature (and not an interface-related feature), its fingerprint can be detected in the 2PPE spectra even at high molecular coverage. Combining the information from the UPS, NT-PES and 2PPE spectra, we can draw the energy level alignment of the different Alq3-derivatives on cobalt. The results for all five molecules are shown in Fig. 4.
In order to determine the spin properties of the formed interfaces, we have performed additional spin-resolved NT-PES and 2PPE measurements. After the removal of all unnecessary background contributions the spin polarization of the occupied and unoccupied interface-related states can be extracted. The values of the spin polarization, normalized to the spin polarization of the underlying cobalt substrate, are given in Table 3.
| Molecule | Relative spin polarisation | Error± |
|---|---|---|
| Spin polarization of the occupied hybrid interface states | ||
| Alq3 | 56% | 30% |
| 1 | 79% | 21% |
| 2 | 71% | 18% |
| 3 | 43% | 11% |
| 4 | 62% | 13% |
| Spin polarization of the unoccupied hybrid interface states/LUMOs | ||
| Alq3 | 72% | 20% |
| 1 | 91% | 15% |
| 2 | 33% | 8% |
| 3 | 23% | 11% |
| 4 | 45% | 8% |
Discussion
After the general characterization of the molecules, the results of different molecules have to be compared to draw conclusions on how the modifications of the original Alq3 molecules contribute to different electronic and magnetic features and how such features can systematically be created. Therefore, selected comparisons between the molecules have to be done. In the following, we will concentrate on three parts:- What is the influence of the PLN ligand, studying the series Alq3, 2, and 3?
- Which is the influence of the exchange of one quinoline ligand in Alq3 by acac or PLN with respect to the resulting complexes 1 and 2?
- What changes appear after replacing all q ligands of Alq3 with the slightly larger PP ligands of 4 (retaining the homolepticity)?
The PLN ligand: 2 and 3
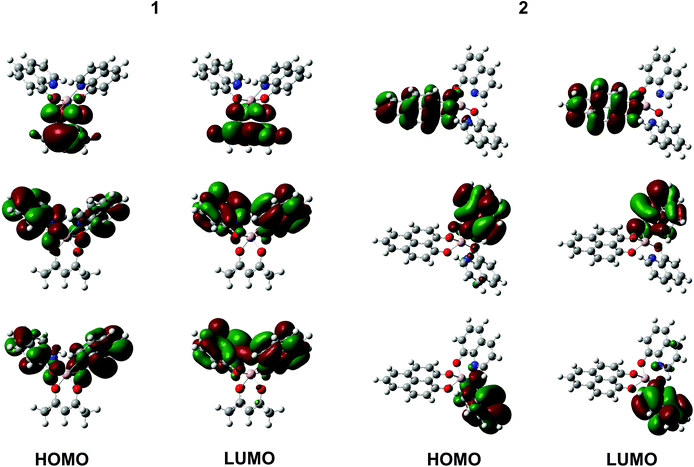
Our DFT calculations show that the HOMOs and LUMOs of Alq3 and 3 are delocalized over almost degenerated orbitals,12,13 while in 2 these orbitals are localized at the three distinct ligands, see the right panel of Fig. 5. The eigenvalues are separated, as for Alq3 and 3, in blocks of three eigenvalues in close energetic proximities. In contrast to the homoleptic molecules, 2's orbitals are localized on the different ligands, which lead to two q-like orbitals and one PLN-like orbital. This leads to the conclusion that 2 contains intrinsically the electronic properties of both other molecules. To confirm this assumption, we used the combined UPS spectra of Alq3 and 3 of thick films to create a hypothetical spectrum of 2. This is shown in Fig. 6. As expected, the electronic structure of the free 2 molecule is composed of the electronic structures of Alq3 and 3. Furthermore, the measured interface data show an unoccupied molecule-related state for the PLN-ligand in contrast to the unoccupied hybrid interface state in Alq3. The energetic position and the information resulting from the spin-resolved measurement lead to the conclusion that, while the Alq3–cobalt-interface only shows an uHIS and the 3–cobalt interface allows the creation of an exciton in the molecular component, in 2 both types of electronic states can be found. By creating a molecule with both kinds of ligands, we have thus been able to create an interface with both properties at once. Regarding the expected increase of hybridization strength at the interface with cobalt when using PLN ligands, a closer inspection of Fig. 3a shows that the interface-related features extend over a much wider energetic range for the 3–cobalt interface as compared to the Alq3–cobalt and 2–cobalt interfaces. The detection of broader interface-related features in the occupied states is a direct evidence for the stronger hybridization mediated by the PLN ligands, as expected at the 3–cobalt interface.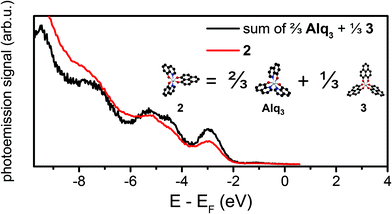 | ||
Fig. 6 UPS spectrum of 4 ML of 2 on cobalt (red line), and “simulation” of the spectrum as superposition of the spectra of Alq3 and 3 with the relative weight 2![[thin space (1/6-em)]](https://www.rsc.org/images/entities/char_2009.gif) : :![[thin space (1/6-em)]](https://www.rsc.org/images/entities/char_2009.gif) 1. 1. | ||
The heteroleptic molecules: 1 and 2
As with 2, the DFT calculations of 1 show a similar distribution of the HOMO and LUMO on either the quinolinate or on the acac ligands, see the left panel of Fig. 5. This leads again to the conclusion that the electronic properties of the acac-ligand are preserved. Fig. 7 (left) shows the UPS measurements of thick layers of Alq3, 1 and 2 on cobalt. Whereas a bigger difference between the spectra of Alq3 and 2 can be seen, only small contributions of the acac-ligand to the photoemission signal are visible. This is more evident in Fig. 7 (right), showing the UPS measurements of these three molecules after shifting the energetic position of the HOMOs to the same value for better comparison. The striking similarity of the photoemission spectra of Alq3 and 1 indicate that the acac-ligands contribute only very slightly to the electronic structure of the free molecule. Also the interface properties of 1 and Alq3 are very similar: the energetic position of the 1–Co oHIS is similar to that of the Alq3–Co oHIS. However, after comparing the relative spin polarisation, it is clearly visible that the amount of spin polarization in the hybrid state is dramatically higher for 1 than for Alq3 (79% vs. 56%). This means that the introduction of the acac ligand does not significantly alter the interface electronic properties. However, due to the less sterically demanding acac ligand in complex 1, the magnetic coupling between 1 and cobalt is stronger, increasing the spin polarization of the occupied hybrid interface state (oHIS), which could be extremely helpful for spintronics applications.The homoleptic molecules: 3 and 4
DFT calculations show that the molecular orbitals of all homoleptics are equally distributed across the whole molecule (not shown), which is in contrast to the localization of the molecular orbitals at single ligands in heteroleptic molecules. UPS, spin-resolved NT-PES and spin-resolved 2PPE measurements for 4 show similar behaviour regarding the electronic and magnetic properties in comparison to Alq3. We thus suggest the use of homoleptic variation of Alq3 in organic spintronics devices, as the orientation of the molecules on the substrate does not play a crucial role and the created devices should be easier to compare with theoretical calculations of the interface properties.Conclusions
We have synthesized derivatives of Alq3, in which the 8-hydroxyquinolinate (q) ligands are replaced by similar ligands bearing O- or N-donor sets. Each synthesized ligand is shown to influence, in a specific way, the spin properties of the interface formed with a ferromagnetic cobalt surface. In particular, by introducing the less sterically demanding acac ligand into 1, we could increase the spin polarization close to the Fermi level, as a result of a stronger magnetic and electronic coupling between the molecules and the cobalt surface. Introducing the PLN ligand in 3, we could strengthen interface hybridization and create a hybrid interface that reacts to optical excitation (at hv = 3.1 eV) forming an exciton. Using complex 2 – that contains both q and PLN ligands – we have shown that the ligand-specific interface properties can be engineered in a single molecule by additive coordination of the corresponding ligands. Our results constitute an important step towards the functionalization of spinterfaces by chemical design of suitable organic adsorbates.Methods
General procedure for the synthesis of molecules
All the reactions were carried out under an inert argon atmosphere using standard Schlenk techniques. All the purchased chemicals and solvents for the synthesis and column chromatography were used as received without any further purification unless otherwise stated. Elemental analysis of carbon, hydrogen, and nitrogen were carried out using a Vario Micro Cube. 1H-NMR and 13C-NMR were recorded using a Bruker FT-NMR Avance III 500 MHz with deuterated solvents as internal standards for proton and carbon signals. Matrix-assisted laser desorption/ionization time of flight (MALDI-TOF) mass spectrometric data were acquired on a MALDI-TOF Synapt G2-S HDMS with no additional matrix compound other than the sample itself. Electro-spray ionization-time of flight (ESI-TOF) mass spectrometric analytical data were acquired on a Bruker microOTOF-Q II equipped with a nano-spray source and on an ESI-TOF Synapt G2-S HDMS. Elemental analyses were carried out on a Vario Micro Cube. Single crystal X-ray diffraction data were collected on a STOE IPDS II diffractometer with graphite-monochromated Mo Kα radiation (0.71073 Å). Structure solution and refinement against F2 were carried out using ShelXS and ShelXL software.28 Refinement was performed with anisotropic temperature factors for all non-hydrogen atoms (disordered atoms were refined isotropically); hydrogen atoms were calculated on idealized positions.Alq3 is commercially available. Although this molecule exhibits two different isomers, meridional and facial, only the meridional isomer is found using our preparation method and measurements at room temperature. The synthesis of 3 was described by Koelsch et al.16 improved by Haddon et al.,17 and slightly modified by us.18
Synthesis of 1
Al(CH3)3 (2 M in toluene, 1.35 ml, 2.7 mmol) was taken in 20 ml of freshly distilled toluene and the resulting solution was cooled to 0 °C. A second solution of Hq (0.78 g, 5.5 mmol) in 10 ml of freshly distilled toluene was added dropwise over 30 min. The solution was warmed up to room temperature and left to stir for 3 h. Hacac (0.28 ml, 2.7 mmol) in 10 ml of freshly distilled toluene was added dropwise over 30 min; the resulting solution was stirred overnight at room temperature. The yellowish precipitate was filtered and washed thoroughly with fresh toluene. The crude product was purified by column chromatography on alumina neutral grade IV with pure CH2Cl2 (0.79 g, yield 71%). Suitable crystals for single crystal X-ray diffraction were obtained from slow evaporation at room temperature of an acetone solution providing the pseudofac isomer.151H-NMR (500 MHz, CD2Cl2, 25 °C, δ (ppm)): 8.52 (dd, 2H, H7), 8.17 (dd, 2H, H5), 7.51 (t, 2H, H2), 7.29–7.25 (m, 2H, H6), 7.10–7.00 (m, 4H, H1, 3), 5.64 (s, 1H, H12), 1.94 (s, 6H, H10). 13C-NMR (125 MHz, CDCl3, 25 °C, δ (ppm)): 192.79 (C11), 191.76 (C9), 159.17 (C1), 144.27 (C8), 139.43 (C3), 139.11 (C4), 131.04 (C6), 129.58 (C2), 121.95 (C5), 112.01 (C7), 101.83 (C12), 27.02 (C10). ESI-TOF MS (Da) m/z (rel. intensity, assigned structure): 415.12 (100%, C23H20O4N2Al calc. = 415.43), 370.12 (12%, C19H21O5NAl calc. = 370.39), 315.07 (12%, C18H12O2N2Al calc. = 315.28), 270.07 (5%, C14H13O3NAl calc. = 270.25). MALDITOF MS (Da) m/z (rel. intensity, assigned structure): 315 (100%, C18H12O2N2Al calc. = 315.28), 270 (22%, C14H13O3NAl calc. = 270.25), 729 (20%, C41H31O6N4Al2 calc. = 729.68), 684 (18%, C37H32O7N3Al2 calc. = 684.65). Elemental analysis found (calc.): C23H19O4N2Al (Al(C23H19O4N2), 414.12 g mol−1): C 65.98 (66.66)%, H 4.38 (4.63)%, N 6.55 (6.76)%.Synthesis of 2
1 (0.71 g, 1.7 mmol) and HPLN (0.30 g, 1.5 mmol) were dissolved in 100 ml on ethanol. The solution was refluxed at 90 °C overnight, cooled down to room temperature and reduced to a volume of 20 ml. The precipitate was filtered, washed with cold fresh ethanol and purified by column chromatography on alumina neutral grade IV with pure CH2Cl2 (0.63 g, yield 73%). Suitable crystals for single crystal X-ray diffraction were obtained from slow evaporation at room temperature of a CH2Cl2/ethanol solution (see Tables 1 and 2 for details on crystal data and structure refinement for 2). 1H-NMR (500 MHz, CD2Cl2, 25 °C, δ (ppm)): 8.68 (d, 2H, H7), 8.23 (d, 2H, H5), 8.09 (d, 2H, H11), 8.04 (d, 2H, H13), 7.58 (t, 1H, H14), 7.50 (t, 2H, H2), 7.34 (m, 2H, H6), 7.06 (m, 4H, H1, 3), 6.96 (d, 2H, H10). ESI-TOF MS (Da) m/z (rel. intensity, assigned structure): 511.11 (100%, C31H20O4N2Al calc. = 511.51), 366.06 (95%, C22H13O3NAl calc. = 366.34). MALDI-TOF MS (Da) m/z (rel. intensity, assigned structure): 417 (100%, C26H14O4Al calc. = 417.38), 366 (40%, C22H13O3NAl calc. = 366.34). Elemental analysis found (calc.): C31H19O4N2Al (Al(C31H19O4N2), 510.48 g mol−1): C 72.17 (72.93)%, H 3.97 (3.76)%, N 5.31 (5.49)%.Synthesis of 4
The ligand 2-(pyridin-2-yl)phenol (HPP) is obtained by a coupling reaction between 2-hydroxybenzenboronic acid and 2-bromopyridine with a yield of ≈68%. To form the aluminum complex, we reacted HPP with Al(CH3)3, which was formerly used to form complexes with similar ligands.19,20 210 ml of a mixture of 4![[thin space (1/6-em)]](https://www.rsc.org/images/entities/char_2009.gif) :
:![[thin space (1/6-em)]](https://www.rsc.org/images/entities/char_2009.gif) 2
2![[thin space (1/6-em)]](https://www.rsc.org/images/entities/char_2009.gif) :
:![[thin space (1/6-em)]](https://www.rsc.org/images/entities/char_2009.gif) 1 toluene/ethanol/K2CO3 (2 M in H2O) was prepared and 2-bromopyridine (3.0 ml, 31.0 mmol) and 2-hydroxybenzenboronic acid (4.14 g, 30.0 mmol) were dissolved in it. The mixture was bubbled with Ar for 1 h and then Pd(PPh3)4 (0.71 g, 0.63 mmol) was added. The reaction was refluxed overnight at 80 °C. The resulting solution was cooled down and extracted with ethyl acetate; the organics were collected and the solvents were evaporated under reduced pressure. The crude product was purified by column chromatography on silica gel with pure CH2Cl2 (3.48 g, yield 68%). 1H-NMR (HPP, 500 MHz, CDCl3, 25 °C, δ (ppm)): 14.36 (s, 1H, OH), 8.42 (dd, 1H, H4), 7.81 (d, 1H, H10), 7.76–7.70 (m, 2H, H1, 8), 7.32 (dt, 1H, H2), 7.14 (dt, 1H, H3), 7.10 (dd, 1H, H7), 6.90 (dt, 1H, H9). 13C-NMR (125 MHz, CDCl3, 25 °C, δ (ppm)): 159.96 (C11), 157.63 (C6), 145.61 171 (C10), 137.66 (C8), 131.38 (C4), 126.10 (C2), 121.42 (C5), 118.92 (C9), 118.72 (C3), 118.70 (C7), 118.47 (C1). HPP (3.48 g, 4.0 mmol) was dissolved in 50 ml of freshly distilled THF; the solution was cooled to −78 °C and Al(CH3)3 (2 M in toluene) was slowly added (0.61 ml, 1.2 mmol). The reaction mixture was warmed up to room temperature and left to stir over five days. The white precipitate was filtered, washed thoroughly with fresh THF and dried under vacuum (0.47 g, yield 73%). ESI-TOF MS (Da) m/z (rel. intensity, assigned structure): 367.08 (100%, C22H16O2N2Al calc. = 367.36). MALDI-TOF MS (Da) m/z (rel. intensity, assigned structure): 367 (100%, C22H16O2N2Al calc. = 367.36). Elemental analysis found (calc.): C33H30O6N3Al (Al(C33H24O3N3)·3H2O, 591.19 g mol−1): C 67.48 (67.00)%, H 4.59 (5.12)%, N 7.13 (7.10)%.
1 toluene/ethanol/K2CO3 (2 M in H2O) was prepared and 2-bromopyridine (3.0 ml, 31.0 mmol) and 2-hydroxybenzenboronic acid (4.14 g, 30.0 mmol) were dissolved in it. The mixture was bubbled with Ar for 1 h and then Pd(PPh3)4 (0.71 g, 0.63 mmol) was added. The reaction was refluxed overnight at 80 °C. The resulting solution was cooled down and extracted with ethyl acetate; the organics were collected and the solvents were evaporated under reduced pressure. The crude product was purified by column chromatography on silica gel with pure CH2Cl2 (3.48 g, yield 68%). 1H-NMR (HPP, 500 MHz, CDCl3, 25 °C, δ (ppm)): 14.36 (s, 1H, OH), 8.42 (dd, 1H, H4), 7.81 (d, 1H, H10), 7.76–7.70 (m, 2H, H1, 8), 7.32 (dt, 1H, H2), 7.14 (dt, 1H, H3), 7.10 (dd, 1H, H7), 6.90 (dt, 1H, H9). 13C-NMR (125 MHz, CDCl3, 25 °C, δ (ppm)): 159.96 (C11), 157.63 (C6), 145.61 171 (C10), 137.66 (C8), 131.38 (C4), 126.10 (C2), 121.42 (C5), 118.92 (C9), 118.72 (C3), 118.70 (C7), 118.47 (C1). HPP (3.48 g, 4.0 mmol) was dissolved in 50 ml of freshly distilled THF; the solution was cooled to −78 °C and Al(CH3)3 (2 M in toluene) was slowly added (0.61 ml, 1.2 mmol). The reaction mixture was warmed up to room temperature and left to stir over five days. The white precipitate was filtered, washed thoroughly with fresh THF and dried under vacuum (0.47 g, yield 73%). ESI-TOF MS (Da) m/z (rel. intensity, assigned structure): 367.08 (100%, C22H16O2N2Al calc. = 367.36). MALDI-TOF MS (Da) m/z (rel. intensity, assigned structure): 367 (100%, C22H16O2N2Al calc. = 367.36). Elemental analysis found (calc.): C33H30O6N3Al (Al(C33H24O3N3)·3H2O, 591.19 g mol−1): C 67.48 (67.00)%, H 4.59 (5.12)%, N 7.13 (7.10)%.
X-Ray structure analysis
Data collection for compound 2 was carried out on a STOE StadiVari diffractometer with monochromated Mo Kα radiation (λ = 0.71073 Å) at 150.2 K. Using Olex2,28 the structure was solved with the ShelXD29 structure solution program using the Dual Space method and refined with the ShelXL29 refinement package using least squares minimization. Non-hydrogen atoms were refined with anisotropic displacement parameters; H atoms were added at idealized positions on their respective parent atoms. Crystal data, refinement parameters and selected bond lengths and angles are given in Tables 1 and 2. CCDC-1493136 contains the crystallographic data for this compound.DFT
To calculate the molecular orbitals of the different molecules DFT calculations were carried out. The commercially available software Gaussian 09 was used and we chose 6-31G(d) as a basis set and B3LYP as the exchange interaction functional.30Calculation of interface-related spectra
The NT-PES and 2PPE spectra contain four distinct contributions, namely: (i) the contribution of the cobalt substrate, damped due to scattering at the molecules; (ii) the contribution from the interface, that we want to isolate; (iii) the contribution from molecules far away from the interface; and (iv) the contribution from secondary electrons. To obtain the true signal of the interface, contributions (i), (iii) and (iv) have to be removed systematically. To eliminate the cobalt signal, (i), the spectrum of the pristine cobalt film was scaled to fit the cobalt-related intensity in the spectra close to the Fermi edge. To calculate contribution (iii), we estimated the energetic position and the width of the HOMO spectral feature from the UPS measurements. Finally, the secondary electron background (iv) was modelled by an exponential function. After subtraction of these three contributions, the photoemission signal gives directly the interface-related contribution, as illustrated in Fig. 8 for the NT-PES spectra of 1 ML Alq3 on cobalt.Spectroscopic measurements
All spectroscopic measurements were performed with an UHV system consisting of a spectroscopic chamber and two separated evaporation chambers (for metal and for the organic molecules). The base pressure in the spectroscopic chamber was 4 × 10⁻¹¹ mbar and 5 × 10⁻¹⁰ mbar in the evaporation chambers. During evaporation the pressure rises to 9 × 10⁻¹⁰ mbar (metal) and 3 × 10⁻⁹ mbar (organic). To obtain the photoemission spectra different light systems were used. UPS was performed by using a HIS 13 vacuum ultraviolet lamp (OMICRON) in combination with helium. Since the Helium I alpha line was used, the available photon energy was 21.2 eV. For NT-PES and 2PPE a Ti:sapphire laser system was used. The central wavelength is between 780 nm and 840 nm. This was doubled (for 2PPE measurements) to 2.95 eV–3.2 eV or quadrupled (for NT-PES measurements) to 5.95 eV.Sample preparation: cobalt
The cobalt film with a thickness of around 3.5 nm was grown by electron beam evaporation on a copper (100) single crystal and then annealed to 370 K. The resulting cobalt film possesses a tetragonal distorted fcc structure with an in-plane magnetic uniaxial anisotropy along the (110) direction of the copper substrate.31Characterization of the formed spinterfaces
All the molecular compounds were sublimated as a purification step after synthesis before the preparation of the spinterface. After purification, we have confirmed the intactness of the heteroleptic complexes with respect to their thermal stability by 1H NMR spectroscopy (see the ESI, Fig. 12†).The purified compounds were then deposited on the freshly prepared cobalt surface with a Knudsen cell from Kentax GmbH at a pressure of 9 × 10⁻¹⁰ mbar. The deposition rates were monitored by a quartz crystal balance calibrated with ellipsometry. We have recorded UPS spectra from 1 ML of all compounds and compared them to the UPS spectra of thicker films (see the ESI, Fig. 13†). As the spectra are virtually identical, and can be reproduced using the eigenvalues of the DFT calculations of the free molecules, we conclude that both the molecules in direct contact with the cobalt substrate as well as the molecules far away from the cobalt surface remain intact after deposition.
Acknowledgements
We acknowledge support from the Deutsche Forschungsgemeinschaft (DFG, TRR 88, “3MET”, project C5) and the Karlsruhe Nano Micro Facility (KNMF, http://www.knmf.kit.edu). The experimental work carried out at the University of Kaiserslautern was partly funded by the SFB/TRR 173 Spin+X: spin in its collective environment (Project B05) from the DFG. P. T. and B. St. thankfully acknowledge financial support from the Graduate School of Excellence MAINZ (Excellence Initiative DFG/GSC 266).Notes and references
- J. S. Moodera, B. Koopmans and P. M. Oppeneer, MRS Bull., 2014, 39, 578–581 CrossRef CAS.
- K. V. Raman, Appl. Phys. Rev., 2014, 1, 031101 Search PubMed.
- S. Jakobs, A. Narayan, B. Stadtmüller, A. Droghetti, I. Rungger, Y. S. Hor, S. Klyatskaya, D. Jungkenn, J. Stöckl, M. Laux, O. L. A. Monti, M. Aeschlimann, R. J. Cava, M. Ruben, S. Mathias, S. Sanvito and M. Cinchetti, Nano Lett., 2015, 15, 6022–6029 CrossRef CAS PubMed.
- N. Atodiresei, J. Brede, P. Lazić, V. Caciuc, G. Hoffmann, R. Wiesendanger and S. Blügel, Phys. Rev. Lett., 2010, 105, 066601 CrossRef PubMed.
- J. Brede, N. Atodiresei, V. Caciuc, M. Bazarnik, A. Al-Zubi, S. Blügel and R. Wiesendanger, Nat. Nanotechnol., 2014, 9, 1018–1023 CrossRef CAS PubMed.
- M. Cinchetti, Nat. Nanotechnol., 2014, 9, 965–966 CrossRef CAS PubMed.
- K. V. Raman, A. M. Kamerbeek, A. Mukherjee, N. Atodiresei, T. K. Sen, P. Lazić, V. Caciuc, R. Michel, D. Stalke, S. K. Mandal, S. Blügel, M. Münzenberg and J. S. Moodera, Nature, 2013, 493, 509–513 CrossRef CAS PubMed.
- F. A. Ma'Mari, T. Moorsom, G. Teobaldi, W. Deacon, T. Prokscha, H. Luetkens, S. Lee, G. E. Sterbinsky, D. A. Arena, D. A. MacLaren, M. Flokstra, M. Ali, M. C. Wheeler, G. Burnell, B. J. Hickey and O. Cespedes, Nature, 2015, 524, 69–73 CrossRef PubMed.
- C. Barraud, K. Bouzehouane, C. Deranlot, S. Fusil, H. Jabbar, J. Arabski, R. Rakshit, D.-J. Kim, C. Kieber, S. Boukari, M. Bowen, E. Beaurepaire, P. Seneor, R. Mattana and F. Petroff, Phys. Rev. Lett., 2015, 114, 206603 CrossRef PubMed.
- J. Schwöbel, Y. Fu, J. Brede, A. Dilullo, G. Hoffmann, S. Klyatskaya, M. Ruben and R. Wiesendanger, Nat. Commun., 2012, 3, 953 CrossRef PubMed.
- S. Steil, N. Großmann, M. Laux, A. Ruffing, D. Steil, M. Wiesenmayer, S. Mathias, O. L. A. Monti, M. Cinchetti and M. Aeschlimann, Nat. Phys., 2013, 9, 242–247 CrossRef CAS.
- A. Droghetti, S. Steil, N. Großmann, N. Haag, H. Zhang, M. Willis, W. P. Gillin, A. J. Drew, M. Aeschlimann, S. Sanvito and M. Cinchetti, Phys. Rev. B: Condens. Matter, 2014, 89, 094412 CrossRef.
- A. Droghetti, M. Cinchetti and S. Sanvito, Phys. Rev. B: Condens. Matter, 2014, 89, 245137 CrossRef.
- A. Droghetti, P. Thielen, I. Rungger, N. Haag, N. Großmann, J. Stöckl, B. Stadtmüller, M. Aeschlimann, S. Sanvito and M. Cinchetti, Nat. Commun., 2016, 7, 12668 CrossRef CAS PubMed.
- I. Yamaguchi, T. Iijima and T. Yamamoto, J. Organomet. Chem., 2002, 654, 229–232 CrossRef CAS.
- C. F. Koelsch and J. A. Anthes, J. Org. Chem., 1941, 06, 558–565 CrossRef CAS.
- R. C. Haddon, R. Rayford and A. M. Hirani, J. Org. Chem., 1981, 46, 4587–4588 CrossRef CAS.
- S. Müller, S. Steil, A. Droghetti, N. Großmann, V. Meded, A. Magri, B. Schäfer, O. Fuhr, S. Sanvito, M. Ruben, M. Cinchetti and M. Aeschlimann, New J. Phys., 2013, 15, 113054 CrossRef.
- S.-F. Liu, C. Seward, H. Aziz, N.-X. Hu, Z. Popović and S. Wang, Organometallics, 2000, 19, 5709–5714 CrossRef CAS.
- R. Kwong, Y. Tung, B. Ma and D. Knowles, US Patent2005/0019605A1, 2005 Search PubMed.
- P. Ganis, A. Saporito, A. Vitagliano and G. Valle, Inorg. Chim. Acta, 1988, 142, 75–79 CrossRef CAS.
- D. A. Bardwell, D. Black, J. C. Jeffery, E. Schatz and M. D. Ward, J. Chem. Soc., Dalton Trans., 1993, 2321–2327 RSC.
- D. A. Bardwell, J. C. Jeffery and M. D. Ward, Inorg. Chim. Acta, 1995, 236, 125–130 CrossRef CAS.
- R. Fetzer, B. Stadtmüller, Y. Ohdaira, H. Naganuma, M. Oogane, Y. Ando, T. Taira, T. Uemura, M. Yamamoto, M. Aeschlimann and M. Cinchetti, Sci. Rep., 2015, 5, 8537 CrossRef CAS PubMed.
- M. Cinchetti, S. Neuschwander, A. Fischer, A. Ruffing, S. Mathias, J.-P. Wüstenberg and M. Aeschlimann, Phys. Rev. Lett., 2010, 104, 217602 CrossRef PubMed.
- X. Li, Z. Zhang and V. E. Henrich, J. Electron Spectrosc. Relat. Phenom., 1993, 63, 253–265 CrossRef CAS.
- F. Djeghloul, F. Ibrahim, M. Cantoni, M. Bowen, L. Joly, S. Boukari, P. Ohresser, F. Bertran, P. Le Fèvre, P. Thakur, F. Scheurer, T. Miyamachi, R. Mattana, P. Seneor, A. Jaafar, C. Rinaldi, S. Javaid, J. Arabski, J.-P. Kappler, W. Wulfhekel, N. B. Brookes, R. Bertacco, A. Taleb-Ibrahimi, M. Alouani, E. Beaurepaire and W. Weber, Sci. Rep., 2013, 3, 1272 CAS.
- O. V. Dolomanov, L. J. Bourhis, R. J. Gildea, J. A. K. Howard and H. Puschmann, J. Appl. Crystallogr., 2009, 42, 339–341 CrossRef CAS.
- G. M. Sheldrick, Acta Crystallogr., Sect. A: Fundam. Crystallogr., 2008, 64, 112–122 CrossRef CAS PubMed.
- M. J. Frisch, G. W. Trucks, H. B. Schlegel, G. E. Scuseria, M. A. Robb, J. R. Cheeseman, G. Scalmani, V. Barone, B. Mennucci, G. A. Petersson, H. Nakatsuji, M. Caricato, X. Li, H. P. Hratchian, A. F. Izmaylov, J. Bloino, G. Zheng, J. L. Sonnenberg, M. Hada, M. Ehara, K. Toyota, R. Fukuda, J. Hasegawa, M. Ishida, T. Nakajima, Y. Honda, O. Kitao, H. Nakai, T. Vreven, J. A. Montgomery Jr., J. E. Peralta, F. Ogliaro, M. J. Bearpark, J. Heyd, E. N. Brothers, K. N. Kudin, V. N. Staroverov, R. Kobayashi, J. Normand, K. Raghavachari, A. P. Rendell, J. C. Burant, S. S. Iyengar, J. Tomasi, M. Cossi, N. Rega, N. J. Millam, M. Klene, J. E. Knox, J. B. Cross, V. Bakken, C. Adamo, J. Jaramillo, R. Gomperts, R. E. Stratmann, O. Yazyev, A. J. Austin, R. Cammi, C. Pomelli, J. W. Ochterski, R. L. Martin, K. Morokuma, V. G. Zakrzewski, G. A. Voth, P. Salvador, J. J. Dannenberg, S. Dapprich, A. D. Daniels, Ö. Farkas, J. B. Foresman, J. V. Ortiz, J. Cioslowski and D. J. Fox, Gaussian 09, Gaussian, Inc., Wallingford, CT, USA, 2009 Search PubMed.
- O. Andreyev, Y. M. Koroteev, M. Sánchez Albaneda, M. Cinchetti, G. Bihlmayer, E. V. Chulkov, J. Lange, F. Steeb, M. Bauer, P. M. Echenique, S. Blügel and M. Aeschlimann, Phys. Rev. B: Condens. Matter, 2006, 74, 195416 CrossRef.
Footnote |
| † Electronic supplementary information (ESI) available: NMR data, mass spectra and X-ray diffraction parameter CCDC 1493136. For ESI and crystallographic data in CIF or other electronic format see DOI: 10.1039/c6dt03183h |
| This journal is © The Royal Society of Chemistry 2016 |

