Affordable, flexible, and modular: a guide to open-source membrane-based water treatment systems†
Adam
Slade
and
David
Jassby
*
Department of Chemical and Environmental Engineering, University of California – Riverside, Riverside, CA 92521, USA. E-mail: djassby@engr.ucr.edu
First published on 3rd October 2016
Abstract
Membrane-based water treatment processes often require sophisticated control and monitoring that is not possible through manual operation. Automated regulation of pressure or flux through a membrane is required to minimize membrane fouling, thus maximizing efficiency and lifespan. Myriad automation tools exist, ranging from single purpose-built solutions to numerous linked sensors and hardware controls, all analyzed and controlled though commercially-available proprietary hardware and software. This paper outlines a way to design control systems for membrane-based filtration that utilize open source hardware and software, increasing the flexibility of a system to changing performance requirements while simultaneously minimizing the expense in time and resources to implement the control scheme. The method presented here can reduce the capital requirement for system control by one to two orders of magnitude while enhancing flexibility for system expansion and process sharing.
Water impactBy providing a detailed tutorial on how open-source and open-access hardware and software tools can be combined to build reliable, flexible and scalable control systems, users can construct these systems at a fraction of the cost of commercial control products, while allowing for the customization of membrane-based water treatment technologies. |
1. Introduction
Membrane-based water treatment technologies are becoming increasingly common across multiple sectors including seawater desalination, wastewater recycling, and drinking water treatment.1,2 These applications range from large, utility-scale installations, to small point-of-use systems.3,4 Due to their widespread appeal, many research groups are dedicated to the development and testing of all aspects of the membrane treatment process, with research activities ranging from membrane material development to integrated system testing. Ultimately, whenever a new membrane material or membrane system component needs to be tested, it must be integrated into a process whereby a feed stream is introduced onto one side of the membrane (either in a cross-flow or dead-end configuration), and the permeate is collected. Membrane-based water treatment processes often require precise control of multiple system parameters, such as the trans-membrane flux and/or pressure, to optimize membrane efficiency and lifespan.5–7 Furthermore, membrane filtration (ultrafiltration (UF) and microfiltration (MF)) benefits from periodic changes in flow (such as backwashing) to restore degraded membrane performance due to fouling; the same holds true for reverse osmosis (RO) and nanofiltration (NF) processes, where membrane fouling was reversed through a process of osmotic backwashing.8–11 In addition to these physical cleaning methods, membrane systems periodically require chemical cleaning processes.12–14 These cleaning events require careful control of flow and pressure conditions, as well as control of different chemical additives. At the commercial scale, these changes to the flow regime in the membrane module are accomplished by automatic control software and hardware.Commercial membrane systems are designed to generate a specific flowrate of treated water, e.g. to meet the drinking water demand of a city.15 To accomplish this, these systems are equipped with sophisticated control systems and algorithms that are designed to ensure the water supply remains between very strict boundaries.16 Thus, these systems may respond to a drop in flux (from fouling) by increasing the system pressure (either by increasing pump speed or through a valve), which will keep the flux steady; this is known as operating in a constant-flux mode.15,17 Once the pressure exceeds a pre-set level, these automated systems can trigger cleaning operations (e.g. initiate backflushing and/or chemical cleaning).16 Because of the complexity of control systems and algorithms, most lab-scale membrane systems are operated under highly simplified conditions. The main simplification that researchers use is to operate the membrane in a constant-pressure mode; in this mode, a constant pressure is applied, and as the membrane fouls, its flux declines.17 The main limitation of this approach is that as the flux declines, the driving force for membrane fouling (i.e. the flux) decreases as well, which limits the findings of these studied, making it difficult to implement their findings in commercial systems.17,18 Another limitation of constant-pressure systems are the low flows generated after the membrane is fouled, which can make measurements difficult.19 In addition, these non-automated systems have difficulties in modeling long-term operations, as they require a manual response to events such as cleaning, again limiting their ability to simulate real-world conditions. A simple, reliable, flexible, and affordable membrane control system would enable researchers (and small point-of-use system developers) to build systems that more closely represent commercial systems, making their experimental findings more representative to conditions in the real world.
At the industrial scale, membrane processes are controlled via proprietary hardware and software utilizing programmable logic controllers (PLCs). These PLCs have the advantage of high reliability and simplicity in programming, although come at a relatively high cost. Furthermore, the proprietary nature of these controllers require commitment to a single manufacturer's ecosystem for both hardware and software programming, limiting the flexibility of design. While these costs are acceptable within industry where capital commitments and setup time are a small percentage of the overall operation, these costs are magnified in research applications where system requirements can rapidly change, as well as in smaller systems treating limited volumes. The high cost associated with proprietary PLC-controlled systems has forced many membrane research efforts to rely on overly simplified approaches when testing membrane performance, e.g., by using constant pressure, rather than constant flux, when evaluating membrane systems. Furthermore, in academia a researcher following in the footsteps of another who has used PLC-based control systems cannot reuse code and hardware setup without first investing the money and time to acquire and learn a proprietary system.
This project intends to rectify the problem of relying on expensive, proprietary hardware and software for membrane process control, by utilizing open-source hardware and software to achieve system monitoring and control. The control hardware and software from this project are to be openly shared. Because many membranologists are not highly trained in programming and electronics, this paper provides a detailed guide that when followed, will allow users to construct highly sophisticated membrane control and monitoring systems that can be tailored for specific applications. This project will enable a researcher (or small-scale user) to easily reproduce the membrane control system outlined here using a variety of hardware of their own design while reusing and adapting the same open-source software and hardware concepts described in this paper.
2. Material and methods
For this project, the ubiquitous open source hardware Arduino was used alongside a variety of easily-procured generic sensors and electronics. The control algorithms may be embedded in the Arduino hardware using the open source Arduino integrated development environment (IDE) software. While this is presented here as an option, we also provide a more comprehensive user-friendly experience for the end-user by describing a Windows-based software suite created using the freely-distributed .NET programming environment provided in Microsoft Visual Studio.2.1 Hardware
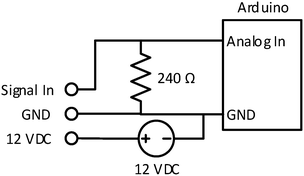
Two membrane-control systems were created in this project. The first requires only two sensor inputs (one analog and one digital) and ten control outputs (six digital and four pulse width modulation (PWM)), while the second requires seven inputs (three analog and three digital) and nine outputs (seven digital and two PWM). The two projects utilized an Arduino Nano and Arduino Mega 2560, respectively. The principle difference between the two control boards is in their number of inputs and outputs. Both control boards require regulated 5 VDC as a power source. Both boards are capable of accepting 5 VDC from a USB power source, or can internally regulate a 6–20 VDC power supply. Note that in contrast to a typical PLC, the Arduino is designed to only output signals, and is incapable of producing enough current to directly power anything but the weakest of motors or electromechanical relays. This necessitates the addition of additional electronics to convert the Arduino control signal to hardware actuation. In addition, the Arduino is only designed to accept 0–5 VDC analog inputs, or 0/5 VDC digital inputs. Any other range or types of input signals will require signal conditioning before they can be interpreted by the Arduino controller.The various hardware used for the two projects are further outlined below, along with the required signal conditioning or hardware actuation. Other types of hardware or sensors may be used with the Arduino microcontrollers provided the signals sent or received are properly conditioned.
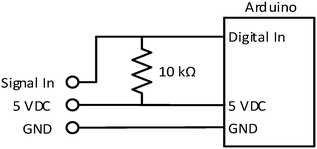
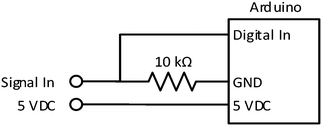
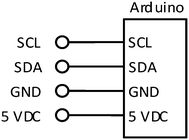
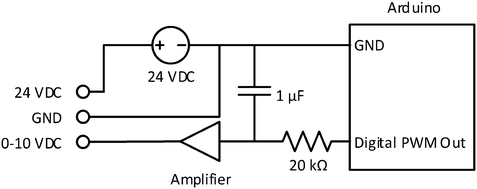
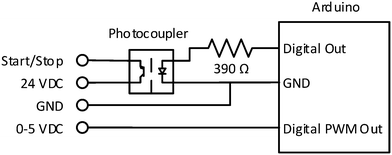
Understanding and connecting the proceeding circuits can be aided through the use of the information presented in the ESI† (Appendix B).
The Arduino controllers have 10-bit analog-to-digital converters (ADC), and as such map a 0–5 VDC input to a number between 0 and 1023 (this is how the voltage value is translated to a digital signal). As the pressure transducers will give signals from 0 to 4.8 VDC, the range reported by the Arduino will be 0 to 982.
When a flowrate request is received by the Arduino, the Arduino listens for a period of time for the digital signal on the flowmeter port. The frequency at which the signal changes from high (5 VDC) to low (0 VDC) corresponds to the flowrate, and is reported as the number of pulses per second.
This particular circuit is further detailed in the ESI† (Appendix B).
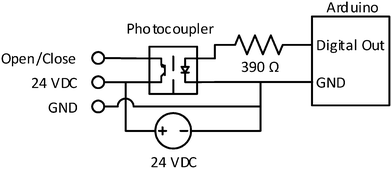
When valve actuation is required, the Arduino provides a 5 VDC signal to the photocoupler, which then allows current to pass from the 24 VDC power source to the valve, causing the valve to open/close.
2.2 Embedded software
The Arduino hardware can have control algorithms embedded within its flash memory. This allows the Arduino to do anything from read the state of a digital pin to perform complicated data analysis. In order to minimize the time it takes for the Arduino to perform critical operations (sensor reading and hardware actuation) all processing is offloaded onto a PC via a USB serial connection. The Arduino is set up to accept commands via the USB interface, and to respond with the appropriate action or requested sensor data. The entire Arduino sketch is contained in the ESI† (Appendix A).The “loop” function will continuously listen for commands (4 bytes) coming from the USB communication port, and if detected, will execute the requested command. Once the request is complete, the function sends the requested sensor value, or confirmation of hardware actuation back to the PC. If the incoming data is invalid, the Arduino discards the data. The loop function code can be found in the ESI† (section A.3).
The first byte of the incoming data is the command – a number from 1 to 6 which indicates what the Arduino will be doing. This includes those functions outlined in section 2.2.2. The second byte is the pin ID (0 to 53) on which the Arduino will be executing the command. The third byte is any pertinent data for the command, such as PWM value. The final byte is the PC-calculated checksum. This value is computed using the preceding three bytes, and is used to ensure valid data transmission. The Arduino calculates the checksum using the same algorithm as the PC, and compares it to the received checksum value for validation (see ESI,† section A.4).
The digital input command is used to return the state of a particular pin on the Arduino board. This command simply will return a 1 if the pin is high (≥3 VDC), and a 0 if the pin is low (<3 VDC). The digital output command is used to turn a hardware control on or off. If the command data is 1, it makes the selected pin output a high voltage (5 VDC). If the command data is 0, it makes the selected pin output a low voltage (0 VDC). This command returns the command data as confirmation of completion.
Analog inputs are repeated the requested number of times, as defined through the data byte. This allows the Arduino to quickly take a number of analog readings and return the average value. Analog outputs are performed using PWM. The duty cycle of the PWM is defined in the data byte as a value out of a possible 255. This command sets the pin and returns the PWM value, as confirmation of completion.
![[thin space (1/6-em)]](https://www.rsc.org/images/entities/char_2009.gif) 535. The code is contained in section A.6 of the ESI.†
535. The code is contained in section A.6 of the ESI.†
![[thin space (1/6-em)]](https://www.rsc.org/images/entities/char_2009.gif) 535, since a single byte would not be sufficient.
535, since a single byte would not be sufficient.
The PC will wait until it has received confirmation from the Arduino that the previous command has been executed before issuing another command. If a sufficient amount of time has elapsed without a response from the Arduino, the PC reissues the command until it receives successful confirmation.
The Arduino receives commands from the PC, but receives no information from the PC on the PC's current state. If, for example, the PC were to crash or be disconnected from the Arduino, the Arduino would never know. This condition could lead to adverse outcomes, such as exceeding the maximum pressure in a membrane system, causing catastrophic failure and extensive damage. To avoid this condition, after initially establishing communication with the Arduino, the PC will send regular pings to the Arduino if it becomes idle, thus continuously communicating with the Arduino. After receiving each set of data from the PC, the Arduino starts a timer. If the timer elapses without a command or ping being received, the Arduino assumes communications are compromised, and shuts off the system autonomously by setting each of its pins to 0 VDC (see section A.3 in ESI†).
2.3 PC Control
Flowmeters are rated to have a certain pulse frequency corresponding to a certain flowrate, or rather, the number of pulses per volume. In this case a manufacturer specifies the number of pulses per liter for the a given flowmeter. The value obtained from the sensor (pulses per second) is divided by this constant to get the flowrate (L s−1). This value can then be converted to any flowrate unit desired.
To prevent copious amounts of meaningless recorded data, there is a timer which records the amount of time that this regular update takes. If not enough time is taken getting/sending updates to/from the Arduino, a small constant delay is added after the timer, thus setting the maximum refresh rate.
This flux or pressure control is achieved with a simple algorithm running in a continuous loop. If the measured pressure is higher than the target pressure, or if the measured flux is higher than the target flux, then the pump speed is directed to slow down to a small degree. If the measured pressure is lower than the target pressure, or if the measured flux is lower than the target flux, then the pump speed is directed to increase to a small degree. There is either a physical or artificial upper and lower limit placed on the pump speed. If the new requested speed is outside these limits, then instead of the pump adjusting its speed, the pressure control valve is directed to change its aperture (smaller for requested pressure increases, larger for requested pressure decreases). If both the pump speed and pressure control valves are at the edge of their real or user-imposed limits, then this becomes a system limitation, and constant pressure or flux cannot be provided by the system.
To keep the control algorithm simple, a robust PID control method is not implemented. As membrane fouling is expected to slowly effect the membrane efficiency, an algorithm that slowly, and iteratively, responds to measured changes in the environment will be sufficient for control. However, the rate at which the algorithm responds to environmental changes is important. A fast rate might lead to oscillations that are a function of the system changing control set points faster than the system can respond. A slow rate might not respond quickly enough to changes to keep membrane conditions within a predefined threshold. Delays may be employed following actuation commands to allow sufficient time for actuators to respond to inputs, before measuring the system's new state.
In practice, the delays employed to ensure system responsiveness while avoiding oscillations depends on the hardware. Valves are often rated by how long they require to move from fully closed to fully opened. This time is then multiplied by the portion of the valve that is required to actuate. For example, for this system a valve takes 90 s to fully open or close, and if the controller indicates that the valve should change its set point from 53.2% open, to 53.6% open, the delay time should be 90 s * abs(0.532–0.536) = 0.36 s. Keep in mind when determining incremental changes in actuation, that there is a limit to how small of a change the controller can dictate, and that the actuator can accept. For example, the controller for this system used 8-bit control for analog outputs (28 − 1 = 255), leading to a minimum controller increment of 1/255 = 0.39%. The actual minimum increment that should be used, is the larger of either the controller resolution, or the actuator resolution. As demonstrated, following every valve actuation in this system, a 0.36 second delay should be observed before making subsequent measurements and control decisions. Similar to the valve delay, there will be a delay in ramping up/down the pump speed. This depends on the pump size, system inertia, etc., and was empirically determined for this system to be about one second.
A detailed description of this control algorithm, and how the delays were implemented, can be found in Appendix C.
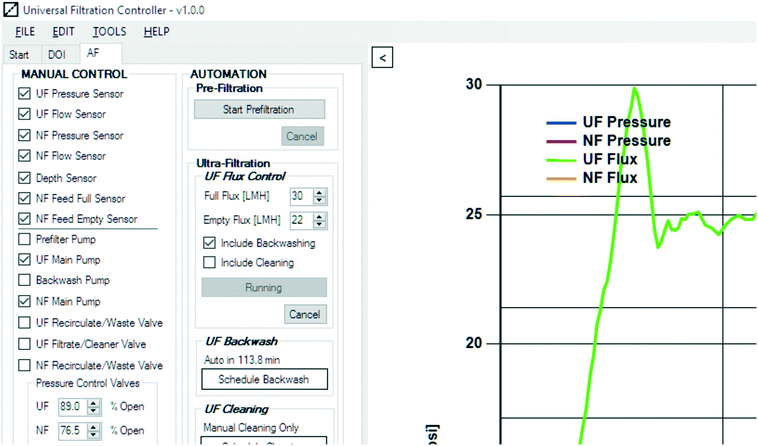
Fig. 9 is a screen shot of the GUI developed for one application of the membrane process controller. On the far left all the sensors and controls are listed. If a sensor's box is checked then that sensor will be regularly updated, with a checked control box indicating that the control is on. If the box is unchecked that control is off. As these controls only need to be turned on or off once (and not continuously updated) the GUI only updates each control once, after its state has changed. The pressure control valve positions are set in this region using numeric inputs. They are also only updated once, after each changed value. To the right of the controls are the process automation options. These options have a certain sequence of events that will take place autonomously. For example, for the UF Flux Control, when the user clicks the Start button (labeled as “Running” in the screen shot) the program first turns on the appropriate sensors by checking their boxes, then checks the box for the UF Main Pump, and starts changing the UF Pressure Control Valve number to try and match the requested user-defined flux.
All controls, automated or manual, take place through the manipulation of the GUI (checkboxes, numeric inputs, etc.). In this way there is never a conflict between automation and manual control. It also gives the user the flexibility to manually adjust a process, or to temporarily turn off a pump or sensor, even while an automated process is running. Two process threads are always active: the continuous Arduino-updater, and the thread controlling the GUI. The Arduino-updater continuously updates the Arduino with any sensor or hardware change requests, or pings in the absence of any activity. The GUI process thread continuously listens for changes in the GUI controls. In addition, the automated processes are each run on independent processing threads so as to not interfere with one another. This allows the user to use the single GUI to control several distinct and simultaneous filtration processes using a single PC and Arduino.
The space on the right of the GUI is reserved for sensor data output display. This shows the user at-a-glance the current state of the system as it operates. Further post-processing system analysis may be accomplished using a data logging file that records sensor and system outputs.
To maximize utility, this GUI has options to change hardware constants or calibrations as hardware changes, without requiring the underlying code to be rewritten. While the GUI is in no way universal for all filtration processes, the concept for the GUI remains the same. The embedded Arduino will be identical for myriad processes, and the communication between the PC and the Arduino also remains unchanged.
3. Results and discussion
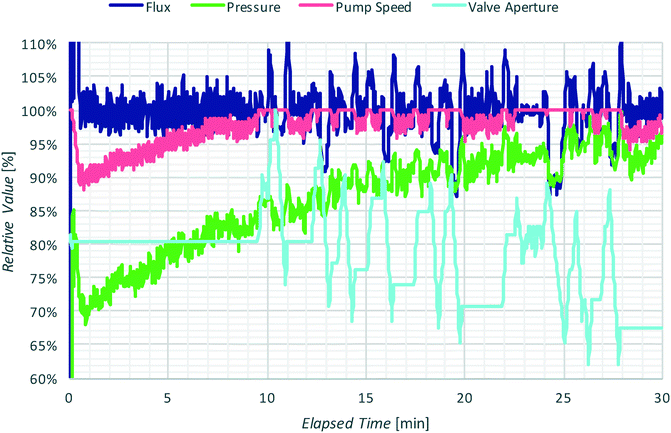
A system for membrane control has been applied to two distinct projects. Both projects involve utilizing membranes in either a constant flux or constant pressure mode, with permeate flux and feed pressure serving as system inputs. While the GUI has been regularly updated to adjust for changing requirements, the underlying PC to Arduino and embedded Arduino software have remained unchanged through thousands of hours of operations. Constant flux/pressure.The simple algorithms outlined in section 2.3.3 resulted in the example of real-life autonomous system behavior shown in Fig. 10. The system was set to hold the transmembrane flux constant by changing pump speed (fine control) and pressure valve aperture (coarse control). In Fig. 10, the flux is normalized by its mean value. The pressure, pump speed, and valve aperture are normalized by their individual maximum values.
The flux was successfully held relatively constant, with ±5% oscillations from its mean corresponding to pump speed changes, and ±10% oscillations corresponding to valve position changes. It is also shown that this steady flux was accomplished by steadily increasing the system pressure to overcome membrane fouling. In order to combat decreasing membrane efficiency, the pump speed continuously ramped up until it hit its operational limit at about 9.5 minutes. Once this physical limitation was met, the valve aperture adjusted itself to increase the flux. Once this valve adjustment was complete (11 min), control was handed back to the pump speed adjuster once again. Again the pump speed saturated (12 min) so adjustment was shifted back to the control valve, with this cycle continuing as necessary.
Note that the valve adjustment algorithm was written in such a way as to maximize pump speed. If smooth system performance is prioritized, then the algorithm would be adjusted accordingly, e.g. by closing the valve aperture further and reducing the allowable maximum pump speed. The algorithm used here was implemented due to its simplicity and satisfactory system performance. More complex algorithms that smooth system performance may be implemented, as programming in these control algorithms becomes trivial using PC-based control software.
Arduino vs. PLC
A simple Arduino microcontroller can be obtained for about $25. The components required for basic flux control are a pump, flowmeter, pressure control valve, and pressure transducer. The electronics required to interface these components with the Arduino cost approximately $50–$100, for a grand total of 75–125 USD for all of the required electronics. The Arduino software, and the communication and control algorithms outlined here, are open-source resources and can be obtained free of charge. Thus, the total package costs of approximately $100. The most basic PLC-based control system starts at $200, and can range to tens-of-thousands of dollars. Importantly, the most basic (and cheapest) commercially available PLCs are not sophisticated enough to control a fully-functioning membrane treatment system. In addition, the flexibility and expandability of the 100 USD Arduino-based system far outstrips the functionality found in basic PLC-based systems, and compares well to systems costing ten times as much. Paired with a PC, the Arduino-based system is capable of advanced GUI, data logging, and real-time system analysis.A major benefit of using an Arduino-based system is the open-source nature of its software. The software may be quickly and easily modified to suit changing research needs. For static systems that need no modifications year after year, a PLC-based control scheme is likely more appropriate, whereas for the rapidly changing research environment, the flexibility of this system is unparalleled.
4. Conclusions
Open-source hardware and software systems are an exciting development in the world of membrane and water treatment research. The widespread availability of open-source tools, such as the Arduino micro-controller and software development communities, make the development of highly sophisticated and flexible water treatment systems a feasible endeavor for small-scale users, such as small-scale businesses and university research labs. By following the steps described in this tutorial, individuals can construct complex control systems (both hardware and software) that can reproduce the performance of high-cost PLC controllers at a fraction of the cost. Furthermore, these open-source systems are highly flexible and modular, making it possible to modify systems to meet future demands, both in terms of system operations and scale. Another significant advantage of these open-source tools is the large and highly active community of developers that continuously publish new and improved algorithms and component designs that can be freely accessed by everyone. Thus, it is quite likely that many of the algorithms a user might need in order to implement their system control have already been developed and can be freely accessed. In addition, the forums where these codes and designs are published will often provide active user support that can be consulted. Of course, it is expected that if new algorithms and designs are developed (particularly by non-profit institutions, such as universities), this material will also be made available to other users of the community.In this paper we provided a general explanation of open-source hardware and software tools, as well as how they can be used to integrate membrane-specific control elements. In addition, we provide detailed guide to the construction of the electronics used in membrane control systems, as well as examples of computer code that can be used (and modified) to control different system elements. The membrane control systems detailed here are capable of performing all control processes that proprietary PLC systems can do. However, the open-source nature of the systems makes them far more flexible as well as significantly more affordable. The flexibility and modularity of these systems allows users to rapidly respond to changing operating conditions, increase process capacity, and modify system parameters easily and affordably, making membrane separation processes more accessible to the community.
Acknowledgements
The authors acknowledge the generous support of the United States Department of the Interior's Bureau of Safety and Environmental Enforcement (E14PC0026), and the United States Office of Naval Research (11655780) whose funding made this project possible.References
- N. Hilal, H. Al-Zoubi, N. Darwish, A. Mohamma and M. A. Arabi, Desalination, 2004, 170, 281–308 CrossRef CAS.
- M. M. Pendergast and E. M. Hoek, Energy Environ. Sci., 2011, 4, 1946–1971 CAS.
- M. D. Sobsey, C. E. Stauber, L. M. Casanova, J. M. Brown and M. A. Elliott, Environ. Sci. Technol., 2008, 42, 4261–4267 CrossRef CAS PubMed.
- I. C. Karagiannis and P. G. Soldatos, Desalination, 2008, 223, 448–456 CrossRef CAS.
- B. Cho and A. Fane, J. Membr. Sci., 2002, 209, 391–403 CrossRef CAS.
- C. Y. Tang, Y.-N. Kwon and J. O. Leckie, J. Membr. Sci., 2007, 290, 86–94 CrossRef CAS.
- E. M. Hoek, A. S. Kim and M. Elimelech, Environ. Eng. Sci., 2002, 19, 357–372 CrossRef CAS.
- K. Katsoufidou, S. Yiantsios and A. Karabelas, J. Membr. Sci., 2005, 266, 40–50 CrossRef CAS.
- K. Katsoufidou, S. Yiantsios and A. Karabelas, J. Membr. Sci., 2007, 300, 137–146 CrossRef CAS.
- A. Sagiv and R. Semiat, Desalination, 2005, 179, 1–9 CrossRef CAS.
- N. Avraham, C. Dosoretz and R. Semiat, Desalination, 2006, 199, 387–389 CrossRef CAS.
- A. Lim and R. Bai, J. Membr. Sci., 2003, 216, 279–290 CrossRef CAS.
- A. P. Mairal, A. R. Greenberg and W. B. Krantz, Desalination, 2000, 130, 45–60 CrossRef CAS.
- S. S. Madaeni, T. Mohamamdi and M. K. Moghadam, Desalination, 2001, 134, 77–82 CrossRef CAS.
- B. Alspach, S. Adham, T. Cooke, P. Delphos, J. Garcia-Aleman, J. Jacangelo, A. Karimi, J. Pressman, J. Schaefer and S. Sethi, J. - Am. Water Works Assoc., 2008, 100, 84–97 CAS.
- D. C. Sioutopoulos and A. J. Karabelas, J. Membr. Sci., 2012, 407, 34–46 CrossRef.
- E. K. Lee, V. Chen and A. Fane, Desalination, 2008, 218, 257–270 CrossRef CAS.
- L. Defrance and M. Jaffrin, J. Membr. Sci., 1999, 152, 203–210 CrossRef CAS.
- M. Turker and J. Hubble, J. Membr. Sci., 1987, 34, 267–281 CrossRef CAS.
Footnote |
| † Electronic supplementary information (ESI) available: Supporting information is available for this manuscript in the form of three separate appendices: Appendix A – Arduino Code, Appendix B – Circuit Diagram Tutorial, Appendix C – Flux/Pressure Control Code. See DOI: 10.1039/c6ew00194g |
| This journal is © The Royal Society of Chemistry 2016 |

