Fishing, trapping and killing of Escherichia coli (E. coli) in potable water†
Saumyadeb
Dasgupta
,
Naga Siva Kumar
Gunda
and
Sushanta K.
Mitra
*
Micro & Nano-scale Transport Laboratory, Lassonde School of Engineering, York University, Toronto, Ontario, Canada. E-mail: sushanta.mitra@lassonde.yorku.ca; Tel: +1 416 736 5924
First published on 14th October 2016
Abstract
An innovative process of effective ‘fishing, trapping and killing’ of Escherichia coli (E. coli) in contaminated water samples using paper strips is proposed here. A naturally occurring sugar, D-glucose, has been adsorbed onto blotting paper strips to facilitate the ‘fishing’ of E. coli cells by inducing their chemotactic response towards the chemoattractant (glucose) concentration gradient. By dipping paper strips laced with 0.1 M glucose in contaminated water samples, we report a maximum bacterial removal efficiency of 99.5% after a 90 minute duration. The porous nature of the paper strip facilitates the ‘trapping’ of the bacterial cells within its inherent porous network. Antimicrobial paper strips produced through the adsorption of bactericidal Moringa oleifera cationic protein (MOCP) were used to ‘kill’ the ‘trapped’ E. coli through prolonged contact. Finally, we have combined these individual processes into an integrated ‘fishing, trapping, and killing’ water treatment system, whereby the top and the bottom paper strips containing chemoattractant glucose are glued with the middle one containing the antimicrobial MOCP. Based on the results of the study, we anticipate that this approach can lead to the development of a new generation of inexpensive and portable water treatment devices which can passively remove and neutralize deleterious bacteria from water.
Water impactA novel technique for water treatment is presented here, whereby glucose is used as a chemoattractant for E. coli to be fished out of potable water, which are further trapped within the porous water matrix and eventually killed using antimicrobial properties of Moringa oleifera. This technique uses bio-degradable materials and harmless chemicals which have a minimal environmental impact. This passive technique can be useful in the field for military personnel, camping enthusiasts and remote limited resource communities. |
1 Introduction
Contaminated water sources continue to pose a major challenge in the twenty-first century towards providing clean and safe drinking water to the local communities.1–8 Freshwater resources all over the world are plagued by contaminants like traditional chemical wastes from agricultural and industrial sites, heavy metals, fecal coliforms, viruses as well as new-age pollutants such as endocrine disruptors and nitrosoamines.9,10 Notably, potable water sources contaminated by deleterious bacteria pose significant public health concerns impacting nearly 1.8 billion people globally.11 This is compounded by the limitations in implementing reliable water treatment solutions12–16 in limited resource communities where chlorine based disinfection procedures are still in vogue despite their considerable drawbacks and long-term health effects.17–20 Emerging water treatment techniques using nanoparticles21–24 and photocatalysts25–27 show considerable promise for point-of-use purposes, but their long term health impacts remain under continued scrutiny.28–31 Hence, there is a pressing need to remove harmful bacteria without creating toxic by-products in compromised water sources. Effective point-of-use devices and techniques which are cheap, easily available, portable and non-toxic with minimal energy requirements can serve this purpose towards providing clean and safe drinking water to the limited resource and marginalized communities.Our approach towards removing bacteria from water uses the phenomenon of directed movement of bacterial cells (chemotaxis) towards a favorable chemical agent. The chemotactic behavior of bacterial cell dispersions has been widely studied.32–38 In the presence of favorable chemical agents, called chemoattractants, the bacterial cells have been found to migrate towards regions of higher concentration along the chemoattracting gradient. Certain amino acids39 (like aspartate and serine) and sugars40 (like glucose, fructose and lactose) function as chemoattractants with varying degrees of effectiveness depending on their concentration and the type of bacterial species.33,41 Such controlled behavior has been used in a number of applications ranging from increasing the efficiency of contact-killing surfaces42 to regulated mixing in microfluidic systems43 and payload delivery in micro-robotics.44 Our strategy involved incorporating a suitable chemoattractant onto blotting paper to lure Escherichia coli (E. coli), the organism of interest in the study, out of water. Based on previous research,45,46D-glucose or dextrose, which is a naturally occurring sugar, was chosen as the model chemoattractant. This approach is akin to the mechanism of ‘fishing’ using glucose as ‘bait’ to capture E. coli from water. We note that the use of a porous substrate like paper, instead of an impervious one, facilitates the ‘trapping’ of the ‘fished’ bacterial cells within the internal porous network. In the present study, we report a maximum bacterial removal of 99.5% from water using this ‘fishing’ procedure and subsequently ‘trapping’ them within the blotting paper.
It is important to eventually ‘kill’ the trapped bacteria for a complete water treatment solution. There are a number of natural materials, such as plant essential oils,47,48 allicin49 and curcumin50 which have significant bactericidal properties. In our previous work focusing on nature inspired solutions for water treatment,51 we established the efficiency of Moringa oleifera seed extract in reducing bacterial loads in non-turbid water. Moringa oleifera is a multipurpose medicinal plant found in regions of tropical climate, especially in southeast Asia and Africa.52 Besides having a high nutritional value, the crude Moringa seed extract has been shown to contain a water soluble flocculating cationic protein which has been characterized53–56 and used in the treatment of highly turbid water sources.57–59 Moreover, this Moringa oleifera cationic protein (MOCP), present in the seed extract, exhibits antimicrobial activity by causing bacterial cell death through the mechanism of membrane fusion.60,61 Naturally, owing to its effectiveness and non-toxic nature, we proceeded with the incorporation of the antimicrobial MOCP onto the blotting paper to ‘kill’ the trapped bacteria through prolonged contact.
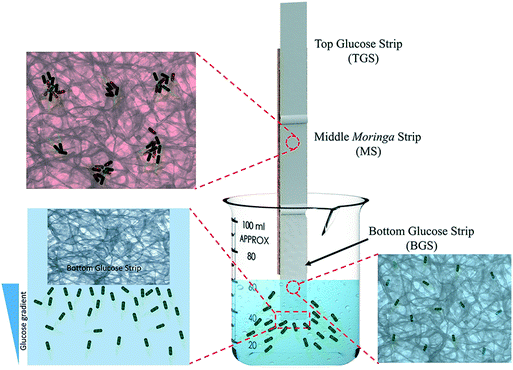
By using a simple combination of these mechanisms of ‘fishing, trapping and killing’, we present, in this study, a novel and sustainable water treatment technique, which is inherently made up of naturally available, biodegradable substances. The engineered natural system consists of three key components: highly porous, bio-degradable top and bottom blotting paper strips (Grade GB003, Whatman) laced with D-glucose and a similar central paper strip laced with Moringa oleifera seed extract. The principal ingredients, glucose and Moringa oleifera seeds, are harmless natural products which are conveniently available worldwide. The glucose works as a chemoattractant to lure the bacteria into the paper strips which are further killed after coming in contact with the MOCP present in the Moringa oleifera seed extract. We note that the use of blotting papers ensured a uniform capillary action facilitating the passive transport of fluid within our proposed system without the need of any additional pumps thereby reducing the overall cost of such a system. Our organism of interest was E. coli, a common Gram-negative bacteria of the fecal coliform group, present in abundance in compromised potable water sources. Herein, we demonstrate the proof-of-concept study of this environmentally-friendly water treatment approach by successfully removing >90–99.5% of E. coli (strain K12) from water.
2 Experimental section
2.1 Materials
Sample water used in all experiments was obtained from a Barnstead™ Nanopure™ water purifier (model no. D11971, Thermo Scientific, Waltham, Massachusetts). The model microorganism, Escherichia coli (K-12 strain), used in this study was obtained from New England Biolabs, Ipswich, Massachusetts, USA. The blotting paper (Catalogue no. WHA10427804) used to prepare the paper strips was procured from Sigma Aldrich, Canada. D-Glucose or dextrose (Catalogue no. 3260-1-70) was obtained from Caledon Laboratories Ltd., Ontario, Canada. Lauryl tryptose broth (LTB) (Catalogue no. CA90001-768) was used as the growth medium for E. coli. Luria Bertani (LB) agar (Catalogue no. CA90002-674) was used to plate the bacteria for the purposes of enumeration. All bacterial growth media were purchased from VWR, Canada. Sodium chloride (NaCl) obtained from Sigma Aldrich, Canada, was used to prepare a 0.85% concentrated solution which was used as a medium to suspend bacteria prior to fluorescence staining. Dry, unshelled Moringa oleifera seeds were procured from Purelife Herbs, USA. Standard issue cardboard and adhesives were used to prepare the device. 100 mL glass beakers (Catalogue no. 89000-200) from VWR, Canada were used to conduct the experiments. A two-pronged clamp (Catalogue no. 80063-610) from VWR, Canada was used to hold the paper strip combinations in place during all experiments. E. coli were stained for fluorescence using Live/Dead® BacLight™ bacterial viability kit (Catalogue no. L7012) from ThermoFisher Scientific, USA. Yellow-green fluorescent nanoparticles, 200 nm in diameter (Catalogue no. F8848, ThermoFisher Scientific, USA), were used to determine the protein adsorption on paper fibers. All bacterial growth media were autoclaved (Primus Sterilizer) according to experimental requirements.2.2 Imaging and characterization system
A DSLR camera (Nikon D5200) was used to capture all the images used in this study. The images of the paper strips after the experiments were obtained inside a dark enclosure (details provided in the ESI†). The mounted LED light source (Catalogue no. M490L3) used to observe the fluorescence from stained bacterial cells was attached to an adjustable collimator lens (Catalogue no. SM2P50-A) and connected to a LED driver (Catalogue no. LEDD1B) which controlled the current input. A 575 nm bandpass filter was used in conjunction with the camera to capture the fluorescence from stained E. coli cells. All lighting and filter accessories were obtained from Thorlabs, USA. A scanning electron microscope (Quanta 3D FEG, FEI) was used to characterize bacterial distributions within the paper strips. For the purpose of scanning electron microscopy (SEM) imaging, small portions of the paper strips were cut from the regions of interest and attached to SEM stubs using double sided carbon tape. The samples were then sputter coated with gold and imaged under high vacuum (10−5 Torr) and high voltage (20 kV) using an electron microscope. A confocal laser scanning microscope (Zeiss LSM 700) was used for the purposes described in this study. An optical upright microscope (Omax Epi-fluorescence Trinocular Compound Microscope) was used to capture bacterial distribution in the chemotaxis assay.2.3 Bacterial growth characterization and fluorescence staining
E. coli was grown overnight (24 hours) in 100 mL of autoclaved LTB at 37 °C inside an incubator under a constant shaking speed of 150 rpm. The resulting culture was enumerated using the plate counting technique following a serial dilution protocol. For the plate counting procedure, LB agar plates were used and the plated bacteria were incubated overnight (24 hours) at 37 °C before enumeration. The concentration of bacterial culture prepared before each set of experiments was maintained at 109 CFU mL−1. For staining purposes, the BacLight™ bacterial viability kit was used. Prior to staining, E. coli cells were doubly washed in deionized (DI) water according to manufacturer's guidelines and re-suspended in 0.85% sodium chloride solution (NaCl). The fluorescent dyes Syto 9 and propidium iodide (PI) were mixed in a 1![[thin space (1/6-em)]](https://www.rsc.org/images/entities/char_2009.gif) :
:![[thin space (1/6-em)]](https://www.rsc.org/images/entities/char_2009.gif) 1 ratio and 3 μL of the mixture was added per mL of bacterial culture and mixed thoroughly using a vortex shaker. Before using it in the experiments, the stained culture was kept in the dark for 15 minutes at room temperature. Only freshly stained cultures were used in the experiments to ensure uniformity in results.
1 ratio and 3 μL of the mixture was added per mL of bacterial culture and mixed thoroughly using a vortex shaker. Before using it in the experiments, the stained culture was kept in the dark for 15 minutes at room temperature. Only freshly stained cultures were used in the experiments to ensure uniformity in results.
2.4 Preparation of glucose and Moringa paper strips
The blotting paper obtained from Sigma Aldrich, Canada, was cut into 55 mm by 14 mm strips. Solutions of D-glucose of five different concentrations (0.0001 M, 0.001 M, 0.01 M, 0.1 M and 1 M) were prepared by adding requisite amounts of glucose in DI water. The paper strips were completely immersed in these solutions and kept on a shaker for 2 hours at room temperature. Thereafter, the wet strips were removed from the solutions and dried overnight at room temperature and used as glucose paper strips (GS) in subsequent experiments.Moringa oleifera seed extract (5% concentration, w/v) was prepared using previously reported procedures.51 As with glucose, the paper strips of the same dimensions were kept immersed in the seed extract for 2 hours under constant shaking. The strips were dried overnight prior to use in the experiments and are here onward referred to as Moringa paper strips (MS). The 2 hour immersion time was found to be sufficient for the adsorption of glucose and Moringa oleifera cationic protein (MOCP) onto the paper surfaces.
2.5 ‘Fishing’ experiments with glucose paper strips (GS)
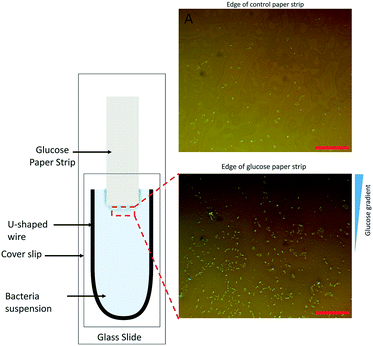
The chemoattracting effect of the modified paper strips (GS) was qualitatively analyzed. We modified the conventional capillary chemotaxis assay45 by replacing the capillary containing chemoattractants with a GS on the glass slide, as shown in Fig. 1. The rest of the chemotaxis setup, as reported by Adler,45 was kept unchanged. It consists of a U-shaped spacer covered by a coverslip to create the bacterial chamber. At the start of the experiment, 20 μL of bacterial culture of 109 CFU mL−1 concentration was placed carefully inside the chamber. Thereafter, a small GS was inserted carefully inside the bacterial chamber. After 5 minutes, images of bacterial dispersion near the edge of the paper strip were obtained using a camera attached to an optical microscope (details in the ESI†). As a control experiment, a similar piece of paper without glucose (NS) was inserted in the assay and images of the region around its edge were taken after 5 minutes.An initial set of screening experiments were also performed to investigate the most effective glucose concentration for bacterial chemotaxis. Different GS were created using five different glucose concentrations (1 M, 10−1 M, 10−2 M, 10−3 M, 10−4 M) and tested for effectiveness in water samples containing an initial bacterial concentration of 1.5 × 10⁶ CFU mL−1. The experimental procedure involved dipping the end of a vertical GS in 60 mL of model contaminated water sample with a known initial bacterial concentration. A clamp was used to hold the paper strips in a stable position (similar to the arrangement shown in Fig. S1 in the ESI†). The GS was removed from water after 90 minutes followed by the enumeration of bacterial count in the residual water sample by serial dilution and plate counting techniques. LB agar plates were incubated at 37 °C for 24 hours before counting the number of colonies. Control experiments were conducted using an NS in lieu of the GS.
2.6 Characterization of Moringa paper strips (MS)
The presence of MOCP in the dried MS was verified using yellow-green fluorescent particles (200 nm in diameter, sulphate modified) carrying a negative surface charge. 10 mL solution of the fluorescing particles with a concentration of 2.65 × 10¹⁰ particles per mL was prepared using DI water. MS were completely immersed in solutions containing the above-mentioned fluorescent particles and kept overnight under constant shaking. This ensured sufficient time for the electrostatic adsorption of the particles to the surface of the MS due to the underlying positive charge of the MOCP coating. Thereafter, the samples were removed from the solution, dried and imaged using a confocal laser scanning microscope. Untreated paper strips (NS) were subjected to the same experimental procedure and used as control.2.7 Experiments with the water treatment device
The water treatment device was constructed by a combination of three paper strips. Using a cardboard scaffold and appropriate adhesives, two GS and an MS of similar dimensions (55 mm by 14 mm), obtained through the processes described earlier, were fixed end to end with an approximately 5 mm overlap between them so that the entire water treatment system is composed of a bottom glucose strip (BGS), a middle Moringa strip (MS) and a top glucose strip (TGS), as shown in Fig. 2. During experiments, the cardboard scaffold was held with a clamp to ensure stability. Only the lower edge of the BGS was kept in contact with the contaminated water. The detailed experimental setup is shown in Fig. S1 in the ESI.† The contact between the individual strips at the overlap regions was properly monitored to ensure the smooth transition of water and bacteria along the strips. Fluorescent stained bacteria, obtained through the procedure described before, were used in this set of experiments by adding requisite amounts to the sample water. For all the experiments with the device, 60 mL water samples were used with an initial E. coli concentration of 1.5 × 10⁶ CFU mL−1. The experimental time was varied to track the liquid/air interface at different positions on the paper strips with the maximum experimental duration being 90 minutes. After the conclusion of the experiments, the configuration was removed from water and kept inside a dark enclosure for imaging, as shown in Fig. S2 in the ESI.† In order to confirm the presence of stained bacteria in the paper, we used an excitation wavelength of 490 nm and captured images using a 575 nm bandpass filter attached to the camera.3 Results and discussion
3.1 ‘Fishing’ efficiency of glucose strips
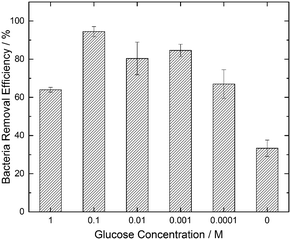
We hypothesized that a chemoattractant concentration gradient in the bulk media surrounding the GS would cause the directed migration of bacterial cells towards and into the GS. A two-fold approach was undertaken to verify this chemoattracting efficiency of GS. Our findings with a modified chemotaxis assay (see Fig. 1) confirmed that a GS was more efficient in luring bacteria towards it than an NS. On being introduced into the bacterial suspension, the GS, unlike the NS, induces a chemoattractant concentration gradient (shown in Fig. 1B) through diffusion to promote the active movement of bacteria along the glucose concentration gradient. This was confirmed by the presence of a higher density of E. coli cells in the area near the edge of the GS after 5 minutes as compared to the NS (Fig. 1A).Fig. 3 shows that the paper strips dipped in 0.1 M glucose solutions were the most efficient in removing E. coli from water among the different glucose concentrations (0.0001 M, 0.001 M, 0.01 M, 0.1 M and 1 M) that were tested. The GS laced with 0.1 M glucose removed 94.5% of the bacterial load, which was nearly three times more than the bacteria removal facilitated by the NS (indicated by the 0 glucose concentration in Fig. 3). The 33.3% bacterial removal caused by the NS can be attributed to the inherent capillary transport of E. coli suspension inside the porous paper. 1 M and 0.0001 M glucose concentrations were least effective among the GS with 64% and 67% bacteria removal, respectively, while both the 0.01 M and 0.001 M GS facilitated greater than 80% bacteria removal. We note that the existing literature40,42 suggests that the optimum glucose concentration to promote E. coli chemotaxis is in the vicinity of 10−3 M. Hence, we conclude that the strips dipped in 0.1 M glucose solution are able to create a chemoattracting gradient similar to that caused by 10−3 M glucose solution in capillary chemotaxis assays.
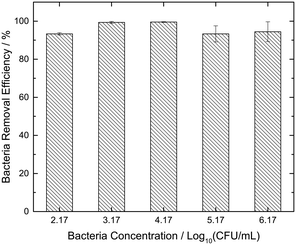
Fig. 4 shows the efficiency of the 0.1 M GS over a wide range of bacterial concentrations (102, 103, 104, 105 and 106 CFU mL−1). The maximum bacteria removal efficiency of 99.5% was obtained for samples with an E. coli concentration of 104 CFU mL−1. The results indicate the consistency of bacteria removal by GS, registering greater than 90% efficiency for all the considered cases. Even for the worst cases of 102 and 105 CFU mL−1, only 7% of the initial contamination remained in the residual water. Hence, all subsequent experiments were conducted utilizing the most effective 0.1 M GS.
3.2 The ‘trapping’ process
The use of the porous paper substrate was found to be highly beneficial for the entire process. Besides facilitating the continuous migration of bacterial cells inside the paper strips through capillary action and hence removing them from the bulk contaminated water, its permeable nature helps in ‘trapping’ the same bacterial cells within its porous network. The pores being much larger than individual cells do not hinder the movement of the cells away from the bulk water source. The preliminary experiments showed that the bacterial cells ‘fished’ from water migrated until the very end of the paper strips along with the liquid/air front (results not shown here for brevity). Hence, the presence of a porous network is fundamental to the ‘trapping’ process, which could not have been achieved otherwise by using a substrate of impermeable nature.3.3 MOCP adsorption on paper
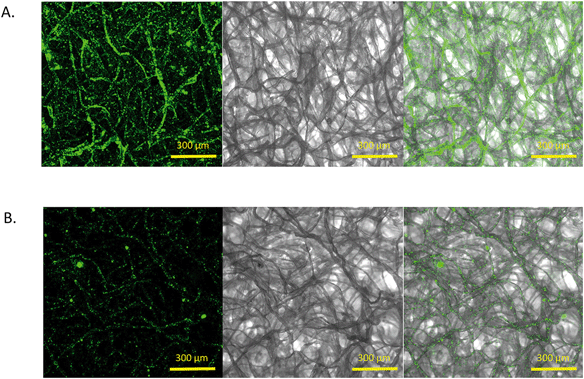
Previously, the antimicrobial properties of MOCP were achieved on the surfaces of silica microparticles62 by simply suspending them in a solution of the Moringa oleifera seed extract. We hypothesized that the blotting paper strip would similarly be able to adsorb the water soluble MOCP from the extract and the protein would retain its antimicrobial properties in a dried form. Fig. 5 shows the images of an MS and an NS taken after overnight incubation in a solution of yellow-green fluorescent particles. The confocal microscopy images show a very high particle density and, hence, a higher fluorescence intensity in the MS compared to the NS. This served as a definitive proof of the presence of the MOCP on paper because the negatively charged fluorescent particles are greatly adsorbed due to the cationic charge of the underlying protein in the MS. The images clearly depict the distribution of the fluorescing particles along the paper fibers. The NS, devoid of any cationic surface charge, showed minimal nanoparticle retention owing to the interaction of surface forces.3.4 ‘Killing’ of E. coli
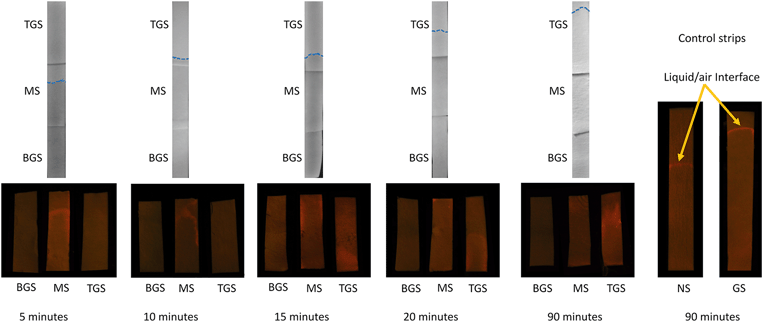
Following the successful ‘fishing’ of bacteria from water, we proceeded towards ‘killing’ the ‘trapped’ E. coli on paper using the MOCP. Earlier studies with MOCP51,60 has established that the flocculating and antimicrobial characteristics of the protein takes effect approximately 3 minutes after initiation of contact. This feature necessitated a certain minimum length of the Moringa paper strip (MS) for the motile bacteria to be in contact with the cationic protein for more than 3 minutes. By tracking the progress of the liquid/air interface, we determined that a 55 mm long MS would provide a sufficient contact time for this purpose. Hence, the length of GS was also maintained at 55 mm to maintain uniformity. We anticipated that the E. coli cells after being ‘fished’ out of water by the BGS would smoothly progress into the MS, where they would be neutralized owing to prolonged (greater than 3 minutes) contact with MOCP adsorbed onto the paper fibers. The principal function of the TGS is in facilitating the transfer of any viable E. coli cells, which didn't get killed in contact with MOCP located in the MS, to the topmost paper strip and essentially trapping them further. The position of the liquid/air interface and the corresponding bacterial distributions were tracked at different experimental times. The images obtained from this set of experiments are shown in Fig. 6.We observed that the E. coli cells move with the interface, rising steadily owing to capillary action through the porous paper strips, as indicated by the concentrated fluorescence intensity (emitted by the bacterial cells stained with fluorescing dyes Syto 9 and propidium iodide) tracing the liquid/air front in Fig. 6. We also performed control studies using two separate strips – NS and GS, each 140 mm long. During the entire 90 minute span of the front tracking experiments using control strips (images not shown), bacterial cells always followed the liquid/air interface. This is a classic example of motile bacterial cell behavior, which can also be observed in droplets of bacterial suspensions63 where the cells seek towards the droplet/air interface. The combined configuration of BGS-MS-TGS, on the other hand, indicated an interesting scenario. During the first 5 minutes, we observed a smooth front movement with the bacterial cells faithfully following the liquid/air interface, similar to that in the control experiments (see Fig. 6). However, as soon as the duration of the front within MS extended beyond three minutes, we observe a faint fluorescent trail behind the interface. After 10, 15 and 20 minutes of dipping time, we observed distinct regions with increasing fluorescence away from the interface and along the edges of the MS and TGS indicating bacterial cell deposits in these areas. Close to the end of the experiment, i.e. at the 60 and 90 minutes mark, we witnessed a nearly complete separation of the bacterial cells from the interface, as is evident from the widespread prevalence of highly fluorescing zones away from the interface in the TGS. At the end of the experiment, the fluorescence intensity at the interface in the TGS is found to be very low as compared to areas away from it, indicating a much lower concentration of viable E. coli cells at the liquid/air interface area. This unusual behavior can be explained from the detailed scanning electron microscopy (SEM) images of the paper strips, which is discussed later. All the images shown in Fig. 6 are representative images as the exact location and the shape of the interface would vary due to the inherent nature of randomness in the porous paper strips. We refrained from quantifying the viable and non-viable bacterial cells based on the area-wise fluorescence intensity distribution of the paper strips because of certain challenges, which are discussed in detail in the ESI† (please refer to the section: analysis of fluorescence distribution on paper strips).
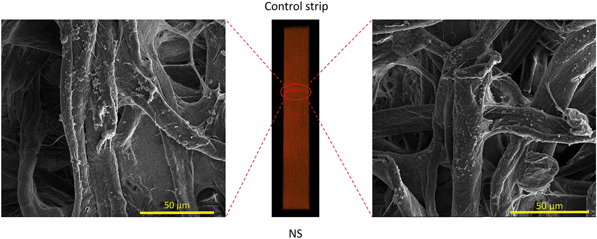
We further confirm here that the fluorescence from the paper strip is indeed due to ‘trapped’ bacterial cells. For this purpose, direct evidence was gathered from scanning electron microscopy (SEM) images of the used paper strips. The fluorescing zones were identified and viewed under high vacuum settings of the microscope. The SEM images were first captured for the control strip (NS), as shown in Fig. 7, to establish a reference data set. Naturally, under such high vacuum setting of the SEM, the E. coli cells were not able to retain their characteristic rod like shape and appear fragmented in the images. Images taken all along the fluorescing interface of the control strip reveals a uniform distribution of bacterial cells on the individual paper fibers. Except for the fluorescing liquid/air interface (see right panel in Fig. 6), we did not observe significant bacterial presence elsewhere on the NS.
Subsequently, the three paper strips of the combined configuration were subjected to a similar inspection after the ‘fishing, trapping and killing’ maneuver. Fig. 8 displays the bacterial distributions observed in the TGS, MS and BGS, respectively. The BGS did not show any fluorescence because all the bacterial cells had moved onto the MS and TGS as is evident from the SEM images in the bottom panel of Fig. 8. In the ensuing investigation of the fluorescing regions for the middle MS, we were able to observe large deposits of aggregated bacteria, as shown in Fig. 8. These agglomerates are typical consequences of the flocculating action of MOCP. As reported earlier,51,60 the mechanisms of bacterial neutralization by the MOCP is due to a combination of flocculation and membrane fusion processes leading to non-viable aggregates of bacterial cells. As the liquid/air interface crosses over to the MS from the BGS, the MOCP, being water soluble, begins to interact with the bacterial cells at the interface. After the three minutes mark, both the flocculating and antimicrobial characteristics start taking into effect and the bacterial surface charges are neutralized causing them to form clusters. Shortly after, the neutralized and clustered bacteria are unable to follow the liquid/air interface and begin to trail behind. The large clusters which become comparable to the pore sizes of the paper are deposited towards the edges and away from the interface owing to hindrance caused by the paper fibers. The remaining viable E. coli cells continue to follow the interface up to the TGS where we observe a reduced fluorescence intensity. The smaller clusters are also pulled along up to the TGS where they lag behind the interface leaving a trail of non-viable bacteria cells spread across the TGS, as is evident from the images in the top panel of Fig. 8.
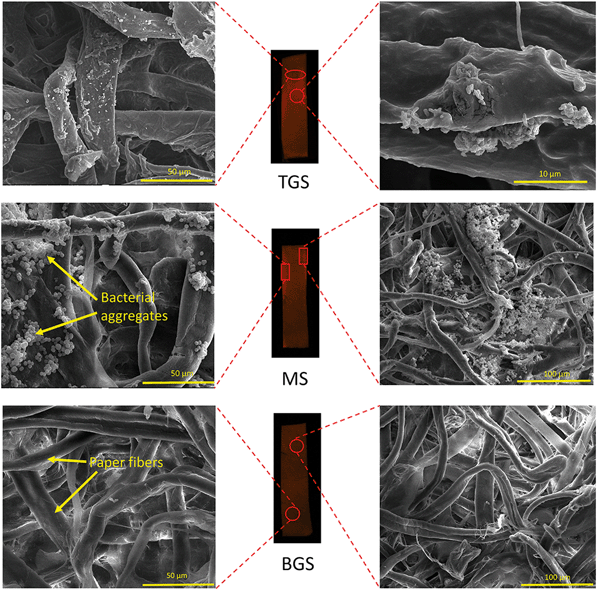 | ||
| Fig. 8 SEM images of the TGS, MS and BGS taken under high vacuum. The left and right panels have different magnifications. The length of exposure time for these images were 60 seconds on average. | ||
The current study has been performed under a very controlled set of laboratory conditions with minimum influence from external factors. However, further testing is needed with environmental samples which contain a large number of organic and inorganic contaminants along with suspended particulates. The effect and interference of these contaminants with the current “fishing, trapping and killing” process can be validated through field testing which would constitute a portion of the future study.
3.5 Effect of leached glucose on bacterial growth
Although this current study did not look at the effect of glucose on E. coli concentration beyond the 90 minute experimental time, one can provide some estimate. Considering the diffusion coefficient (D) of glucose in water to be 6.7 × 10⁻¹⁰ m2 s−1 (a value from the literature64) and the length of the glucose strip (x = 0.055 m) to be the diffusion distance of the glucose molecules, the time required (t) can be scaled as follows: t ∼ x2/D. This gives us a time of approximately 4.5 × 10⁶ s which is significantly large compared to the experimental duration. Our measurements at the end of 90 minutes have shown a residual glucose concentration of 10−3 M.The optimal condition for any bacteria to grow is the presence of carbon and nitrogen sources. Recently, Bren et al.65 reported that E. coli strains grow slowly in the presence of glucose with poor nitrogen sources due to suboptimal levels of cyclic adenosine monophosphate (cAMP). van Elsas et al.66 also reviewed that there is no or minimal growth of bacteria in the presence of glucose only, even after 24 hours of time period. In the present work, we have not added any other nitrogen source to the water samples and the experimental time is 90 min only. Hence, the chances of bacterial growth in the stipulated time period are very minimal.
We also state that motility effects are related to growth kinetics, in a manner analogous to diffusion- and reaction-limited regimes in chemically reacting systems. According to Lauffenburger et al.,67 random motility may lead to decreased population density. In addition, their study also suggested that chemotaxis can allow increased population density if the chemotactic response is large enough (around more than 20 hours).
There is a certain possibility of glucose being released into the water which must be addressed in the future as this technique is developed further to include other water sources. Therefore, further investigation is required to address the issue of leached glucose in the water samples after treating using DipTreat (shown in the next section).
3.6 Future outlook: towards a sustainable point-of-use water treatment device
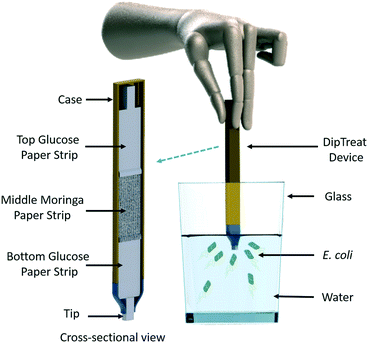
One of the possibilities to deploy this kind of new water treatment device is in the form of a dip pen, where one can package the three strips as a cartridge of a pen and then dip such pen to treat a glass of water. The pen can be immersed in the water for a specified time to remove the bacterial contaminant. Fig. 9 showcases one such possible design and we named it the DipTreat device.68 The DipTreat device would be a powerful hand-held tool for rapid treatment of water in remote communities and even for military applications, where one can dip this DipTreat device in water collected in a glass (60 mL size) for more than 3 min to clean the water.It is to be noted that the working principle of this device limits its application only to motile microorganisms like bacteria and protozoa, which show chemotactic behavior, among which only a single bacterial species (E. coli) has been tested. To be included as a tier 3 product under the WHO's household water treatment evaluation scheme,69 the device would need to successfully remove at least 2![[thin space (1/6-em)]](https://www.rsc.org/images/entities/char_2009.gif) log
log![[thin space (1/6-em)]](https://www.rsc.org/images/entities/char_2009.gif) 10 of bacteria such as E. coli and at least 2
10 of bacteria such as E. coli and at least 2![[thin space (1/6-em)]](https://www.rsc.org/images/entities/char_2009.gif) log
log![[thin space (1/6-em)]](https://www.rsc.org/images/entities/char_2009.gif) 10 of protozoa such as Cryptosporidium parvum. We demonstrate the potential to achieve 2
10 of protozoa such as Cryptosporidium parvum. We demonstrate the potential to achieve 2![[thin space (1/6-em)]](https://www.rsc.org/images/entities/char_2009.gif) log
log![[thin space (1/6-em)]](https://www.rsc.org/images/entities/char_2009.gif) 10 of E. coli removal here. To be an effective household water treatment device under the WHO's scheme, however, we would need to demonstrate consistent bacteria and protozoa removal.
10 of E. coli removal here. To be an effective household water treatment device under the WHO's scheme, however, we would need to demonstrate consistent bacteria and protozoa removal.
A multitude of point-of-use devices are available and certified according to their efficiencies and target contaminants (Table 1). A 99% efficiency corresponds to 2![[thin space (1/6-em)]](https://www.rsc.org/images/entities/char_2009.gif) log removal of contaminants. Most of the microfiltration and ultrafiltration based products fall under the tier 2 and tier 3 categories of household water treatment devices according to the World Health Organization by causing greater than 2
log removal of contaminants. Most of the microfiltration and ultrafiltration based products fall under the tier 2 and tier 3 categories of household water treatment devices according to the World Health Organization by causing greater than 2![[thin space (1/6-em)]](https://www.rsc.org/images/entities/char_2009.gif) log removal of bacteria and protozoa and 3
log removal of bacteria and protozoa and 3![[thin space (1/6-em)]](https://www.rsc.org/images/entities/char_2009.gif) log removal of viruses (only ultrafiltration based).69 These products are usually expensive and, for large volumes, would require a power source. Chemical treatment of water at the point-of-use through the use of chemical pills and solutions is a cheaper alternative. However, based on the kind of water contamination, their effectiveness can differ widely and, in certain cases, may produce harmful by-products. Comparatively, disinfection using ultraviolet light gives far more consistent efficiency but suffers from the drawback in terms of power requirement which limits its reliability in the field. Some of the drawbacks of these devices are alleviated by the DipTreat device described in the present research. Although further research and extensive testing are needed to reliably compare it to products in the market, it provides an exciting outlook towards the development of a new generation of inexpensive and sustainable devices.
log removal of viruses (only ultrafiltration based).69 These products are usually expensive and, for large volumes, would require a power source. Chemical treatment of water at the point-of-use through the use of chemical pills and solutions is a cheaper alternative. However, based on the kind of water contamination, their effectiveness can differ widely and, in certain cases, may produce harmful by-products. Comparatively, disinfection using ultraviolet light gives far more consistent efficiency but suffers from the drawback in terms of power requirement which limits its reliability in the field. Some of the drawbacks of these devices are alleviated by the DipTreat device described in the present research. Although further research and extensive testing are needed to reliably compare it to products in the market, it provides an exciting outlook towards the development of a new generation of inexpensive and sustainable devices.
| Products | Technology used | Targeted contaminants | Price | Efficiency | Power source |
|---|---|---|---|---|---|
| Filtration bottles, filtration straws, gravity filters | Microfiltration | Bacteria and protozoa | $20–150 | >99% | Not required |
| Filtration bottles | Ultrafiltration and adsorption | Bacteria, virus, protozoa, chemicals, particulates, heavy metals | $60–400 | >99% | Required in some cases |
| Chemical pills and solutions | Chemical treatment | Bacteria, protozoa and virus | $10–20 | Variable, depending on water sources | Not required |
| UV bottles and pens | Ultraviolet light | Bacteria, protozoa and virus | $70–150 | >99% | Required |
| DipTreat strips (present research) | Bacterial chemotaxis and contact-killing antimicrobial agent | Bacteria (E. coli) | $12 (per 100 strips, rough estimate) | >90–99% | Not required |
4 Conclusions
In the current work, we present a novel technique of ‘fishing, trapping and killing’ bacterial cells which has a significant potential in point-of-use water treatment. This proof-of-concept study indicates that the process can be integrated into an innovative water treatment device constituted of easily available blotting paper strips laced with natural materials like glucose and Moringa oleifera seed extract. Using the chemotactic response of E. coli towards glucose, the device is capable of luring >90–99% of bacterial load from the sample water onto the paper strip. The innovative configuration of the top and bottom glucose strips helps in trapping the bacteria within the paper substrate where the E. coli cells are killed by the centrally placed Moringa strips due to the bactericidal action of the MOCP, the presence of which has been confirmed using negatively charged fluorescent nanoparticles. The distribution of the fluorescent tagged E. coli cells on paper strips has been characterized through detailed SEM imaging. Overall, the findings demonstrate a sustainable water treatment technique using the antimicrobial activity of MOCP and the chemoattracting properties of glucose. Our paper device was effective in ‘fishing, trapping and killing’ E. coli in a very simple and efficient manner. The use of a chemoattractant to lure bacteria from water towards an antimicrobial protein in a paper based scaffold has significant potential to be a ‘clean and green’ technology as well as an economic solution towards removing bacteria from potable water. The efficiency of the system can be enhanced by preparing the MS with higher extract concentrations thereby incorporating more protein molecules which would augment bacteria neutralization.51 We anticipate that this technique can be generalized for a large number of deleterious waterborne bacteria by using a combination of effective chemoattractants and contact killing antimicrobials which can be easily integrated with paper scaffolds. Moreover, this technique can be expanded to remove bacteria from other contaminated beverages like milk and fruit juices. This strategy can also find use in targeted bacteria removal from water or any liquid media through the use of species specific chemoattractants. The use of glucose and Moringa oleifera in our case ensures that no harmful chemicals are leached into the sample water, which could otherwise have an adverse impact to public health. We envision that this technique can be converted into a compact point-of-use product for water treatment in limited resource communities across the globe.Acknowledgements
The authors thank Dr. Magdalena Jaklewicz, a microscopy technologist at the Imaging Facility of the Faculty of Science, York University, for her technical assistance in acquiring all confocal and scanning electron microscopy images. Financial support from the Lassonde School of Engineering through the Start-up Grant and Kaneff Professorship, awarded to SKM, is highly acknowledged here.References
- M. A. Shannon, P. W. Bohn, M. Elimelech, J. G. Georgiadis, B. J. Marinas and A. M. Mayes, Nature, 2008, 452, 301–310 CrossRef CAS PubMed.
- R. P. Schwarzenbach, B. I. Escher, K. Fenner, T. B. Hofstetter, C. A. Johnson, U. Von Gunten and B. Wehrli, Science, 2006, 313, 1072–1077 CrossRef CAS PubMed.
- N. S. K. Gunda, R. Chavali and S. K. Mitra, Analyst, 2016, 141, 2920–2929 RSC.
- N. S. K. Gunda, S. Naicker, S. Shinde, S. Kimbahune, S. Shrivastava and S. Mitra, Anal. Methods, 2014, 6, 6236–6246 RSC.
- R. Chavali, N. S. K. Gunda, S. Naicker and S. K. Mitra, Anal. Methods, 2014, 6, 6223–6227 RSC.
- N. S. K. Gunda, S. Naicker, M. S. Ghoraishi, S. Bhattacharjee, T. G. Thundat and S. K. Mitra, ASME 2013 11th International Conference on Nanochannels, Microchannels, and Minichannels, 2013, p. V001T10A001 Search PubMed.
- R. S. Brown and M. Hussain, Analyst, 2003, 128, 320–322 RSC.
- W. J. Rhoads, A. Pruden and M. A. Edwards, Environ. Sci.: Water Res. Technol., 2016, 2, 164–173 CAS.
- J. Nawrocki and P. Andrzejewski, J. Hazard. Mater., 2011, 189, 1–18 CrossRef CAS PubMed.
- R. Chavali, N. S. K. Gunda, S. Naicker and S. K. Mitra, Anal. Chem. Res., 2015, 6, 26–31 CrossRef CAS.
- WHO/UNICEF Joint Water Supply and Sanitation Monitoring Programme and World Health Organization, Progress on Drinking Water and Sanitation: 2014 Update, World Health Organization, 2014 Search PubMed.
- M. Clara, B. Strenn, O. Gans, E. Martinez, N. Kreuzinger and H. Kroiss, Water Res., 2005, 39, 4797–4807 CrossRef CAS PubMed.
- V. A. Oyanedel-Craver and J. A. Smith, Environ. Sci. Technol., 2007, 42, 927–933 CrossRef.
- J. Bratby, Coagulation and Flocculation in Water and Wastewater Treatment, IWA Publishing, 2006 Search PubMed.
- J. J. Macauley, Z. Qiang, C. D. Adams, R. Surampalli and M. R. Mormile, Water Res., 2006, 40, 2017–2026 CrossRef CAS PubMed.
- C. K. Gomez-Smith, D. T. Tan and D. Shuai, Environ. Sci.: Water Res. Technol., 2016, 2, 245–249 Search PubMed.
- D. L. Sedlak and U. von Gunten, Science, 2011, 331, 42–43 CrossRef CAS PubMed.
- D. Stalter, E. O'Malley, U. von Gunten and B. I. Escher, Environ. Sci.: Water Res. Technol., 2016, 2, 875–883 CAS.
- M. J. Nieuwenhuijsen, M. B. Toledano, N. E. Eaton, J. Fawell and P. Elliott, Occup. Environ. Med., 2000, 57, 73–85 CrossRef CAS PubMed.
- J. O. Bockris, R. C. Bhardwaj and C. L. K. Tennakoon, Analyst, 1994, 119, 781–789 RSC.
- T. Pradeep, Thin Solid Films, 2009, 517, 6441–6478 CrossRef CAS.
- T. A. Dankovich and D. G. Gray, Environ. Sci. Technol., 2011, 45, 1992–1998 CrossRef CAS PubMed.
- T. A. Dankovich, J. S. Levine, N. Potgieter, R. Dillingham and J. A. Smith, Environ. Sci.: Water Res. Technol., 2016, 2, 85–96 CAS.
- K. Simeonidis, S. Mourdikoudis, E. Kaprara, M. Mitrakas and L. Polavarapu, Environ. Sci.: Water Res. Technol., 2016, 2, 43–70 Search PubMed.
- M. N. Chong, B. Jin, C. W. Chow and C. Saint, Water Res., 2010, 44, 2997–3027 CrossRef CAS PubMed.
- X. Li, H. Liu, L. Cheng and H. Tong, Environ. Sci. Technol., 2003, 37, 3989–3994 CrossRef CAS PubMed.
- C. K. Remucal and D. Manley, Environ. Sci.: Water Res. Technol., 2016, 2, 565–579 CAS.
- P. H. Hoet, I. Brüske-Hohlfeld and O. V. Salata, J. Nanobiotechnol., 2004, 2, 12 CrossRef PubMed.
- H. M. West, J. Cawley and R. Wills, Analyst, 1995, 120, 1267–1271 RSC.
- P. M. Bersier, W. Neagle and D. Clark, Analyst, 1992, 117, 863–868 RSC.
- H. Wang, M. Li, K. Brockman and T. H. Nguyen, Environ. Sci.: Water Res. Technol., 2016, 2, 483–491 CAS.
- W. Shi, T. Köhler and D. R. Zusman, Mol. Microbiol., 1993, 9, 601–611 CrossRef CAS PubMed.
- R. Barak, I. Nur and Y. Okon, J. Appl. Bacteriol., 1983, 54, 399–403 CrossRef.
- D. Zicha, G. A. Dunn and A. F. Brown, J. Cell Sci., 1991, 99, 769–775 Search PubMed.
- V. Leick and J. Helle, Anal. Biochem., 1983, 135, 466–469 CrossRef CAS PubMed.
- T. Ahmed, T. S. Shimizu and R. Stocker, Integr. Biol., 2010, 2, 604–629 RSC.
- M. Kim, S. H. Kim, S. K. Lee and T. Kim, Analyst, 2011, 136, 3238–3243 RSC.
- R. M. Kenney, M. W. Boyce, A. S. Truong, C. R. Bagnell and M. R. Lockett, Analyst, 2016, 141, 661–668 RSC.
- R. Mesibov and J. Adler, J. Bacteriol., 1972, 112, 315–326 CAS.
- J. Adler, G. L. Hazelbauer and M. Dahl, J. Bacteriol., 1973, 115, 824–847 CAS.
- T. Melton, P. E. Hartman, J. P. Stratis, T. L. Lee and A. T. Davis, J. Bacteriol., 1978, 133, 708–716 CAS.
- R. Jain, N. G. Faith, A. Milkowski, K. Nelson, D. Busche, D. M. Lynn, C. J. Czuprynski and N. L. Abbott, Angew. Chem., 2016, 128, 5792–5796 CrossRef.
- M. J. Kim and K. S. Breuer, Anal. Chem., 2007, 79, 955–959 CrossRef CAS PubMed.
- D. Kim, A. Liu, E. Diller and M. Sitti, Biomed. Microdevices, 2012, 14, 1009–1017 CrossRef CAS PubMed.
- J. Adler, Microbiology, 1973, 74, 77–91 CrossRef CAS PubMed.
- H. C. Berg and D. A. Brown, Nature, 1972, 239, 500–504 CrossRef CAS PubMed.
- J. Gutierrez, C. Barry-Ryan and P. Bourke, Int. J. Food Microbiol., 2008, 124, 91–97 CrossRef CAS PubMed.
- R. Farag, Z. Daw, F. Hewedi and G. El-Baroty, J. Food Prot., 1989, 52, 665–667 CAS.
- S. Ankri and D. Mirelman, Microbes Infect., 1999, 1, 125–129 CrossRef CAS PubMed.
- R. K. Basniwal, H. S. Buttar, V. Jain and N. Jain, J. Agric. Food Chem., 2011, 59, 2056–2061 CrossRef PubMed.
- S. Dasgupta, N. S. K. Gunda and S. K. Mitra, RSC Adv., 2016, 6, 25918–25926 RSC.
- F. Anwar, S. Latif, M. Ashraf and A. H. Gilani, Phytother. Res., 2007, 21, 17–25 CrossRef CAS PubMed.
- K. A. Ghebremichael, K. Gunaratna, H. Henriksson, H. Brumer and G. Dalhammar, Water Res., 2005, 39, 2338–2344 CrossRef CAS PubMed.
- U. Gassenschmidt, K. D. Jany, T. Bernhard and H. Niebergall, Biochim. Biophys. Acta, Gen. Subj., 1995, 1243, 477–481 CrossRef.
- M. Broin, C. Santaella, S. Cuine, K. Kokou, G. Peltier and T. Joet, Appl. Microbiol. Biotechnol., 2002, 60, 114–119 CrossRef CAS PubMed.
- M.-S. Chang, J. H. Yoo, D. H. Woo and M.-S. Chun, Analyst, 2015, 140, 7997–8006 RSC.
- A. Ndabigengesere, K. S. Narasiah and B. G. Talbot, Water Res., 1995, 29, 703–710 CrossRef CAS.
- A. Ndabigengesere and K. S. Narasiah, Water Res., 1998, 32, 781–791 CrossRef CAS.
- T. Nkurunziza, J. Nduwayezu, E. Banadda and I. Nhapi, Water Sci. Technol., 2009, 59, 1551–1558 CrossRef CAS PubMed.
- K. Shebek, A. B. Schantz, I. Sines, K. Lauser, S. Velegol and M. Kumar, Langmuir, 2015, 31, 4496–4502 CrossRef CAS PubMed.
- M. Lürling and W. Beekman, J. Appl. Phycol., 2010, 22, 503–510 CrossRef PubMed.
- H. A. Jerri, K. J. Adolfsen, L. R. McCullough, D. Velegol and S. B. Velegol, Langmuir, 2011, 28, 2262–2268 CrossRef PubMed.
- T. Kasyap, D. L. Koch and M. Wu, Phys. Fluids, 2014, 26, 111703 CrossRef.
- A. C. Ribeiro, O. Ortona, S. M. Simoes, C. I. Santos, P. M. Prazeres, A. J. Valente, V. M. Lobo and H. D. Burrows, J. Chem. Eng. Data, 2006, 51, 1836–1840 CrossRef CAS.
- A. Bren, J. O. Park, B. D. Towbin, E. Dekel, J. D. Rabinowitz and U. Alon, Sci. Rep., 2016, 6, 24834 CrossRef CAS PubMed.
- J. D. van Elsas, A. V. Semenov, R. Costa and J. T. Trevors, ISME J., 2011, 5, 173–183 CrossRef PubMed.
- D. Lauffenburger, R. Aris and K. Keller, Biophys. J., 1982, 40, 209 CrossRef CAS PubMed.
- S. K. Mitra, N. S. K. Gunda and S. Dasgupta, Method and apparatus for treating E. coli, Indian Provisional Patent Application No. 201621030873, 2016, filed on September 9, 2016 Search PubMed.
- W. H. Organization, Evaluating household water treatment options: Health-based targets and microbiological performance specifications, 2011 Search PubMed.
Footnote |
| † Electronic supplementary information (ESI) available. See DOI: 10.1039/c6ew00200e |
| This journal is © The Royal Society of Chemistry 2016 |

