
Time series relationships between chlorophyll-a, dissolved oxygen, and pH in three facultative wastewater stabilization ponds
J.
Wallace
,
P.
Champagne
* and
G.
Hall
Department of Civil Engineering, Queen's University, Ellis Hall, 58 University Avenue, Kingston, Ontario K7L 3N6, Canada. E-mail: champagne@civil.queensu.ca; Fax: +1 613 533 2128; Tel: +1 613 533 3053
First published on 6th October 2016
Abstract
This study involved the evaluation of time-series relationships between chlorophyll-a (chl-a), dissolved oxygen (DO), and pH in three facultative wastewater stabilization ponds (WSPs) operated in series at a wastewater treatment plant in eastern Ontario, Canada. Since 2003, the WSP system has experienced high pH levels and excessive algae growth during the summer months. During the summer of 2013, chl-a, DO, pH, temperature, and daily solar radiation were monitored on an hourly basis for each WSP over a one-week period, with an additional two weeks conducted in WSP#2 to provide a more robust data set. Time-series analyses, consisting of cross-correlation evaluations, were performed on the dataset to investigate the time-dependent dynamics between chl-a, DO, and pH. Strong statistical dependence between chl-a, DO, and pH was identified during periods of high photosynthetic activity and algae growth. WSP#2 had the highest algae growth and the statistical relationships between chl-a and DO and chl-a and pH were the strongest, with maximum cross-correlation coefficients of 0.54 and 0.56 observed at lags of 20 and 16 hours for DO and pH, respectively. Strong diurnal patterns for DO and pH were observed in WSP#1 and WSP#4, and in WSP#2 during periods of reduced algae growth. During periods of excessive algae growth in WSP#2, no clear DO and pH diurnal patterns were noted. In general, across all WSPs, daily DO concentration peaks led those of chl-a by an average of 43 minutes, which subsequently led those of pH by an average of 2 hours and 15 minutes.
Water impactThis study provides strong evidence that the relationships between algae growth, dissolved oxygen formation, and pH levels in wastewater lagoons are significantly time-dependent and correlated. These findings may provide valuable information to diagnosing, addressing and further preventing eutrophication problems in passive wastewater treatment systems. Additionally, these time series analysis methods are broadly applicable to a wide range of similar studies. |
Introduction
In facultative WSPs, algae provide an effective treatment mechanism for the removal of nutrients and the production of DO. In many of these systems, with sufficient nutrient loadings, algae form a symbiotic relationship with aerobic bacteria that creates an important cyclic treatment mechanism for nutrient removal from municipal wastewaters.1 Photosynthetic production of DO by algae enhances aerobic oxidation by heterotrophic bacteria, which in turn convert nutrient compounds such as ammonia and phosphate to more biologically available forms, which algae and other macrophytes can take up for cell growth.2–4 Large nutrient loads can lead to the excessive proliferation of algae and eutrophication of receiving environments.5 Additionally, light penetration in WSPs facilitates photosynthetic activity and algae growth, particularly for facultative and aerobic ponds.2 A symbiosis between algae and bacteria may develop in the upper layer of facultative WSPs, in which algal photosynthesis provides ample DO to fuel oxidation of N and P species into readily consumable forms by aerobic bacteria.1 With the diurnal fluctuation of photosynthetic activity, DO levels tend to vary over the course of a day, with a peak in levels during daylight hours and generally corresponding to maximum photosynthetic productivity, although time lags between the two peaks are noted by Dowd et al.6With excessive algae growth and during peak photosynthetic activity, pH levels can rise to above 9.0, as carbonate species (CO32− and HCO3−) are consumed to produce carbon dioxide (CO2) for cell growth and hydroxide (OH−) ions are left in excess.2,7–9 High pH levels (above 9.0) kill fecal coliforms but are harmful to the aquatic health of receiving environments.7,10,11 While individual fish species may tolerate certain pH levels, Falter and Cech12 noted that in many freshwater species, detrimental effects and mortalities are observed with pH levels of 9.0 and above. Strong statistical correlations between chlorophyll-a (chl-a), DO, and pH have been investigated and confirmed by Dowd et al.6 and Zang et al.13 Such correlations may also be time-lagged, reflecting the dynamic nature of algae growth and their subsequent influence on changes to water quality.6
A previous investigation of the Amherstview WPCP WSP system in eastern Ontario, Canada was carried out in the summer and fall of 2012 to determine the primary water quality parameters contributing to algae growth and pH fluctuations. This particular WSP system has experienced widespread algae blooms and pH levels that consistently exceed regulatory discharge limits for the final effluent. In a previous study of the three WSPs operated in series data for a range of parameters, including chl-a, DO, and pH, was collected on a weekly basis from July to October 2012.4 Correlations between chl-a and DO as well as chl-a and pH were found to be either negative or non-existent, and time-series analysis with a lag period of one week did not show any discernible trends. It was believed that time lags shorter than one week may have existed between these parameters, and thus warranted further exploration. This study presents the results of continuous monitoring of chl-a, DO, and pH over a period of one week within each WSP to determine and characterize the dynamic time lags between these parameters within each WSP system. Additional monitoring was conducted in the WSP#2 for a two-week period to characterize the effect of floating algae on diurnal DO and pH fluctuations.
Methods
Site background
The Amherstview WPCP, in Loyalist Township, Ontario, Canada, has three operating WSPs, which were each monitored over a one-week period. The WPCP currently treats an average of 3500 m3 per day and supports a population of over 10![[thin space (1/6-em)]](https://www.rsc.org/images/entities/char_2009.gif) 000. It consists of a direct, activated sludge treatment process, followed by tertiary treatment and effluent polishing in three facultative WSPs connected in series (Sutton Process). The direct activated sludge process was added to the WSP system in 1996, following their original construction, beginning in 1964.14 Due to historic numbering of the WSPs, they are numbered in order of flow as 2, 1, and 4 (Fig. 1), and have surface areas of 48600 m2, 28200 m2, and 31200 m2, respectively, based on 2012 aerial mapping (Table 1). They were constructed with operating depths of 1.37 m, 1.52 m, and 1.68 m, respectively (Table 1),14 but significant sediment accumulation over a number of years has reduced their average operating depths considerably. Depth profiling performed during the summer of 2012 estimated the current depths to be 1.61 m, 1.42 m, and 1.17 m, respectively (Table 1). Baffles were installed in each of the WSPs in 2009–2010 to increase the overall hydraulic residence time (HRT) of the system (Fig. 1).
000. It consists of a direct, activated sludge treatment process, followed by tertiary treatment and effluent polishing in three facultative WSPs connected in series (Sutton Process). The direct activated sludge process was added to the WSP system in 1996, following their original construction, beginning in 1964.14 Due to historic numbering of the WSPs, they are numbered in order of flow as 2, 1, and 4 (Fig. 1), and have surface areas of 48600 m2, 28200 m2, and 31200 m2, respectively, based on 2012 aerial mapping (Table 1). They were constructed with operating depths of 1.37 m, 1.52 m, and 1.68 m, respectively (Table 1),14 but significant sediment accumulation over a number of years has reduced their average operating depths considerably. Depth profiling performed during the summer of 2012 estimated the current depths to be 1.61 m, 1.42 m, and 1.17 m, respectively (Table 1). Baffles were installed in each of the WSPs in 2009–2010 to increase the overall hydraulic residence time (HRT) of the system (Fig. 1).
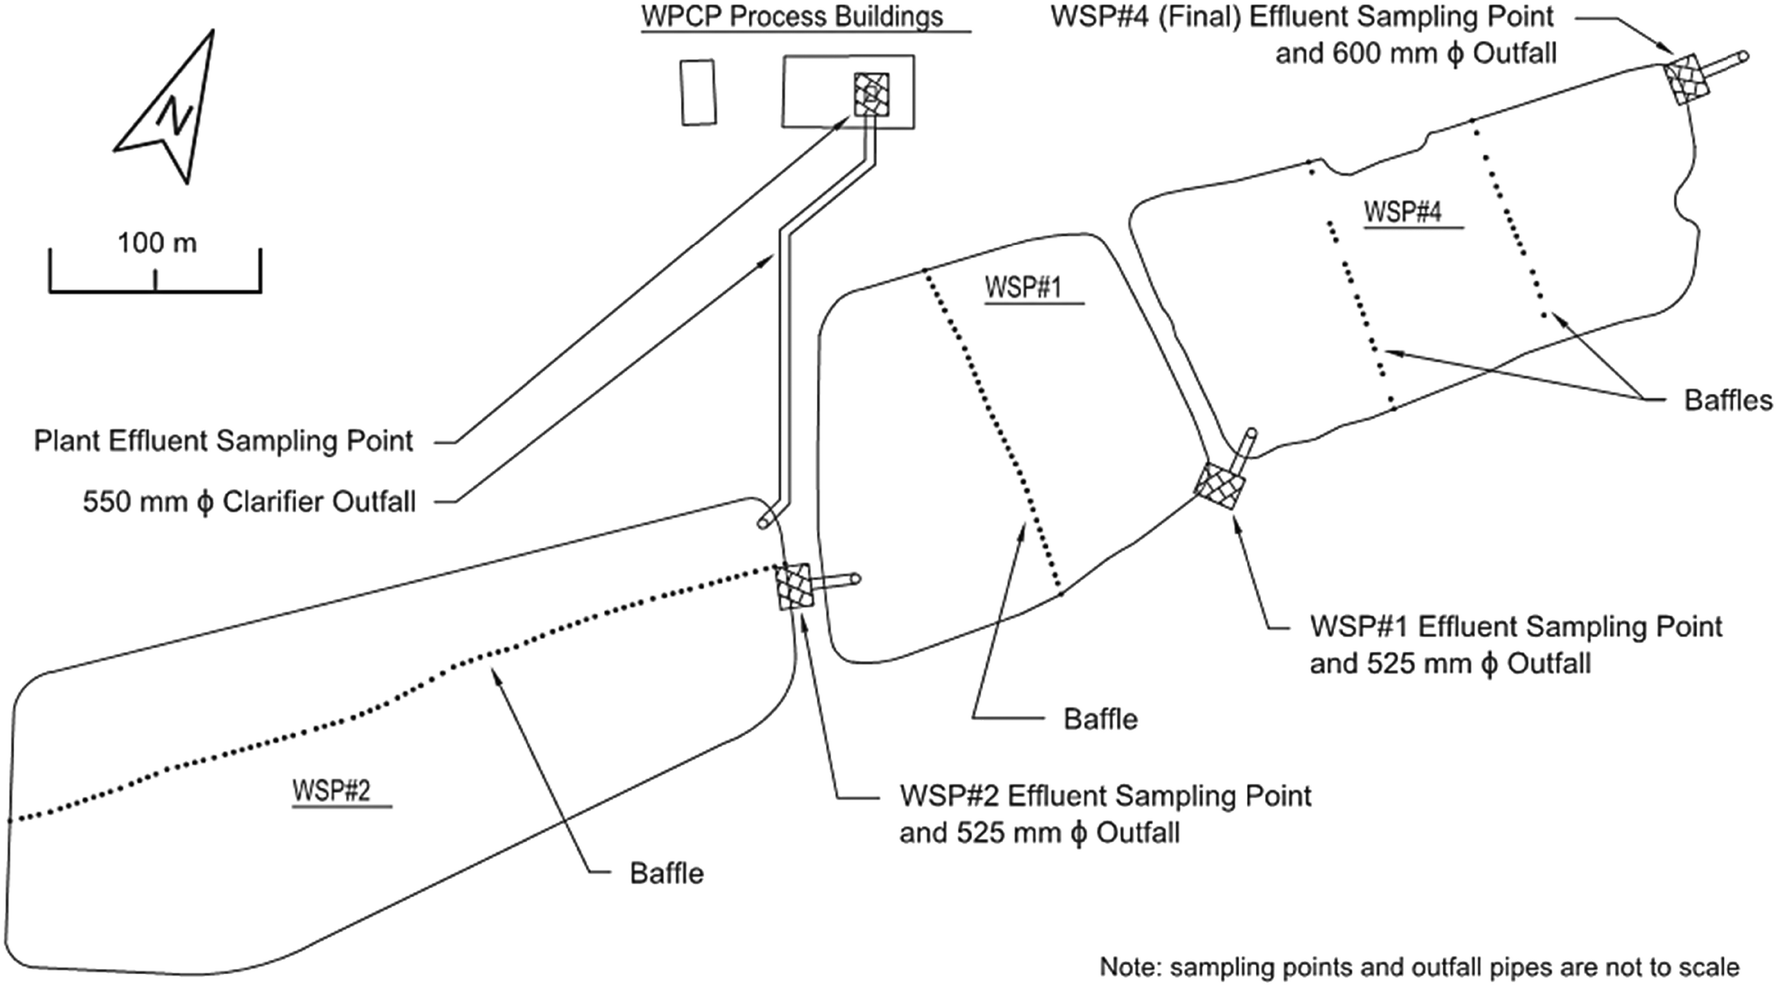 | ||
| Fig. 1 Amherstview WPCP WSP system overview, showing the configurations of WSP#2, WSP#1, and WSP#4. | ||
| WSP | Surface area (m2) | Volume (m3) | Depth (m) | Mean HRT (d) | ||||
|---|---|---|---|---|---|---|---|---|
| Design | Computed | Design | Computed | Design | Computed | Design | Computed | |
| 2 | 53400 |
48600 |
73200 |
78246 |
1.37 | 1.61 | 15 | 16 |
| 1 | 30400 |
28200 |
46200 |
40044 |
1.52 | 1.42 | 10 | 8 |
| 4 | 30400 |
31200 |
51100 |
36504 |
1.68 | 1.17 | 11 | 8 |
| Total | 114200 |
108000 |
170500 |
154794 |
4.57 | 4.2 | 36 | 33 |
Field monitoring
In 2013, monitoring was conducted at each of the three WSPs over a one-week period and considered pH, DO, chl-a, and temperature (June 19–26 for WSP#2, June 26–July 3 for WSP#1, and July 3–10 for WSP#4). To more fully assess the effect of the floating algae on diurnal fluctuations of DO and pH, WSP#2 was monitored further for an additional period of two weeks (July 23–August 6). All parameters were measured with a Hach© Hydrolab® DS5 multiparameter probe, which automatically logged data at one hour intervals. The probe was placed before the outfall weirs in the effluent chambers of each WSP at the centre of the flow path, at depths of approximately 0.5–1 meter for each WSP chamber.Statistical analysis
Statistical analysis consisted of time-series analysis and was conducted to identify time dependent relationships between chl-a, DO, pH, and solar radiation in an effort to better understand treatment performance and system dynamics. Time-series analysis involved computing cross-correlations between parameters using SAS© JMP® 10.0.0 software. Cross-correlation coefficients are values between −1 and 1 that indicate the strength of the relationship between two parameters, with one of the parameters offset to the other in time. A high cross-correlation coefficient magnitude indicates a strong statistical relationship between the parameters, with the sign indicating the relative directions of the changes between them. S.E. ranges were calculated for each WSP by JMP® according to eqn (1), where n represents the number of observations within the WSP. The S.E. represents an approximate 95% confidence interval;15 thus, cross-correlation coefficients outside of the S.E. range were generally considered to be statistically significant, as suggested by Meko.16 | (1) |
Results and discussion
Time series of chl-a, DO, and pH
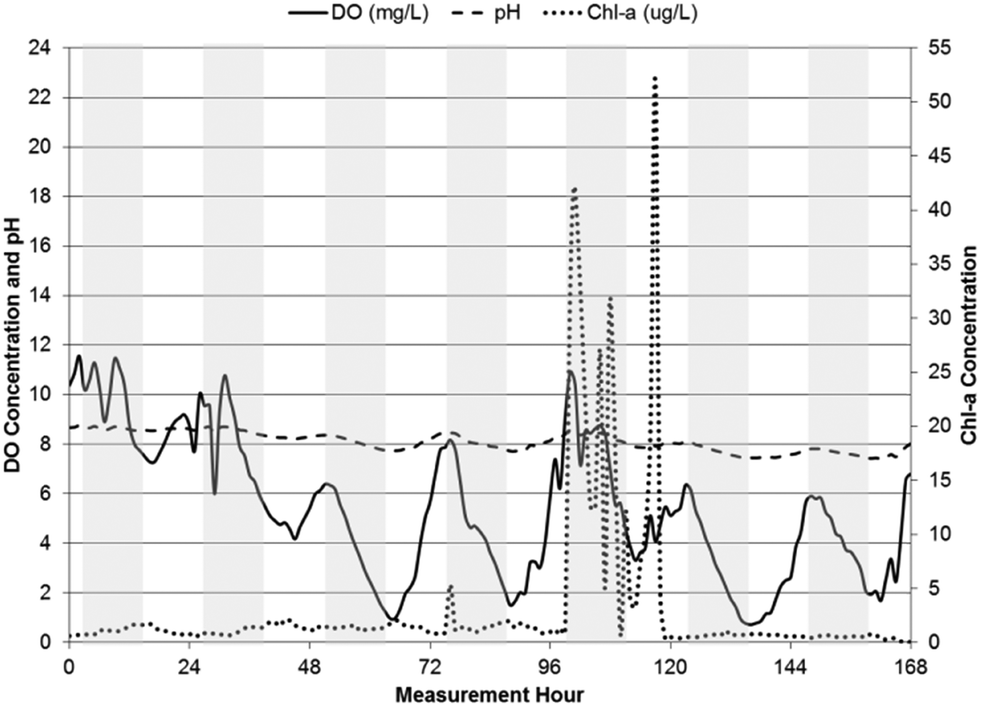
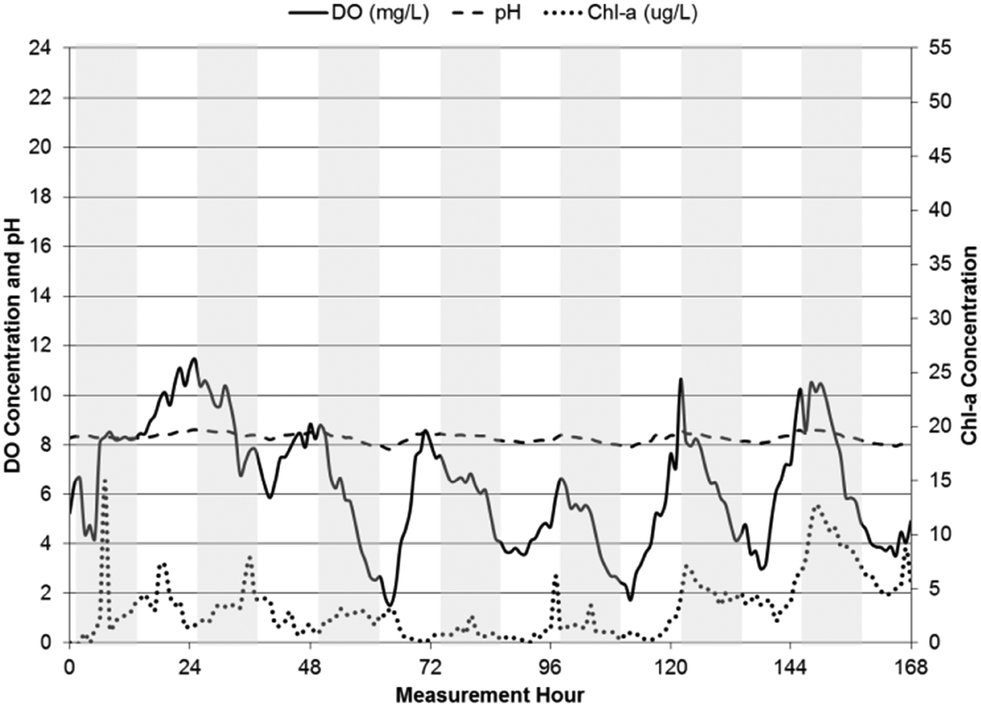
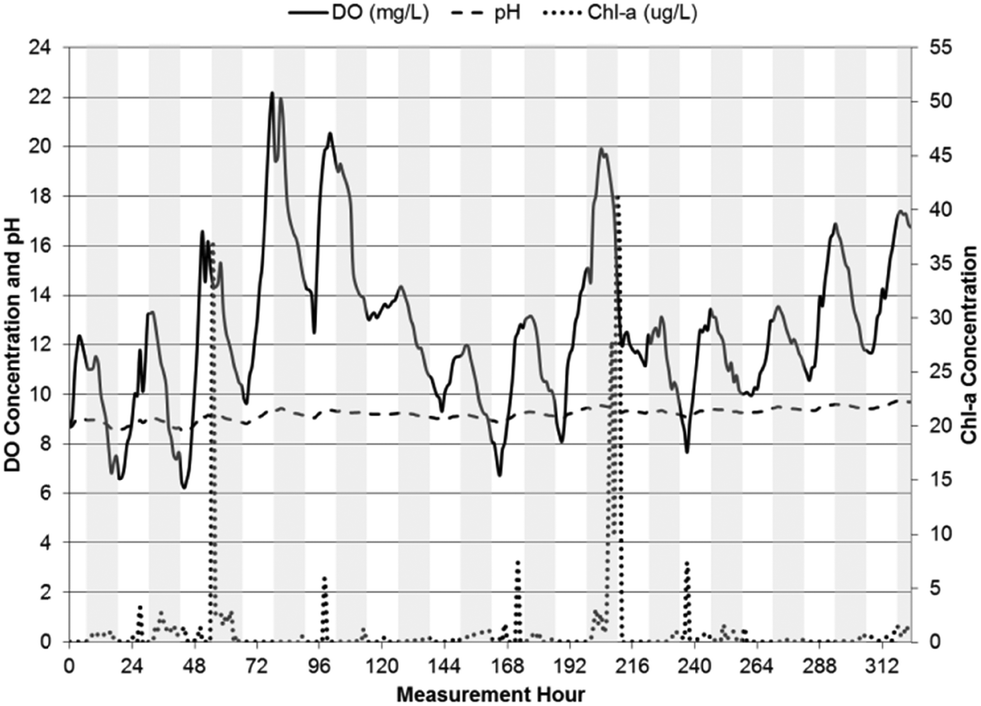
Site photographs taken during the monitoring period are presented in Fig. 2. Time-series plots of hourly measurements of pH and chl-a and DO concentrations are presented for WSP#2 (Fig. 3), WSP#1 (Fig. 4) and WSP#4 (Fig. 5). The time-series plot of hourly pH, chl-a, and DO for the subsequent two-week monitoring period for WSP#2 is presented in Fig. 6. Chl-a levels were highest in WSP#2, with an average concentration of 9.8 ± 6.6 μg L−1 during the first one-week period, but decreased considerably during the subsequent two-week period to an average concentration of 0.89 ± 4.2 μg L−1. The very low chl-a levels in WSP#2 during the subsequent two weeks of monitoring were likely due to the reduced algae growth observed in the field in this period. WSP#1 had an average chl-a concentration of 2.62 ± 6.7 μg L−1 (73% lower than in WSP#2 during the first one-week monitoring period) and WSP#4 had an average chl-a concentration of 3.2 ± 2.8 μg L−1 (65% lower than in WSP#2 during the first one-week monitoring period). There were no clear diurnal patterns in chl-a noted in any of the WSPs. The large standard deviations noted in the chl-a measurements is likely attributable to the inherent sources of error in environmental sampling, particularly with the fluorometric equipment used, as background fluorescence and interference of signals are known to occur. Background fluorescence and interference may have also contributed to the chl-a spikes observed in WSP#1 between hours 96 and 120 (Fig. 4).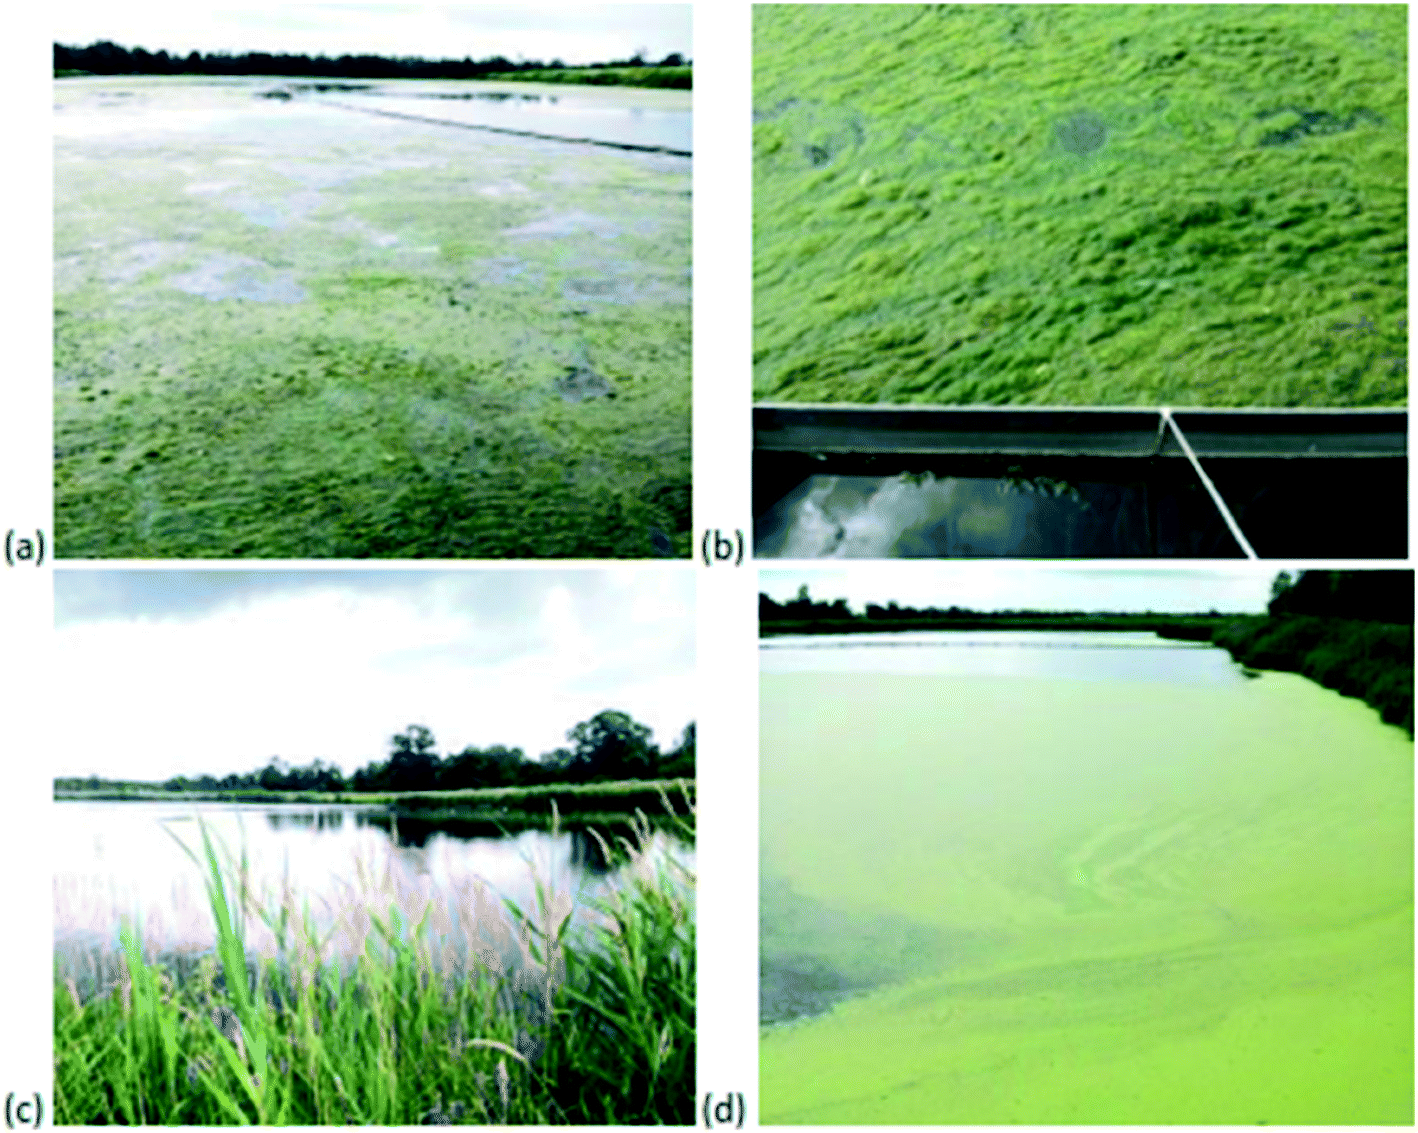 | ||
| Fig. 2 Site photographs taken July 11, 2013; (a) WSP#2 from effluent chamber; (b) floating algae in WSP#2 at effluent chamber (c) WSP#1 from west shore; (d) WSP#4 from effluent chamber. | ||
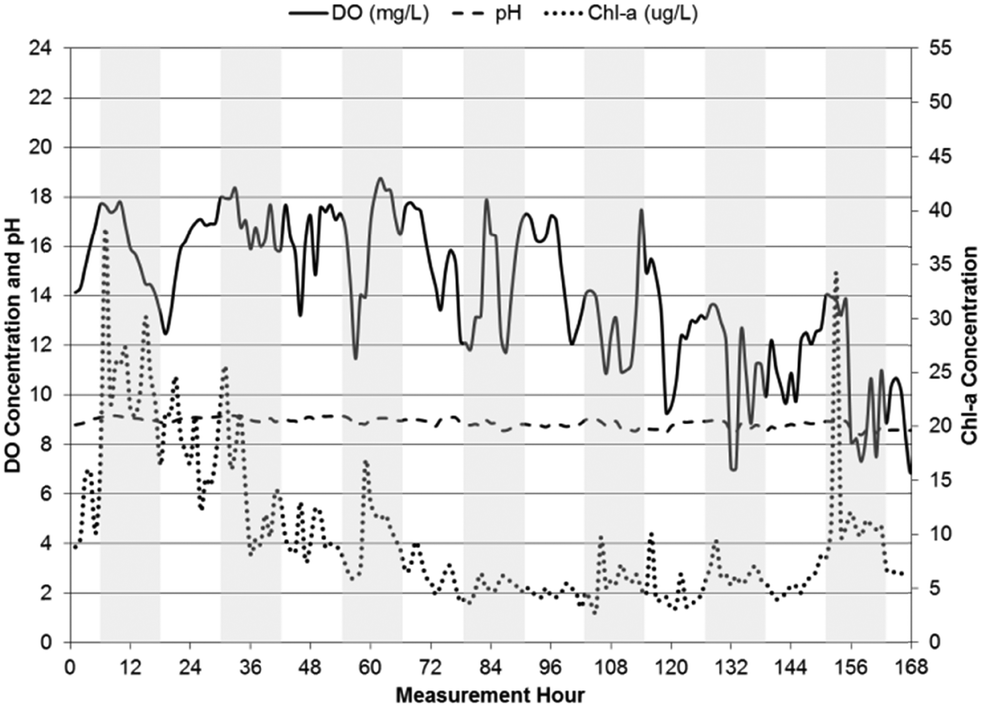 | ||
| Fig. 3 pH, DO, and chl-a time-series in WSP#2 from June 19, 2013 to June 26, 2013, with shaded bars indicating dark hours (7 pm–7 am). | ||
 | ||
| Fig. 4 pH, DO, and chl-a time-series in WSP#1 from June 26, 2013 to July 3, 2013, with shaded bars indicating dark hours (7 pm–7 am). | ||
 | ||
| Fig. 5 pH, DO, and chl-a time-series in WSP#4 from July 3, 2013 to July 10, 2013, with shaded bars indicating dark hours (7 pm–7 am). | ||
 | ||
| Fig. 6 pH, DO, and chl-a time-series in WSP#2 from July 23, 2013 to August 5, 2013, with shaded bars indicating dark hours (7 pm–7 am). | ||
pH levels remained relatively constant in each of the WSPs throughout their respective measurement periods, with the highest levels in WSP#2 at an average value of 8.9 ± 0.2 during the first one-week monitoring period and 9.2 ± 0.2 during the subsequent two-week monitoring period. Average pH values in WSP#1 and WSP#4 were 8.1 ± 0.4 and 8.3 ± 0.2, respectively. The pH levels across the WSPs corresponded to changes in chl-a levels across the system. In WSP#2 (during the subsequent two-week monitoring period but not the first one-week monitoring period), WSP#1 and WSP#4, a diurnal pattern in pH was observed, with levels rising until dusk and falling overnight. A diurnal pattern would be anticipated in a system with pH rises due to photosynthetic activity.1,2,7–9
DO levels were highest in WSP#2, with values exceeding 14 ± 2.9 mg L−1 on average in the first one-week period and 13 ± 3.2 mg L−1 on average in the subsequent two-week period. The high DO levels in WSP#2 in the first one-week period coincided with the high chl-a levels and large amounts of visible floating algae and plant growth (Fig. 2a and b) compared with the other WSPs (Fig. 2c and d). These high DO levels are known to be sufficient to cause auto-floatation of algae, where the higher partial pressure of the water from the DO gas pushes algal flocs to the surface;17,18 a phenomenon which appears to have occurred solely in WSP#2 (Fig. 2a and b). DO concentrations in WSP#1 and WSP#4 averaged 5.4 ± 2.8 mg L−1 and 6.3 ± 2.4 mg L−1, and were 62% and 55% lower than in WSP#2, respectively. Very few floating algal agglomerations (Fig. 2c) were noted in field observations for WSP#1, while in WSP#4, floating algae agglomerations and large areas covered by duckweed (a common aquatic macrophyte19) (Fig. 2d) were observed. Diurnal DO patterns were observed in all WSPs, with concentrations increasing throughout the daylight period and dropping during the night (7 pm–7 am). For WSP#2, a diurnal DO pattern was observed in the subsequent two-week monitoring period but not during the first one-week monitoring period. This pattern was not observed in the first one-week monitoring period in WSP#2, which was likely due to the near complete coverage of the WSP by floating algae, as discussed in another study.20
Cross-correlations of chl-a, DO, and pH
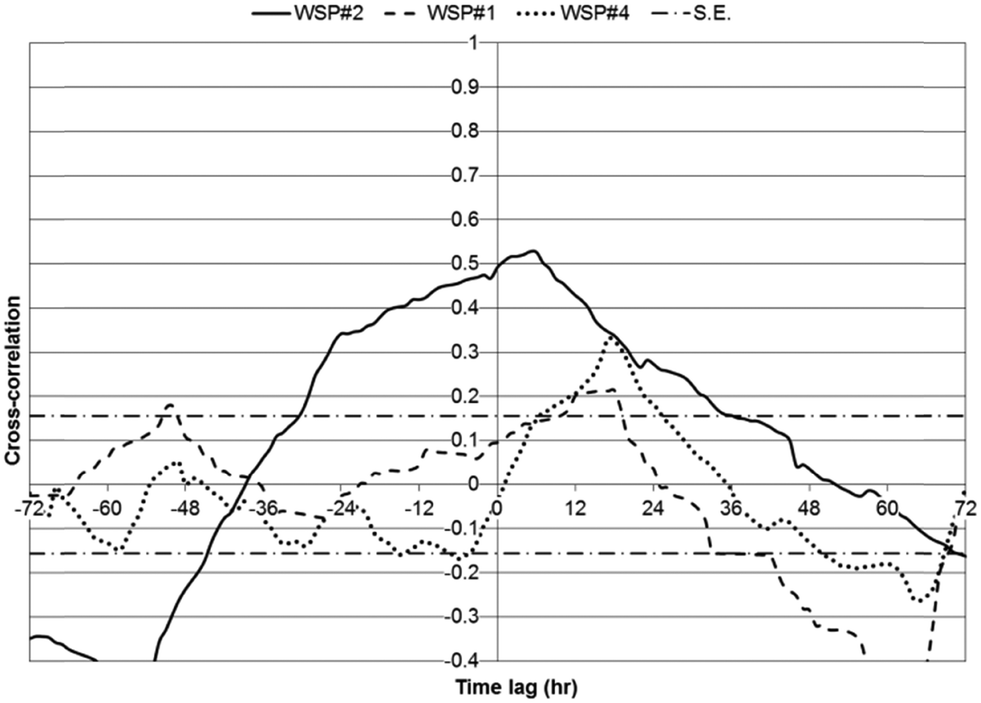
Two metrics were utilized to indicate statistical relationships between chl-a, DO, and pH: cross-correlations and the number of hours between daily peak values for parameters. Cross-correlations between chl-a, DO, and pH were investigated over a 72 hour lag period, using one hour lag time steps, for WSP#2 during the first one-week monitoring period (Fig. 7), WSP#1 (Fig. 8), and WSP#4 (Fig. 9). The data from the subsequent two-week monitoring period of WSP#2 were not included due to the very low chl-a readings measured. Strong positive correlations between chl-a, DO, and pH were anticipated based on the findings of Zang et al.13 The maximum cross-correlation coefficients for each set of parameters in each WSP and the lag time at which they occurred are presented in Table 2.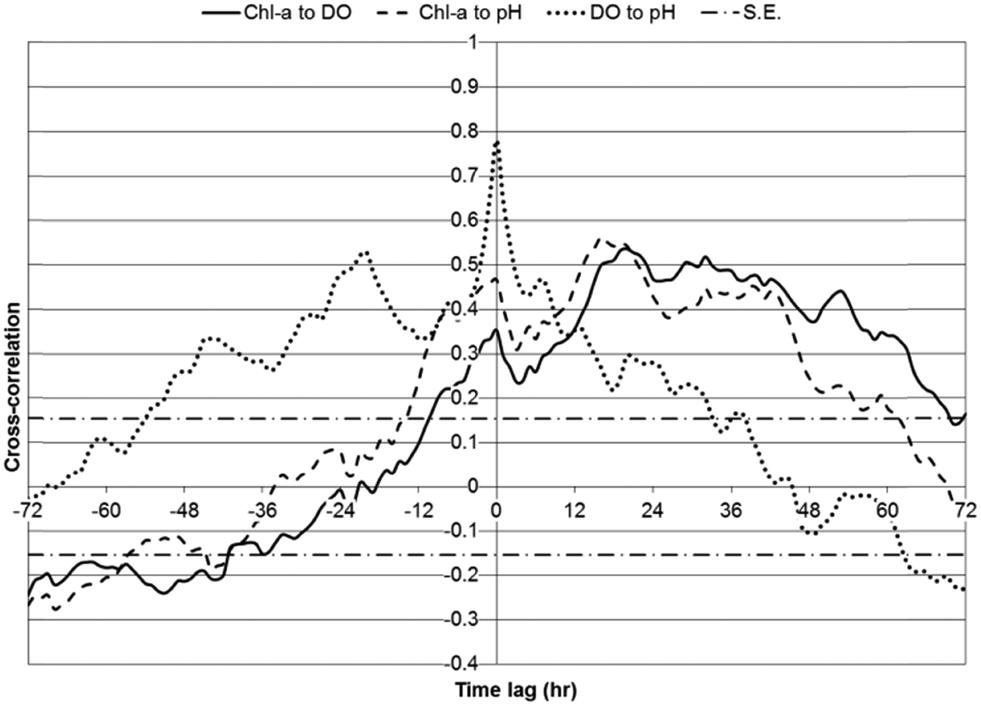 | ||
| Fig. 7 Cross-correlations between chl-a, DO, and pH for WSP#2 data (first one-week period) over a 72 hour lag period; the first variable in the series label is the input, second the output; with S.E. bars. | ||
 | ||
| Fig. 8 Cross-correlations between chl-a, DO, and pH for WSP#1 data over a 72 hour lag period; first variable in series label is the input, second the output; with S.E. bars. | ||
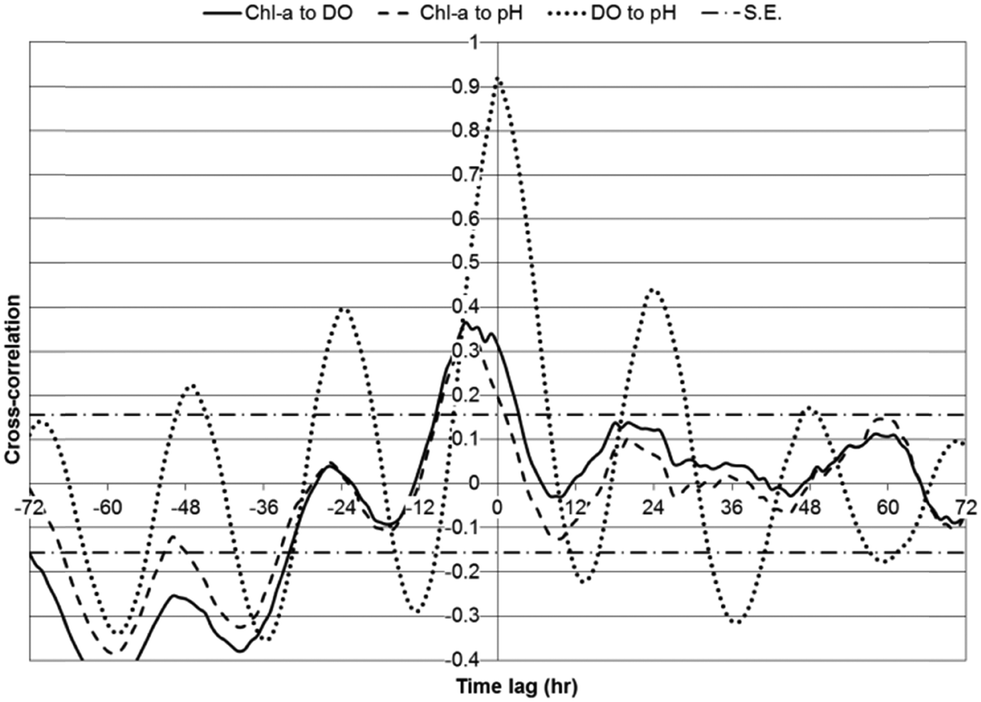 | ||
| Fig. 9 Cross-correlations between chl-a, DO, and pH for WSP#4 data over a 72 hour lag period; first variable in series label is the input, second the output; with S.E. bars. | ||
| Parameters | WSP#2 – first one-week monitoring period | WSP#1 | WSP#4 | WSP#2 – second two-week monitoring period | ||||
|---|---|---|---|---|---|---|---|---|
| LT (h) | CC | LT (h) | CC | LT (h) | CC | LT (h) | CC | |
| Chl-a to DO | 20 | 0.54 | −1 | 0.18 | −5 | 0.37 | −4 | 0.23 |
| Chl-a to pH | 16 | 0.56 | −1 | 0.12 | −4 | 0.33 | −4 | 0.11 |
| DO to pH | 0 | 0.78 | 0 | 0.91 | 0 | 0.92 | 0 | 0.69 |
The average periods during the day when the parameters were at a maximum, and the average difference in time between the maximums of parameters, are presented in Table 3. The maximum daily peaks for chl-a and DO were on average less than one hour apart, with DO leading by 43 minutes. The possible reasons for DO leading chl-a are further discussed. pH trailed chl-a by 2 hours and 15 minutes on average, and trailed DO by nearly 3 hours on average. The high standard deviations indicate large amounts of variability in the data and suggest a lack of a consistent pattern in the peak times and lags.
| Parameter | Averagei,ii | Standard deviation |
|---|---|---|
| Notes: (i) first variable in label is input, second is output; (ii) negative value indicates that output led input. | ||
| Times at which maximum daily values occur (hh:mm:ss) | ||
| Chl-a | 11:55:00 | 08:24:04 |
| DO | 11:12:30 | 08:29:24 |
| pH | 14:10:00 | 07:32:13 |
| Lag time between maximum daily values of parameters (hours) | ||
| Chl-a to DO | −0.71 | 9.23 |
| Chl-a to pH | 2.25 | 9.01 |
| DO to pH | 2.96 | 6.31 |
In WSP#2 during the first one-week monitoring period, significant positive cross-correlations were observed between chl-a and DO from lags of −10 to 69 hours, with the maximum cross-correlation (strongest statistical relationship) (0.54) having occurred at 20 hours (Fig. 7). The maximum significant positive cross-correlation between chl-a and DO (0.18) in WSP#1 was observed at a lag of −1 hour. And, in WSP#4, significant positive cross-correlations between chl-a and DO were observed at lags of −9 to 3 hours, with the maximum (0.37) having occurred at −5 hours. The significant cross-correlations in WSP#2 likely indicated that the higher DO levels may have been due, in part, to photosynthetic activity from high levels of algal growth (Fig. 2a and b). In the time-series analysis, chl-a was set as the input variable with respect to DO, thus the positive time lag for the significant cross-correlations suggested that DO was added to the system and continued to be added following increases in chl-a. Indeed, auto-regressive algae dynamics, as reported by Lee et al.,21 Lee et al.,22 and Liu et al.,23 may have occurred in these WSP's, whereby algal growth can be strongly influenced by previous growth, and DO would thus have continued to increase along with photosynthesis due to higher levels of algae. The positive cross-correlations between chl-a and DO that began at −10 hours and continued into the zero lag phase indicate that there was a certain amount of DO production that led chl-a growth in WSP#2 (Fig. 7).
The trend of DO leading chl-a in cross-correlations was continued in WSP#1 (Fig. 8) and WSP#4 (Fig. 9). The cross-correlations between DO and pH in WSP#1 and WSP#4 did not remain significant over the same length of time as the cross-correlations in WSP#2, suggesting that DO production from photosynthetic activity in WSP#1 and WSP#4 was less prolonged than in WSP#2. In WSP#1, only one significant cross-correlation (0.1761) occurred, at a lag of −1 hour. Reduced algal growth in this WSP, as indicated by the data and supported by field observation (Fig. 2c), may have resulted in more DO being consumed by aerobic bacteria than being produced by algae. WSP#1 algal growth was likely lower due to lower availability of nutrients and the proliferation of aquatic macrophytes, as noted in a previous study.20 Cross-correlations in WSP#4 between chl-a and DO were higher (0.365) than in WSP#1, and significant over a longer lag period (lasting 12 hours) (Fig. 9), suggesting a return to higher photosynthetic production occurred, though not to the same degree as in WSP#2. This primary production likely arose from both duckweed and algal growth, as field observations (Fig. 2d) suggested.
In all WSPs, the maximum daily peaks of DO tended to lead those of chl-a by an average of 0.71 hours (43 minutes) (Table 2). This trend was confirmed in all cross-correlation analyses (Fig. 7–9) and has been noted by Dowd et al.6 and Lee et al.21 In a time-series study examining chl-a, DO and temperature in a tidal lagoon over a 2 year period in Tracadie Bay, Prince Edward Island, Dowd et al.6 found that peak daily DO values led peak daily chl-a values by 4 hours on average. They noted that in an idealized scenario, this lead would be 8 hours, but that physical ocean conditions and cellular respiration likely closed the gap between the peaks of these two parameters.6 In a study of algae blooms in the coastal waters of Hong Kong, Lee et al.21 found positive cross-correlations (up to 0.33) between chl-a and DO up to a lag of 3 days (72 hours), with the DO data leading (as input), for dinoflagellate blooms. They noted that DO production from photosynthesis likely contributed to the correlations most strongly.
The diurnal patterns of DO changes were most apparent in WSP#1 (Fig. 4) and WSP#4 (Fig. 5) and provide further evidence that the DO in the system was most likely primarily produced by photosynthetic activity in sunlight and removed from the system at night or during heavy cloud cover when algae had reduced photosynthetic activity and underwent cellular respiration along with aerobic bacteria.24 The less visible diurnal pattern in WSP#2 during the first week of monitoring (Fig. 3) may have been due to the excessive levels of floating algae and the potentially supersaturated state of the system with respect to DO solubility. The excessive algal growth noted in WSP#2 may have driven DO levels above saturation, which may in turn have caused auto-floatation of the algae biomass, as has been noted to occur in similar systems by Arbelaez et al.17 and Boyd et al.18 During the subsequent two weeks of monitoring in WSP#2, lower chl-a levels and a reduced presence of the floating algae cover was observed in the data and in the field, respectively. DO levels remained high throughout, however, and a distinct diurnal pattern was observed (Fig. 6). These findings would support the idea that the presence of excessive floating algae may have been responsible for retaining DO within the water column during the night time, thus preventing the expression of a diurnal pattern.
Strong positive correlations between chl-a and pH were anticipated based on the findings of Zang et al.13 In WSP#2 during the first one-week monitoring period, significant positive cross-correlations were observed between chl-a and pH from lags of −13 to 61 hours, with the maximum cross-correlation (0.56) having occurred at 16 hours (Fig. 7). No significant positive cross-correlations were observed between chl-a and pH in WSP#1 (Fig. 8), and, in WSP#4, significant positive cross-correlations between chl-a and pH were observed at lags of −9 to 1 hours, with the maximum (0.33) having occurred at −4 hours (Fig. 9). The strongest cross-correlations between chl-a and pH were observed in WSP#2 (Fig. 7), where algal growth was highest. There was a large time lag window where chl-a led pH, which would suggest that pH levels rose after the onset of photosynthesis and as it continued. No significant positive cross-correlations between chl-a and pH were observed in WSP#1 (Fig. 8), which may be due to the lower photosynthetic activity in the WSP, as noted by average chl-a levels and observed in the field. In WSP#4, significant positive cross-correlations between chl-a and pH were observed for lags of −9 to 3 hours (Fig. 9). The negative lag period for the significant cross-correlations in WSP#4 suggested that pH led chl-a, which, unlike DO leading chl-a, would not be expected. This would not be expected due to the fact that pH rise from photosynthetic activity is caused by the consumption of carbon dioxide from the water and is part of the process itself and could not precede it.1,7 Rather, the pH lead over chl-a in WSP#4 may indicate that pH changes were due to other factors such as aerobic oxidation of waste. Indeed, when all WSPs are considered, the maximum daily peaks of chl-a tended to lead those of pH by an average of 2.25 hours (Table 3). This lead was likely heavily influenced by the dynamics in WSP#2, where the majority of photosynthetic activity was noted (during the first one-week monitoring period).
Strong cross-correlations between DO and pH were found in all WSPs, particularly in WSP#1 (Fig. 8) and WSP#4 (Fig. 9). These cross-correlations exhibited a very well-defined diurnal pattern, with increases and decreases following a sinusoidal shaped curve with a 12 hour period. Cross-correlations between chl-a and DO, and chl-a and pH closely resembled each other in terms of curve shape over the time-series lag period for all WSPs. The strong and statistically significant cross-correlations between DO and pH in all WSPs would suggest that the two parameters changed similarly due to algal growth. In WSP#1 (Fig. 8) and WSP#4 (Fig. 9), the cross-correlation curves between DO and pH were sinusoidal with phase lengths of 12 hours, indicating that both parameters likely underwent strong diurnal changes and were impacted by algal growth at the same times during the day. At lags of 12 hour periods, one parameter was in a daytime phase while the other was in the night-time phase, and both changed in the opposite direction, resulting in the lower or negative cross-correlations between them. The cross-correlation curve for WSP#2 during the first one-week monitoring period (Fig. 7) was less prominent, which, as previously discussed, was most likely due to the effect of the floating algal biomass. It should be noted that the smaller degree of variation in pH compared with chl-a and DO in the time series (Fig. 3–5) likely made chl-a or DO the dominant contributor to the calculation of the cross-correlations. However, as cross-correlations are relative to the means of the individual parameters, they were still valid and useful for understanding the dynamic relationships between the parameters.
Cross-correlations between chl-a and daily horizontal solar insolation for each WSP (for WSP#2, first one-week monitoring period included only), over a lag period of 72 hours, are presented (Fig. 10). Ground solar insolation data for the area was obtained from the NASA SSE database, available through NRC's RETScreen® software, and is in units of kilowatt hours (kW h) per m2 per day.25 In WSP#2, significant positive cross-correlations were observed from lags of −30 to 32 hours and the maximum cross-correlation (0.53) occurred at 5 hours. In WSP#1, significant positive cross-correlations were observed from lags of 10 to 19 hours and the maximum cross-correlation (0.21) occurred at 16 hours. In WSP#4, significant positive cross-correlations were observed at 7 to 25 hours and the maximum cross-correlation (0.33) occurred at 17 hours. The statistically significant positive cross-correlations between solar radiation and chl-a observed in all WSPs thus suggests that there was a strong dependence between the amount of solar energy available, photosynthetic activity, and the resulting chl-a biomass produced.
 | ||
| Fig. 10 Cross-correlations between solar radiation and chl-a for all WSPs over a 72 hour lag period; solar radiation as input, chl-a as output; with S.E. bars. | ||
Conclusions
This study involved the evaluation of time-series relationships between chl-a, DO, and pH in three facultative WSPs at a wastewater treatment plant in eastern Ontario, Canada. Since 2003, the three in-series WSPs operating have experienced high pH levels and excessive algal growth in the summer months. Hourly samples of chl-a, DO, pH, and temperature were taken at the effluent of each WSP for one week during the summer of 2013. An additional two weeks of monitoring was conducted in WSP#2 to better understand trends observed. Time-series analysis, consisting of cross-correlation evaluation, was performed on the dataset to determine the time-dependent relationships between chl-a, DO, and pH.It was found that strong statistical dependence between chl-a, DO, and pH were present in the WSPs when high levels of photosynthetic activity occurred; as indicated by chl-a concentrations and field observations. WSP#2 had the highest algal growth and the statistical relationships between chl-a and DO and chl-a and pH were strongest, with maximum cross-correlation coefficients of 0.54 and 0.56 observed at lags of 20 and 16 hours for DO and pH, respectively. Strong diurnal patterns for DO and pH were observed in WSP#1 and WSP#4, and in WSP#2 during a period of reduced algal growth. The near complete coverage of WSP#2 surface by floating algae during the period of excessive algal growth was noted to have likely retained DO in the water column during the night time, which is why no diurnal pattern was observed. In general across all WSPs, daily DO concentration peaks led those of chl-a by an average of 43 minutes, while daily chl-a peaks led those of pH by an average of 2 hours and 15 minutes. Solar radiation was noted to be strongly correlated to chl-a concentrations in all WSPs, indicating good conversion from photosynthetic activity to chl-a growth in the WSPs.
The results of this study provide strong evidence that the relationships between algal growth and the production of DO and the elevation of pH levels in water systems are time-dependent. These findings may provide valuable information to WSP system operators experiencing similar eutrophication problems, as the timing of changes in chl-a, pH, and DO may be predicted and addressed pre-emptively. Additionally, the nature of these relationships and the parameters involved are found in all water systems, supporting the use of the time-series analysis methods presented in this study on a wide variety of water resources studies.
Acknowledgements
The authors acknowledge the following people involved with the study: the technical staff at the Queen's Genomics Lab at Ongwanada for their assistance in metagenomics sequencing; MJ Merritt, Sheila Buck, and Lorie McFarland at Loyalist Township for their assistance with sampling, technical background, and site information; Caduceon Laboratories for their contribution to the laboratory analysis; and Stan Prunster for his guidance in the Queen's Department of Civil Engineering laboratory. The authors acknowledge the following organizations for their financial support: the Natural Sciences and Engineering Research Council (NSERC) under a Collaborative Research and Development (CRD) grant, NSERC under the Systems Training and Education in Water Assets Research and Development (STEWARD) Collaborative Research and Training Experience Program (CREATE), and the Canada Research Chair (CRC) program for Dr. Champagne's Chair in Bioresource Engineering.References
- N. Shammas, L. Wang and Z. Wu, Waste Stabilization Ponds and WSPs, in Volume 8: Biological Treatment Processes, Handbook of Environmental Engineering, Humana Press, Totowa, New Jersey, 2009, pp. 315–370 Search PubMed.
- R. Crites and G. Tchobanoglous, Small and Decentralized Wastewater Management Systems, WCB/McGraw-Hill, Boston, Massachusetts, 1998 Search PubMed.
- Metcalf & Eddy, Inc., Wastewater Engineering: Treatment, Disposal, and Reuse, revised by G. Tchobanoglous, F. L. Burton and H. D. Stensel, McGraw-Hill, Toronto, Canada, 2003 Search PubMed.
- J. Wallace, P. Champagne and G. Hall, Multivariate Statistical Analysis of Water Chemistry Dynamics in Three Facultative Wastewater Stabilization Ponds with Algae Blooms and pH Fluctuations, Water Res., 2016, 96(1), 155–165 CrossRef CAS PubMed.
- V. Smith, S. Joye and R. Howarth, Eutrophication of freshwater and marine ecosystems, Limnol. Oceanogr., 2006, 51(1), 351–355 CrossRef CAS.
- M. Dowd, F. Page and R. Losier, Time Series Analysis of Temperature, Salinity, Chlorophyll and Oxygen Data from Tracadia Bay, PEI, Can. Tech. Rep. Fish. Aquat. Sci., 2002, 2441:iii + 86 p Search PubMed.
- S. Kayombo, T. Mbwette, J. Katima, N. Ladegaard and S. Jorgensen, Waste Stabilization Ponds and Construction Wetlands Design Manual, 2005. [Online]. Available: http://www.unep.or.jp/letc/WS/publications.asp.. [Accessed 18 01 2011] Search PubMed.
- L. Barsanti and P. Gualtieri, Algae: Anatomy, Biochemistry, and Biotechnology, CRC Press, Boca Raton, Florida, 2006 Search PubMed.
- M. Veeresh, A. Veeresh, B. Huddar and B. Hosetti, Dynamics of industrial waste stabilization pond treatment processes, Environ. Monit. Assess., 2010, 169, 55–65 CrossRef CAS PubMed.
- D. Spuhler, Waste Stabilization Ponds, Sustainable Sanitation and Water Treatment, 2011. [Online]. Available: http://www.sswm.info/category/implementation-tools/wastewater-treatment/hardware/semi-centralised-w. [Accessed 18 01 2012] Search PubMed.
- W. Viessman, M. Hammer, E. Perez and P. Chadik, Water Supply and Pollution Control, Pearson Prentice Hall, Upper Saddle River, New Jersey, 2009 Search PubMed.
- M. Falter and J. Cech, Maximum pH Tolerance of Three Klamath Basin Fishes, Copeia, 1991, 4, 1109–1111 CrossRef.
- C. Zang, S. Huang, M. Wu, S. Du, M. Scholz, F. Gao, C. Lin, Y. Guo and Y. Dong, Comparison of Relationships Between pH, Dissolved Oxygen, and Chlorophyll a for Aquaculture and Non-aquaculture Waters, Water, Air, Soil Pollut., 2011, 219, 157–174 CrossRef CAS.
- CH2M Gore and Storrie Limited, Amherstview Water Pollution Control Plant - Operating Manual, 1997 Search PubMed.
- SAS Institute Inc., User Guide, JMP10 [software], 2013 Search PubMed.
- D. Meko, Lagged Correlation, GEOS 585 A Class Notes, 2013. [Online]. Available: http://www.ltrr.arizona.edu/~dmeko/notes_10.pdf. [Accessed 15 07 2013] Search PubMed.
- J. Arbelaez, B. Koopman and E. Lincoln, Effects of Dissolved Oxygen and Mixing on Algal Autoflotation, J. - Water Pollut. Control Fed., 1983, 55(8), 1075–1079 CAS.
- C. Boyd, B. Watten, V. Goubier and R. Wu, Gas Supersaturation in Surface Waters of Aquaculture Ponds, Aquac. Eng., 1994, 13, 31–39 CrossRef.
- R. Leng, Duckweed: A tiny aquatic plant with enormous potential for agriculture and environment, 1999. [Online]. Available: http://www.fao.org/ag/aginfo/resources/documents/DW/Dw2.htm. [Accessed 11 06 2013] Search PubMed.
- J. Wallace, P. Champagne, G. Hall and X. Liu, Determination of Algae and Macrophyte Species Distribution in Three Wastewater Stabilization Ponds Using Metagenomics Analysis, Water, 2015, 7, 3225–3242 CrossRef.
- J. Lee, I. Hodgkiss, K. Wong and I. Lam, Real Time Observations of Coastal Algal Blooms by an Early Warning System, n.d.. [Online]. Available: http://intranet.waterman.hku.hk/download.aspx?pdf=redtide-dynamics-revisedtext(may17).pdf. [Accessed 31 07 2013] Search PubMed.
- J. Lee, Y. Huang, M. Dickman and A. Jayawardena, Neural network modelling of coastal algal blooms, Ecol. Modell., 2003, 159, 179–201 CrossRef CAS.
- G. Liu, W. Li, K. Leung, J. Lee and A. Jayawardena, Modelling algal blooms using vector autoregressive model with exogenous variables and long memory filter, Ecol. Modell., 2007, 200, 130–138 CrossRef.
- W. Dodds, Freshwater Ecology: Concepts and Environmental Applications, Elsevier Academic Press, Waltham, Massachusetts, 2002 Search PubMed.
- National Aeronautic and Space Administration (NASA), Surface meteorology and Solar Energy (SSE) Release 6.0 Methodology, Version 3.1 [software], 2012 Search PubMed.
| This journal is © The Royal Society of Chemistry 2016 |