 Open Access Article
Creative Commons Attribution 3.0 Unported Licence
Mimicking the topography of the epidermal–dermal interface with elastomer substrates
Priyalakshmi
Viswanathan†
a,
Murat
Guvendiren†
b,
Wesley
Chua
a,
Stephanie B.
Telerman
a,
Kifayathullah
Liakath-Ali
a,
Jason A.
Burdick‡
*b and
Fiona M.
Watt‡
*a
aCentre for Stem Cells and Regenerative Medicine, King's College London, 28th Floor, Tower Wing, Guy's Hospital, Great Maze Pond, London SE1 9RT, UK. E-mail: Fiona.watt@kcl.ac.uk; Tel: +44 20 7188 5608
bDepartment of Bioengineering, University of Pennsylvania, 240 Skirkanich Hall, 210 S. 33rd Street, Philadelphia, PA 19104, USA. E-mail: burdick2@seas.upenn.edu; Tel: +1 215-898-8537
First published on 27th November 2015
Abstract
In human skin the interface between the epidermis and dermis is not flat, but undulates. The dimensions of the undulations change as a function of age and disease. Epidermal stem cell clusters lie in specific locations relative to the undulations; however, whether their location affects their properties is unknown. To explore this, we developed a two-step protocol to create patterned substrates that mimic the topographical features of the human epidermal–dermal interface. Substrates with negative patterns were first fabricated by exposing a photocurable formulation to light, controlling the topographical features (such as diameter, height and center-to-center distance) by the photomask pattern dimensions and UV crosslinking time. The negative pattern was then translated to PDMS elastomer to fabricate substrates with 8 unique surface topographies on which primary human keratinocytes were cultured. We found that cells were patterned according to topography, and that separate cues determined the locations of stem cells, differentiated cells and proliferating cells. The biomimetic platform we have developed will be useful for probing the effect of topography on stem cell behaviour.
Insight, innovation, integrationBiological insight: in human skin the interface between the epidermis and the underlying connective tissue, the dermis, undulates and stem cells cluster where the basal layer is closest to the tissue surface. Technological innovation: to explore whether stem cells respond to the topography of the epidermal–dermal interface we developed new PDMS culture substrates differing in height and spacing of the length scales observed in adult and ageing epidermis. Benefit of integration: by studying the behaviour of keratinocytes on a panel of topographies we found that the position of stem cell clusters is determined by specific topographical cues, and that different cues control the location of proliferating and differentiating cells. This new experimental platform facilitates studies of how changes in topography with age and disease impact epidermal stem cell behaviour. |
1. Introduction
At the single cell level, the effect of topography on substrate interactions has been widely explored. A variety of patterns at the micro- to nano-scale have been investigated, including grooves, pillars, holes and fibers.1–6 This work has shown that surface topography directly affects many aspects of cell behaviour, such as morphology, spreading, cytoskeletal arrangement, motility and gene regulation. It is also clear that geometrical ordering of topographies regulates the fate of a variety of stem cell types.2,7,8, In addition, feature scale and dimensions are known to be important determinants of the cellular response. Despite these findings, culture systems that mimic tissue-level topographies have not yet been fabricated.Human skin represents an experimentally tractable model with which to explore tissue-level topographical features. The interfollicular epidermis is the multi-layered epithelium that forms the outer covering of the skin.9 Proliferation takes place in the basal layer of epidermal cells (keratinocytes) that are attached to an underlying basement membrane. Cells stop dividing as they leave the basal layer and they undergo terminal differentiation as they move through the suprabasal layers. The outermost cell layer comprises dead cells that are exquisitely specialised to provide a protective interface with the external environment.
Epidermal maintenance depends on stem cells in the basal layer that divide to produce either stem cells that remain in the basal layer or cells that are destined to undergo terminal differentiation in the suprabasal layers. The basal cell compartment is heterogeneous, since at least two different stem cell subpopulations have been described10 and there are also basal cells that are committed to undergo terminal differentiation after a few rounds of division (usually referred to as transit amplifying cells).11 Primary human keratinocytes can be cultured from skin biopsies as stratified sheets in which the stem cell compartment is maintained in the basal layer and terminal differentiation occurs in the suprabasal layers.12 A range of cell surface markers that enrich for human epidermal stem cells in vivo and in culture have been identified, including high expression of β1 integrins, melanoma chondroitin sulphate proteoglycan (MCSP), LRIG1, CD46 and the Notch ligand Delta-like 1 (DLL1).10,13,14
The epidermal–dermal interface in postnatal human skin is not flat, but undulates. The regions where the epidermis projects deepest into the dermis are called the rete ridges. The rete ridges develop during mid-gestation and prior to that the epidermal–dermal junction is flat.15 The height of the rete ridges declines during skin ageing16–18 and, conversely, increases when the skin is hyperproliferative, for example in psoriatic lesions.19 In most body sites the stem cells lie in clusters outside the rete ridges, where the epidermal basal layer comes closest to the skin surface.13,20 The stem cell clusters are relatively depleted of dividing cells and cells that are committed to differentiate.20,21 This has led to the concept that cells can differentiate directly into the suprabasal layer from stem cell clusters without further rounds of division, or can, alternatively, move laterally within the basal layer from the clusters along the rete ridges, undergoing several amplifying divisions prior to the onset of differentiation.13,20
When primary human keratinocytes form stratified sheets on conventional flat culture substrates, the stem cells self-organise into clusters and stem cell number is subject to auto-regulation, such that it is unaffected by the proportion of stem cells initially seeded.13,22 This is due, at least in part, to expression of DLL1, which promotes intercellular cohesiveness and signals to neighbouring cells to differentiate.14,23 The in vitro observations are consistent with the finding that clusters of cells expressing high integrin levels appear prior to rete ridge formation in developing skin.24
Human interfollicular epidermis (IFE) can readily be reconstituted in culture and has, for decades, been used to treat burn patients.12 There are well-characterised markers of IFE stem cells and differentiated cells, and several key regulatory pathways are known. Nevertheless, the significance of the topography of the rete ridges is largely unexplored. This is because mouse skin lacks rete ridges, and in human skin the ridges influence other aspects of tissue physiology, such as proximity to blood vessels, confounding the analysis.17 It has also proved difficult to explore in vitro, because although keratinocytes can reconstitute an epidermis when seeded onto decellularised dermis, the dermal topography collapses, tears develop and cells migrate into empty hair follicles, creating false rete ridges.23 For these reasons, we set out to develop a model material system that supports the growth of cultured human keratinocytes and mimics the topography of the epidermal–dermal junction.
2. Materials and methods
2.1. Sectioning and staining skin
All experiments with human tissue were performed in accordance with the relevant laws and institutional guidelines. Human embryonic and fetal tissues were obtained with appropriate ethical approval from the UK Human Developmental Biology Resource (http://www.hdbr.org). Adult surgical waste skin was obtained from the King's Health Partners Cancer Biobank (HTA Licence No: 12121, REC No: 12-EE-0493). Tissue samples for sections were embedded in Optimal Cutting Temperature compound (OCT). 14 μm sections were fixed in 4% paraformaldehyde (Sigma), prepared and stained with haematoxylin and eosin (H&E). H&E stained images were acquired on a Hamamatsu Nanozoomer 2.0 rs. For confocal imaging, 14 μm frozen sections and 60 μm horizontal whole mounts were stained with antibodies to keratin 14 (K14), integrin β1 and integrin α6, with appropriate secondary antibodies, as described previously.25 The preparation and staining procedure for epidermal sheet whole mounts was modified from the mouse tail epidermal whole mount protocol as described previously.26 Briefly, adult skin pieces were treated with dispase overnight at 4 °C. Epidermis was gently peeled off and fixed immediately in 4% paraformaldehyde (Sigma) for 1 h at room temperature and washed with PBS before antibody staining.2.2. Fabrication of patterned PDMS substrates
Hydroxyethyl methacrylate (HEMA, 5 mL, 98%, from Alfa Aesar) monomers were mixed with a photoinitiator, Darocur 1173 (150 μL, from Ciba Specialty Chemicals), in a glass vial. The mixture was exposed to UV light (UVP Black Ray, 8 mV cm−2) for 60, 25 and 20 second intervals in a sequence, with gentle mixing after each interval, to obtain a viscous, partially polymerized PHEMA precursor solution. In a separate vial, the crosslinker, ethylene glycol dimethacrylate (EGDMA, 50 μL, from Polysciences), was mixed with additional Darocur 1173 (100 μL), and the mixture was added into the PHEMA precursor to prepare a photocurable molding precursor. The photocurable precursor solution remained stable for several months when kept dark.To fabricate negative patterns, the molding precursor was cast on a methacrylated glass slide (prepared as described previously,27 and covered with a flat PDMS film). A photomask was placed on the glass slide 1 mm in thickness and exposed to UV light (10 mW cm−2, 365 nm Omnicure S1000 UV Spot Cure System, Exfo Life Sciences Division). The molding precursor crosslinked spatially only at the regions where light could pass through the photomask, creating negative patterns (or holes) on the PHEMA film. After UV exposure, the PDMS was peeled off immediately, and the PHEMA film was washed several times with ethanol and water to remove the uncrosslinked polymers. The PHEMA film with negative patterns was used as a mold to form PDMS films with positive surface patterns. For this purpose, the PDMS precursor mixed with the curing agent (10![[thin space (1/6-em)]](https://www.rsc.org/images/entities/char_2009.gif) :
:![[thin space (1/6-em)]](https://www.rsc.org/images/entities/char_2009.gif) 1 ratio by weight, Sylgard 184® Silicone Elastomer Kit, Dow Corning) was poured onto the PHEMA mold (film with negative patterns), followed by thermal curing at 65 °C for 12 hours. The PDMS film was then carefully peeled off from the PHEMA mold. The dimensions of the patterns were defined by the photomask and the amplitude was controlled by the UV exposure time, such that longer exposure times resulted in larger skin formation and decreased the pattern depths.
1 ratio by weight, Sylgard 184® Silicone Elastomer Kit, Dow Corning) was poured onto the PHEMA mold (film with negative patterns), followed by thermal curing at 65 °C for 12 hours. The PDMS film was then carefully peeled off from the PHEMA mold. The dimensions of the patterns were defined by the photomask and the amplitude was controlled by the UV exposure time, such that longer exposure times resulted in larger skin formation and decreased the pattern depths.
Three different masks were used, composed of dark circles in a hexagonal order, with circle diameter (d) and center-to-center distance (λ) equal to 150 and 300 microns, 200 and 300 microns, and 100 and 150 microns. The UV exposure times were 20, 30 and 40 s. To consistently fabricate substrates with high fidelity, epoxy masters (identical to PHEMA negative patterns), individual patterns or in combination, were fabricated from first generation PDMS patterns. The samples were imaged by scanning electron microscopy (SEM, JEOL 7500F HRSEM, Penn Regional Nanotechnology Facility). We used standard flat and 90° SEM specimen mounts to obtain images from top and cross-sectional views. Top view (using standard flat mount) was used to measure center-to-center (peak-to-peak) distance, and cross-sectional view (from 90° mount) was used to measure the amplitude and center-to-center distance. For each condition, we used at least 3 samples to obtain the images. The whole sample was used for top images. Images for cross-sectional view were obtained by cutting each sample vertically (at least 3 slices were used for each sample). Quantitative data was generated using NIH ImageJ.
The PDMS patterns were bonded to glass coverslips using PDMS pre-polymer and cured at 80 °C for 1 h. Substrates were sterilized in 70% ethanol and rinsed in PBS three times prior to their use in cell culture. Substrates were then coated with type I Collagen (from rat tail, BD) at a concentration of 50 μg mL−1 for 1 h at 37 °C.
2.3. Keratinocyte culture
Primary human keratinocytes were isolated from neonatal foreskins and cultured on a mitotically inactivated feeder layer of J2-3T3 cells in FAD medium (one part Ham's F12, three parts Dulbecco's modified Eagle's medium, 1.8 × 10⁻⁴ M adenine), supplemented with 10% fetal calf serum (FCS) and a cocktail of 0.5 μg mL−1 of hydrocortisone, 5 μg mL−1 insulin, 10−10 M cholera enterotoxin and 10 ng mL−1 epidermal growth factor (HICE cocktail) (complete FAD medium).14Keratinocytes were seeded onto collagen-coated PDMS substrates in complete FAD medium at a density of 50![[thin space (1/6-em)]](https://www.rsc.org/images/entities/char_2009.gif) 000 cells cm−1 for 45 minutes at 37 °C. Substrates were rinsed gently once with FAD medium to remove non-adherent cells and transferred to 12 well plates containing inactivated J2-3T3 cells seeded at a density of 20
000 cells cm−1 for 45 minutes at 37 °C. Substrates were rinsed gently once with FAD medium to remove non-adherent cells and transferred to 12 well plates containing inactivated J2-3T3 cells seeded at a density of 20![[thin space (1/6-em)]](https://www.rsc.org/images/entities/char_2009.gif) 000 cells cm−1.
000 cells cm−1.
2.4. Immunolabeling and confocal microscopy
The antibodies anti-β1 integrin (clone P5D2), anti-K14 (clone LL002) anti-involucrin (clone SY7) (all mouse monoclonal) were used at a dilution of 1![[thin space (1/6-em)]](https://www.rsc.org/images/entities/char_2009.gif) :
:![[thin space (1/6-em)]](https://www.rsc.org/images/entities/char_2009.gif) 1000.28 (Mulder et al., 2012). Anti-α6 antibody (clone GOH3) was purchased from BioLegend and used at dilution of 1
1000.28 (Mulder et al., 2012). Anti-α6 antibody (clone GOH3) was purchased from BioLegend and used at dilution of 1![[thin space (1/6-em)]](https://www.rsc.org/images/entities/char_2009.gif) :
:![[thin space (1/6-em)]](https://www.rsc.org/images/entities/char_2009.gif) 500. Anti-K14 (Covance PRB-155P) was also used.
500. Anti-K14 (Covance PRB-155P) was also used.
Cells were fixed in 4% paraformaldehyde for 20 min at room temperature followed by 0.5% Triton X-100 (Sigma) in PBS for 15 min; in 1![[thin space (1/6-em)]](https://www.rsc.org/images/entities/char_2009.gif) :
:![[thin space (1/6-em)]](https://www.rsc.org/images/entities/char_2009.gif) 1 acetone
1 acetone![[thin space (1/6-em)]](https://www.rsc.org/images/entities/char_2009.gif) :
:![[thin space (1/6-em)]](https://www.rsc.org/images/entities/char_2009.gif) methanol at −20 °C for 20 min; or simultaneously fixed and permeabilised in paraformaldehyde and Triton for 20 min. Fixed cells were blocked for 1 h at room temperature in 10% fetal bovine serum, 0.25% gelatin from cold water fish skin (Sigma) and 0.1% Triton-X in PBS. Cells were pulsed for 1 h with EdU (Click-it 488, Molecular Probes) prior to fixation. Cells were incubated with primary antibody diluted in blocking buffer for 1 h at room temperature. After washing in PBS, cells were incubated as before in species-appropriate secondary antibodies conjugated to Alexa Fluor 488, 555 and 633 (Molecular Probes).
methanol at −20 °C for 20 min; or simultaneously fixed and permeabilised in paraformaldehyde and Triton for 20 min. Fixed cells were blocked for 1 h at room temperature in 10% fetal bovine serum, 0.25% gelatin from cold water fish skin (Sigma) and 0.1% Triton-X in PBS. Cells were pulsed for 1 h with EdU (Click-it 488, Molecular Probes) prior to fixation. Cells were incubated with primary antibody diluted in blocking buffer for 1 h at room temperature. After washing in PBS, cells were incubated as before in species-appropriate secondary antibodies conjugated to Alexa Fluor 488, 555 and 633 (Molecular Probes).
For cells labeled with dual mouse monoclonal antibodies, a previously described protocol20 was used. Briefly, cells were labelled with the first antibody as above, followed by blocking in 1% mouse serum for 1 h at room temperature. The second antibody, diluted in 1% mouse serum, was conjugated with an Alexa Fluor −488, −555, or −647 fluorophore using an antibody labeling kit (Molecular Probes) and incubated either at room temperature for 1 h or at 4 °C overnight. Cells were washed in PBS 3 times for 10 min per wash and mounted using Prolong Gold mounting medium with DAPI (Invitrogen).
Samples were examined with a Nikon A1 upright confocal microscope at either 20× (NA = 0.75) or 40× (NA = 0.95). Z-stacks of each substrate containing 50–150 sections with a z-interval of 0.3–1 μm were obtained. Images are represented as maximal intensity Z-projections unless otherwise stated.
2.5. Image analysis
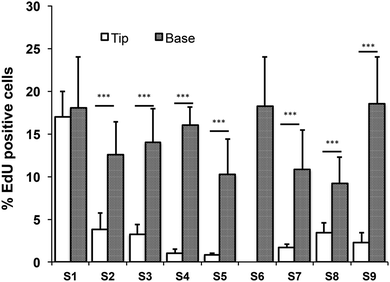
All images were analysed using the software Volocity (Perkin Elmer). Quantitation of EdU positive cells was performed by selecting a region of interest (ROI) around the tips or the troughs of the topographies using the built-in building blocks. The percentage of EdU positive cells within the tip or base regions was scored against total cells within the selected ROI. For the control substrate (S6), EdU positive cells were scored against total cells within the substrate. Fluorescence intensities of cells expressing β1 integrin were determined as previously described18 as a measure of the location of the stem cell population.3. Results
3.1. Development of epidermal rete ridges in foetal skin
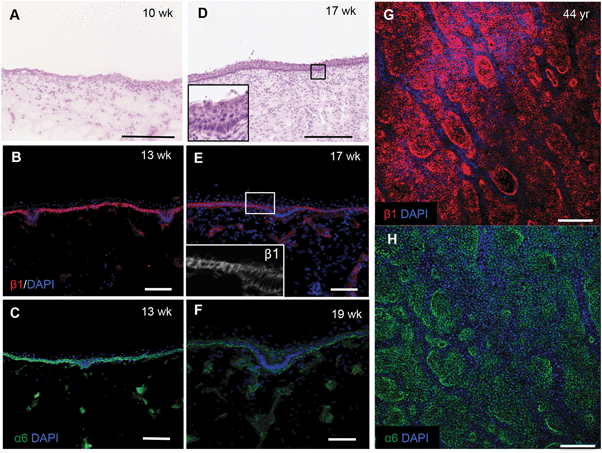
To confirm the changes in epidermal–dermal topography that occur during normal human skin development we examined sections of foetal dorsal skin from 10 to 19 weeks of estimated gestational age (Fig. 1). H&E staining showed that at 10 weeks the epidermal–dermal interface was relatively flat and the epidermis comprised one distinct cell layer with overlying periderm (Fig. 1A). Cells in the epidermal layer uniformly expressed α6 and β1 integrin subunits (data not shown).By 13–19 weeks, the epidermis had developed multiple cell layers and small invaginations into the dermis (Fig. 1B–D and inset) that did not correlate with developing hair follicles or sweat glands. The invaginations were uniformly labelled with antibodies to integrin α6; however, there was a striking reduction in β1 integrin expression relative to the rest of the basal layer (Fig. 1E and F). Whole-mount labelling of adult dorsal epidermis confirmed the presence of β1 integrin bright clusters (Fig. 1G) in contrast to the more uniform expression of integrin α6 (Fig. 1H). These observations provide the biological context for developing a topographical platform to mimic the epidermal–dermal interface.
3.2. Substrate fabrication
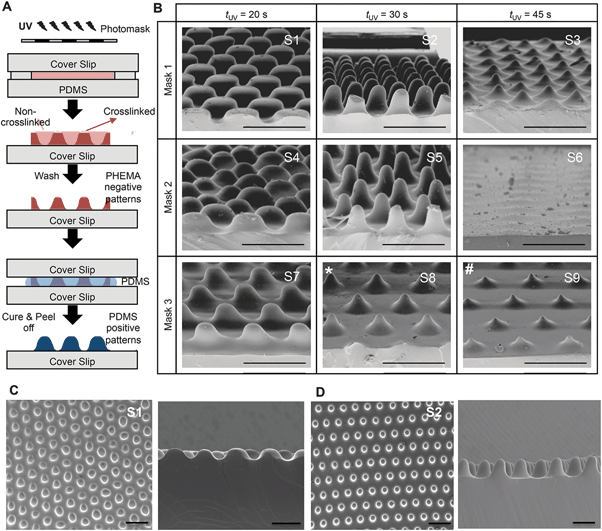
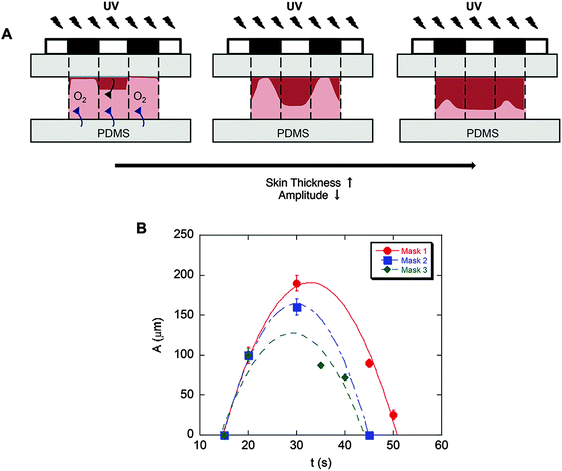
To fabricate culture substrates with varied topographical features, a light curable precursor solution composed of partially polymerized poly(hydroxyethyl methacrylate) (PHEMA), photoinitiator (Darocur 1173), and a crosslinker (ethylene glycol dimethacrylate, EGDMA) was prepared (Fig. 2A). HEMA monomers were mixed with Darocur 1173 and exposed to UV light to obtain a PHEMA prepolymer, which was pipetted onto a methacrylated glass slide (cover slip) and covered with a PDMS sheet. Spatial control of photocrosslinking was achieved by placing a photomask on the cover slip during further UV exposure. The PDMS was then peeled off, leaving crosslinked PHEMA with a negative substrate of the desired pattern (Fig. 2A). PDMS substrates with surface patterns were then prepared by thermally curing a PDMS precursor on the spatially crosslinked PHEMA films.Substrates comprising patterns that differed in shape and wavelength were determined by the photomask used and the amplitude was controlled by the UV exposure time (Fig. 2B). As quantified and shown in Fig. 3, the amplitude depended on the competition between the extent of radical polymerization and diffusion of the O2 radical scavenger from the PDMS sheet.27,29 When the light turned on, the crosslinking started from the top surface (Fig. 3A, dark red region) and with time the amplitude of the crosslinked region increased. This increase was limited due to O2 diffusion from the bottom surface (PDMS). Due to diffusion of the radicals into unexposed regions, the boundary between the crosslinked and uncrosslinked regions was not sharp. In fact, with increasing UV exposure time, the amplitude began to decrease due to skin formation on the top surface. The pattern amplitude with UV exposure time for each mask followed a biphasic behaviour (Fig. 3B), which was determined by the mask parameters (size and distance of the patterns). Films became flat at longer exposure times.
Scanning electron microscopy was used to evaluate the reproducibility of the patterns generated (Fig. 2B–D). Substrates for cell culture were generated to comprise 8 unique topographies and a flat control (Fig. 2B), labeled S1–S9, so that cell responses to different patterns could be compared within the same experiment. S6 did not have a patterned topography; therefore, S6 is the flat PDMS control used in the experiments. Although the SEM image of S6 shows some surface undulations the pattern amplitude is almost zero and no undulations were observed in S6 substrates seeded with cells. Each pattern was arrayed in an area of 50 mm2.
3.3. Reconstitution of human epidermis on topographical substrates
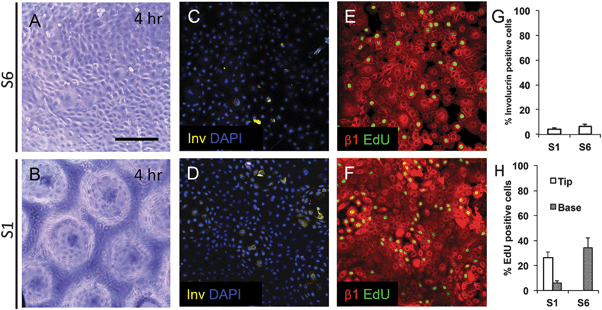
To examine keratinocyte responses to topography, we seeded them onto type I Collagen coated substrates at a density of 50![[thin space (1/6-em)]](https://www.rsc.org/images/entities/char_2009.gif) 000 cells cm−2. To ensure selective attachment of stem cells, we washed off cells that did not attach within 45 min.13 By 4 hours, cells were evenly spread across the substrates, regardless of the topographical features (Fig. 4A and B and data not shown). Involucrin-positive, terminally differentiating, cells were extremely rare (Fig. 4C, D and G). We also stained keratinocytes on two of the substrates (S1 and S6) with antibodies to β1 integrin and found little variation in fluorescence intensity between cells at 4 h (Fig. 4E and F). The proportion of S phase cells, labeled with a 1 h pulse of EdU, was similar on S1 and S6 substrates, but on S1 substrates they were localised primarily to the base of the features rather than the tips (Fig. 4E, F and H).
000 cells cm−2. To ensure selective attachment of stem cells, we washed off cells that did not attach within 45 min.13 By 4 hours, cells were evenly spread across the substrates, regardless of the topographical features (Fig. 4A and B and data not shown). Involucrin-positive, terminally differentiating, cells were extremely rare (Fig. 4C, D and G). We also stained keratinocytes on two of the substrates (S1 and S6) with antibodies to β1 integrin and found little variation in fluorescence intensity between cells at 4 h (Fig. 4E and F). The proportion of S phase cells, labeled with a 1 h pulse of EdU, was similar on S1 and S6 substrates, but on S1 substrates they were localised primarily to the base of the features rather than the tips (Fig. 4E, F and H).
Keratinocytes were cultured for a total of 48 hours (Fig. 5A), by which time the cells had begun to stratify and express involucrin. For each of the 9 surfaces tested, we evaluated the locations of the β1 integrin bright clusters, the location of cells in S phase of the cell cycle (EdU labeled) and the location of involucrin positive cells. Labeling of integrin α6 revealed distinct subcellular punctate structures associated with hemidesmosomes but no distinct patterning on any of the substrates (Fig. 5G and H).
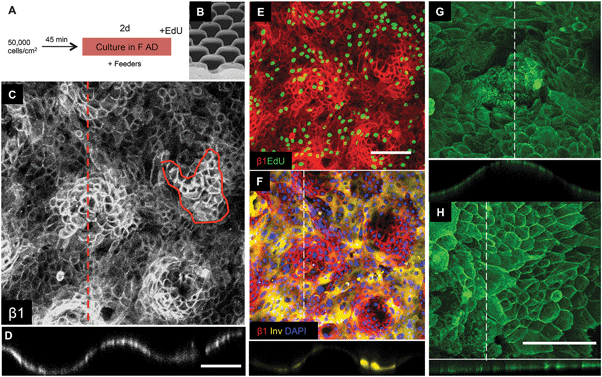 | ||
| Fig. 5 Keratinocyte patterning on S1 substrates. (A) Culture protocol. (B) SEM of S1 features (reproduced from Fig. 2). (C–H) Immunofluorescence labeling for the antibodies indicated. Orthogonal views along the dashed lines are shown below the en face views. (C–F) Show same field. Scale bars: 200 μm (C and D same magnification; E and F same magnification; G and H same magnification). | ||
Of the 9 surfaces tested, we identified one of the topographies, S1 (Fig. 5B), that best recreated the patterned distribution of stem cells within the basal layer of adult human epidermis. Clusters of β1 integrin bright cells were observed on the tips of topography S1 (Fig. 5C and D), as clearly shown in orthogonal views along the tips (Fig. 5C dotted line; Fig. 5D). The size of the β1 integrin bright patches (Fig. 5C circled area) was quantified and corresponded to approximately 30 cells on substrate S1 and 80 cells on flat PDMS (S6).
Keratinocytes cultured on substrates designed with the same wavelength spacing as S1 but different amplitude (topography S3) or the same amplitude but different wavelength spacing (topography S4) expressed an altered pattern of integrin-bright cells (Fig. 6). After 48 h of culture on topographies S3, S4 and S5 some tips were not completely covered by cells (see, for example, Fig. 6E). When tips were covered by cells, the integrin-bright clusters were localised to the tips on topographies S1 and S4 (Fig. 6E), but not on other topographies (Fig. 6D).
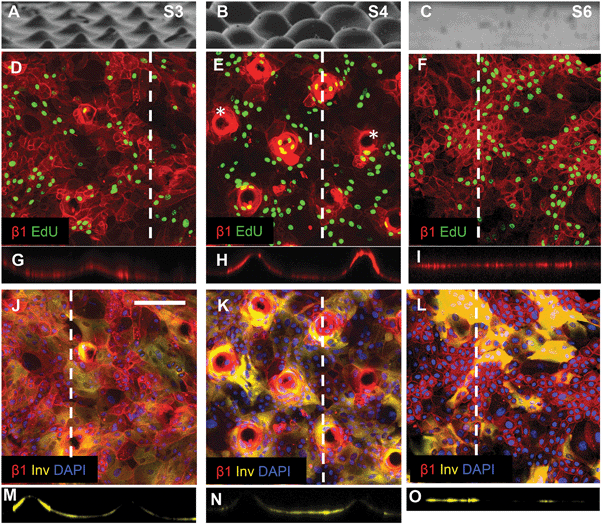 | ||
| Fig. 6 Topography induced patterning of stem cells, differentiating cells and proliferating cells. (A–C) SEM images of substrates S3 (A), S4 (B) and S6 (C) (reproduced from Fig. 2). (D–I) Immunofluorescence labelling of β1 integrin expression (red) and EdU incorporation. (G–I) are corresponding orthogonal views along the dashed lines in the en face views in (D–F). Asterisks in (E) denote substrate tips not covered by cells. (J–O) Immunofluorescence labelling of involucrin (yellow) and β1 integrins (red) with DAPI counterstain (blue) with corresponding orthogonal views along the dotted line in the en face views. Scale bar: 200 μm (D–O). | ||
Quantitation of EdU positive cells on all 9 substrates indicated that at 48 hours their location was influenced by topography (Fig. 7). Where cells covered the tips of substrate S1, there was an equal proportion of EdU positive cells on both the tips and troughs (Fig. 5E; Fig. 7), in contrast to the differential distribution observed at 4h (Fig. 4H). On all other substrates, the majority of proliferating cells were located at the base of the tips rather on the tips themselves (Fig. 6D, E and 7).
By 48 hours, some keratinocytes had begun to differentiate and stratify. Keratinocytes positive for the differentiation marker involucrin were exclusively located at the troughs or the sides of the topographies (see, for example, Fig. 5F; Fig. 6J–O). None of the topographies supported differentiation of keratinocytes on the tips as shown in the orthogonal views (Fig. 6M–O). The proportion of cells that expressed involucrin was similar on all substrates.
4. Discussion
Until now, the impact of the topographical architecture of the epidermal–dermal junction on epidermal cells has remained relatively unexplored. Here we describe a method for fabricating materials that recapitulate that architecture and show that differences in topography elicit different cell responses. The dimensions of the substrates that we have created can readily be altered to mimic the reduction in rete ridge height that occurs with ageing18 and the increase associated with epidermal hyperproliferation.19 The substrates also offer the potential to correlate changes in cell properties associated with the transition from a flat to an undulating epidermal–dermal interface that occurs during development with the appearance of the rete ridges (Fig. 1).24In adult human epidermis, clusters of β1 integrin bright keratinocytes lie outside the rete ridges, where the basal cell layer comes closest to the tissue surface (corresponding to the tips of our features) and are roughly 10–14 cells in diameter.13 We were able to recreate this patterning, albeit with larger clusters (substrate S1), and by changing the wavelength we could perturb (substrate S4) the pattern. It was previously shown that when keratinocytes are cultured on collagen-GAG micro-channels30,31 the stem cells localise in the depths of the channels. Based on our observations, we would predict that by decreasing the slope of the channel sides it should be possible to alter that location. Furthermore, our studies suggest that differences in the distribution of stem cells in palm/sole versus other body sites may reflect the response of the cells to differences in the topography of the epidermal–dermal interface.13,32
Intriguingly, regardless of the location of the integrin-bright clusters, terminally differentiated cells were localised to the troughs of the features, and the relative position of S-phase cells was not correlated with the position of the stem cell clusters. These findings are consistent with previous studies suggesting that in cultured keratinocytes proliferation rate is controlled separately from the proportion of stem cells, and that cells can undergo terminal differentiation at any phase of the cell cycle.33,34 At present we cannot distinguish between a model whereby cells leave the basal layer at random and there is lateral movement of differentiated involucrin-positive cells into the troughs and a model whereby there is selective upward migration from locations that are enriched for committed or transit amplifying cells.
Our platform provides a means of exploring how topographical cues influence stem cell position and properties and the signalling pathways that govern exit from the stem cell compartment.8,35 For example, since the skin surface is relatively flat, a cell exiting the basal layer from the base of a rete ridge has further to travel to the surface than one born outside the ridge. This could influence clonal organisation and account for differences in proliferation in different regions of the basal layer.20 A reduction in rete ridge height, on the other hand, could contribute to the age-related decline in stem cell function and basal cell density.18,36 It is also of interest to investigate the extent to which cell migration contributes to patterning on our substrates, since it has recently been reported that epidermal stem cells undergo collective cell movements that are correlated with their self-renewal ability.37
5. Conclusion
We have screened 8 unique topographies and identified one that mimics the patterning previously observed in human epidermis. We have shown that keratinocytes cultured on this substrate are patterned such that β1 integrin bright cells cluster on the tips of the topographies, establishing that signals from the underlying dermis are not required. This novel platform provides a means of exploring tissue-level organisation at the micro-scale and the signalling pathways that regulate it. While our current platform consists of elastomeric PDMS, development of more biocompatible natural polymers such as collagen could in future provide skin substitutes that mimic the architecture of the interfollicular epidermis.Source of funding
This work was funded by the Wellcome Trust (FMW), the Medical Research Council (FMW), the Biotechnology and Biological Sciences Research Council (FMW) and the David and Lucile Packard Foundation (JAB). FMW gratefully acknowledges financial support from the Department of Health via the National Institute for Health Research Comprehensive Biomedical Research Centre award to Guy's & St Thomas' National Health Service Foundation Trust in partnership with King's College London and King's College Hospital NHS Foundation Trust.Acknowledgements
The authors gratefully acknowledge the expert technical support of the Nikon Imaging Centre at King's College London and use of Core Facilities provided by the financial support from the Department of Health via the National Institute for Health Research (NIHR) Comprehensive Biomedical Research Centre award to Guy's & St Thomas's NHS Foundation Trust in partnership with King's College London and King's College Hospital NHS Foundation Trust. Adult patient samples were provided by King's Health Partners Cancer Biobank, London, UK, which is supported by the Experimental Cancer Medicine Centre at King's College London and the Department of Health via the NIHR Comprehensive Biomedical Research Centre award.References
- M. Guvendiren and J. A. Burdick, Biomaterials, 2010, 31, 6511–6518 CrossRef CAS PubMed
.
- M. J. Dalby, M. J. P. Biggs, N. Gadegaard, G. Kalna, C. D. W. Wilkinson and A. S. G. Curtis, J. Cell. Biochem., 2007, 100, 326–338 CrossRef CAS PubMed
.
- D.-H. Kim, E. A. Lipke, P. Kim, R. Cheong, S. Thompson, M. Delannoy, K. Y. Suh, L. Tung and A. Levechenko, Proc. Natl. Acad. Sci. U. S. A., 2010, 107, 565–570 CrossRef CAS PubMed
.
- A. I. Teixeira, G. A. Abrams, P. J. Bertics, C. J. Murphy and P. F. Nealey, J. Cell Sci., 2003, 116, 1881–1892 CrossRef CAS PubMed
.
- P. Uttayarat, G. K. Toworfe, F. Dietrich, P. I. Lelkes and R. J. Composto, J. Biomed. Mater. Res., Part A, 2005, 75A, 668–680 CrossRef CAS PubMed
.
- E. K. F. Yim, E. M. Darling, K. Kulangara, F. Guilak and K. W. Leong, Biomaterials, 2010, 31, 1299–1306 CrossRef CAS PubMed
.
- F. M. Watt, P. W. Jordan and C. H. O'Neill, Proc. Natl. Acad. Sci. U. S. A., 1988, 85, 5576–5580 CrossRef CAS
.
- J. T. Connelly, J. E. Gautrot, B. Trappmann, D. W. Tan, G. Donati, W. T. Huck and F. M. Watt, Nat. Cell Biol., 2010, 12, 711–718 CrossRef CAS PubMed
.
- F. M. Watt, Science, 2014, 346, 937–940 CrossRef CAS PubMed
.
- D. W. Tan, K. B. Jensen, M. W. Trott, J. T. Connelly, S. Broad and F. M. Watt, Development, 2013, 140, 1433–1444 CrossRef CAS PubMed
.
- P. H. Jones, B. D. Simons and F. M. Watt, Cell Stem Cell, 2007, 1, 371–381 CrossRef CAS PubMed
.
- H. Green, BioEssays, 2008, 30, 897–903 CrossRef PubMed
.
- P. H. Jones, S. Harper and F. M. Watt, Cell, 1995, 80, 83–93 CrossRef CAS PubMed
.
- S. Lowell, P. Jones, I. Le Roux, J. Dunne and F. M. Watt, Curr. Biol., 2000, 10, 491–500 CrossRef CAS PubMed
.
- L. S. Penrose and P. T. Ohara, J. Med. Genet., 1973, 10, 201–208 CrossRef CAS PubMed
.
- W. Montagna and K. Carlisle, J. Invest. Dermatol., 1979, 73, 47–53 CAS
.
- J. L. McCullough and K. M. Kelly, Ann. N. Y. Acad. Sci., 2006, 1067, 323–331 CrossRef PubMed
.
- A. Giangreco, S. J. Goldie, V. Failla, G. Saintigny and F. M. Watt, J. Invest. Dermatol., 2010, 130, 604–608 CrossRef CAS PubMed
.
- J. E. Fraki, R. A. Briggaman and G. S. Lazarus, J. Invest. Dermatol., 1983, 80(suppl), 31s–35s CrossRef CAS PubMed
.
- U. B. Jensen, S. Lowell and F. M. Watt, Development, 1999, 126, 2409–2418 CAS
.
- M. Frye, A. G. Fisher and F. M. Watt, PLoS One, 2007, 2, e763 Search PubMed
.
- A. M. Klein, V. Nikolaidu-Neokosmidou, D. P. Doupe, P. H. Jones and B. D. Simons, J. R. Soc., Interface, 2011, 8, 1815–1824 CrossRef PubMed
.
- S. Estrach, J. Legg and F. M. Watt, J. Cell Sci., 2007, 120, 2944–2952 CrossRef CAS PubMed
.
- M. D. Hertle, J. C. Adams and F. M. Watt, Development, 1991, 112, 193–206 CAS
.
- R. R. Driskell, B. M. Lichtenberger, E. Hoste, K. Kretzchmar, B. D. Simons, M. Charalambous, S. R. Ferron, Y. Herault, G. Pavlovic, A. C. Ferguson-Smith and F. M. Watt, Nature, 2013, 504, 277–281 CrossRef CAS PubMed
.
- K. Liakath-Ali, V. E. Vancollie, E. Heath, D. P. Smedley, J. Estabel, D. Sunter, T. DiTommaso, J. K. White, R. Ramirez-Solis, I. Smyth, K. P. Steel and F. M. Watt, Nat. Commun., 2014, 5, 3540 Search PubMed
.
- M. Guvendiren, S. Yang and J. A. Burdick, Adv. Funct. Mater., 2009, 19, 3038–3045 CrossRef CAS
.
- K. W. Mulder, X. Wang, C. Escriu, Y. Ito, R. F. Schwarz, J. Gillis, G. Sirokmany, G. Donati, S. Uribe-Lewis, P. Pavldis, A. Murrell, F. Markowetz and F. M. Watt, Nat. Cell Biol., 2012, 14, 753–763 CrossRef CAS PubMed
.
- D. Chandra and A. J. Crosby, Adv. Mater., 2011, 23, 3441–3445 CrossRef CAS PubMed
.
- K. A. Bush and G. D. Pins, Tissue Eng., Part A, 2012, 18, 2343–2353 CrossRef CAS PubMed
.
- A. L. Clement, T. J. Moutinho Jr and G. D. Pins, Acta Biomater., 2013, 9, 9474–9484 CrossRef CAS PubMed
.
- R. M. Lavker and T. T. Sun, Science, 1982, 215, 1239–1241 CAS
.
- A. J. Zhu and F. M. Watt, Development, 1999, 126, 2285–2298 CAS
.
- R. Dover and F. M. Watt, J. Invest. Dermatol., 1987, 89, 349–352 CAS
.
- B. Trappmann, J. E. Gautrot, J. T. Connelly, D. G. Strange, Y. Li, M. L. Oyen, M. A. Cohen Stuart, H. Boehm, B. Li, V. Vogel, J. P. Spatz, F. M. Watt and W. T. Huck, Nat. Mater., 2012, 11, 642–649 CrossRef CAS PubMed
.
- Y. Barrandon and H. Green, Proc. Natl. Acad. Sci. U. S. A., 1987, 84, 2302–2306 CrossRef CAS
.
- D. Nanba, F. Toki, A. Tate, M. Imai, N. Matsushita, K. Shiraishi, K. Sayama, H. Toki, S. Higashiyama and Y. Barrandon, J. Cell Biol., 2015, 209, 305–315 CAS
.
Footnotes |
| † Joint first authors. |
| ‡ Joint corresponding authors. |
| This journal is © The Royal Society of Chemistry 2016 |

