Investigating the adduct formation of organic mercury species with carbonic anhydrase and hemoglobin from human red blood cell hemolysate by means of LC/ESI-TOF-MS and LC/ICP-MS
Jens
Hogeback
a,
Miriam
Schwarzer
a,
Christoph A.
Wehe
a,
Michael
Sperling
ab and
Uwe
Karst
*a
aInstitute of Inorganic and Analytical Chemistry, University of Münster, Corrensstraße 28/30, 48149 Münster, Germany. E-mail: uk@uni-muenster.de; Fax: +49 251 83 36013; Tel: +49 251 83 33141
bEuropean Virtual Institute for Speciation Analysis (EVISA), Mendelstr. 11, 48149 Münster, Germany
First published on 29th September 2015
Abstract
The interaction of mercury species with human erythrocytes is studied to investigate possible high molecular binding partners for mercury species. Human blood hemolysate was spiked with methylmercury and investigated by means of liquid chromatography (LC) coupled to electrospray ionization time of flight mass spectrometry (ESI-ToF-MS) and inductively coupled plasma mass spectrometry (ICP-MS). Beside adduct formation of mercury species with hemoglobin, the main compound of the erythrocytes, mercury binding to the enzyme carbonic anhydrase was revealed. Due to an enzymatic digest of the protein-mercury adduct, the binding site at the free thiol group of the protein was identified. These results indicate that carbonic anhydrase might play a role in mercury toxicity.
1. Introduction
Organic mercury species are widely known to be highly toxic towards biota.1 (Mono)-methylmercury (MeHg+) is formed by bacteria in marine sediments, bioaccumulated by marine organisms and biomagnified along the marine food chain. Humans are exposed to MeHg+ mainly via consumption of marine food, especially of carnivorous fish species. These exhibit high MeHg+ levels, which are increasing with age and size of the fish.2 Moreover, thimerosal (THI) is a mercury containing substance, which is used as a preservative in medicine products to avoid bactericidal and fungicidal contamination. THI has also been used as preservative in multidose ampullae of vaccines and other drugs. The antimicrobial and toxic effects of THI are based on its decomposition in aqueous media releasing a (mono)-ethylmercury cation (EtHg+).3 The molecular mechanisms of MeHg+ and EtHg+ toxicity and toxic kinetics are not fully understood and still are a topic of ongoing research.4MeHg+, which is taken up with contaminated food is absorbed almost entirely by the blood stream, whereas THI, in cases where it was used as multidose vaccine preservative, is injected directly into the body leading to increased mercury levels.5,6 However due to the intramuscular administration of thiomersal containing vaccines, relatively high local concentrations at time and point of injection are likely, before it is later diluted and distributed via the blood stream.
In biological systems, a large number of biomolecules with free thiol groups are available. Due to the high affinity of mercury towards sulfur, reactions with free thiol groups of peptides and proteins with different mercury species may occur.7–10 It is assumed that the interaction of mercury species with thiols plays an important role for mercury transport and for toxic mechanisms of action.11
Studies on the fractionation of whole blood from mammals following total mercury determination showed that the bulk of blood alkyl mercury is bound to the erythrocytes.12 Moreover, half of the erythrocyte-mercury was found to be coordinated to high molecular compounds.13,14 Since hemoglobin is by far the most abundant protein in erythrocytes and contains free thiol groups, it is a potential target molecule for mercury binding. The interaction of mercury species with hemoglobin was investigated in the 1970s. Rabenstein et al. showed in their NMR studies that mercury species are coordinated to the free thiol groups of hemoglobin.15,16 Janzen et al. compared the adduct formation of human and rat hemoglobin with THI and MeHg+.17 Recently, Rayas et al. identified hemoglobin as major binding site for MeHg+ in dolphin liver.18
The second most abundant protein of the erythrocytes is carbonic anhydrase (CA), which is found in all animals and photosynthesizing organisms. It catalyzes the reversible hydration of carbon dioxide. Human CA from erythrocytes contains one cysteine residue and with that one free thiol group, which may interact with mercury species.19 In the context of crystal structure investigations of human CA isoforms, mercury species were used as phasing agents in X-ray diffraction experiments and interaction with thiol groups was detected.20,21 However, these experiments were not conducted under physiological conditions and not brought into relation to mercury toxicity.
Ekinci et al. showed that Hg2+ is a competitive inhibitor of CA.22 Hence, it is not known, which effect organic mercury species may have with respect to the enzymatic activity of CA.
In this study, the interaction of different mercury species with human CA was investigated by carrying out incubation experiments at physiological conditions. It is expected that adduct formation at the free thiol group takes place. In addition, an enzymatic digest of the protein adducts was carried out to prove the proposed binding site of mercury in the protein.
2. Experimental
Chemicals and reagents
All Chemicals were purchased in the highest purity available. Carbonic anhydrase 1 from human erythrocytes, thiomersal, formic acid, phosphate buffered saline (PBS) tablets, chymotrypsin, ammonium bicarbonate, sodium chloride and calcium chloride were obtained from Sigma Aldrich (Steinheim, Germany). Sequencing grade trypsin was purchased from Promega (Mannheim, Germany). Methylmercury chloride (MeHgCl) and hexamethyldisilazan (HMDS) were obtained from ABCR (Karlsruhe, Germany). Acetonitrile and methanol were purchased from Merck KGaA (Darmstadt, Germany). Water was purified using a water still Aquatron A4000D (Stuart, Staffordshire, UK).Incubation solution with a physiological pH of 7.4 was prepared by dissolution of PBS tablets according to the manufacturer's instructions and pH value was adjusted with 1% aqueous ammonia to the intended pH. Fresh stock solutions of CA1, THI, chymotrypsin, ammonium bicarbonate, sodium chloride and calcium chloride were prepared daily by dissolution of the solids in deionized water. MeHg+ solutions were prepared by dissolving MeHgCl in a mixture of methanol and water 3![[thin space (1/6-em)]](https://www.rsc.org/images/entities/char_2009.gif) :
:![[thin space (1/6-em)]](https://www.rsc.org/images/entities/char_2009.gif) 1 (v/v) and diluted to the intended concentration with deionized water.
1 (v/v) and diluted to the intended concentration with deionized water.
Incubation of carbonic anhydrase with mercury species
A stock solution of CA1 in incubation solution was prepared and mixed with MeHg+ and THI solution to final concentrations of 5 μmol L−1 CA1 and 2.5 μmol L−1 of the mercury species. An additional blank sample was prepared using 5 μmol L−1 CA1 in incubation solution. These samples were incubated over night at pH 7.4 and 37 °C to simulate physiological conditions and investigated by means of LC/ESI-ToF-MS.Enzymatic digest of carbonic anhydrase
Solutions of CA1 in incubation solutions were mixed with MeHg+ and THI to a final equimolar ratio of 25 μmol L−1 and incubated for 1 h at 37 °C and pH 7.4 to ensure that adduct formation takes place. A blank sample was prepared by adding water instead of mercury species. The solution was heated for 30 min at 90 °C for protein denaturation. For enzymatic digestion, calcium chloride and ammonium bicarbonate solution were added to final concentrations of 2 mmol L−1 and 50 mmol L−1, respectively. Trypsin and chymotrypsin were added to an enzyme/protein ratio of 1![[thin space (1/6-em)]](https://www.rsc.org/images/entities/char_2009.gif) :
:![[thin space (1/6-em)]](https://www.rsc.org/images/entities/char_2009.gif) 30 (w/w) following incubation over night at 37 °C. The resulting solutions were analysed by means of LC/ESI-ToF-MS and LC/ICP-MS.
30 (w/w) following incubation over night at 37 °C. The resulting solutions were analysed by means of LC/ESI-ToF-MS and LC/ICP-MS.
Sample preparation of human whole blood hemolysate
Human whole blood was obtained from one male volunteer. The blood was collected via an intravenous cannula directly into a Monovette (Sarstedt AG, Nümbrecht, Germany), which was packed with beads forming a layer between the plasma and the corpuscular components during centrifugation. Furthermore, the tubes contained Li–Heparin (ca. 16 I.U. mL−1) to prevent coagulation. Shortly after collection, the blood was centrifuged for 10 min at 2000g to separate plasma and the cellular components, which consist predominantly of erythrocytes. The supernatant plasma was removed and 500 μL of the erythrocyte concentrate were washed twice with physiological sodium chloride solution (0.9% (w/w) NaCl in water) to remove plasma residues. For that purpose, 500 μL of saline solution were added to the erythrocytes following centrifugation for 10 min at 2000g. Afterwards, the supernatant was discarded and the washing procedure repeated. By adding 500 μL of deionized water and 30 min incubation at room temperature, erythrocytes were lyzed. To investigate interaction with MeHg, the hemolysate was diluted 1![[thin space (1/6-em)]](https://www.rsc.org/images/entities/char_2009.gif) :
:![[thin space (1/6-em)]](https://www.rsc.org/images/entities/char_2009.gif) 1000 (v/v) with the physiological incubation solution and spiked to a final MeHg+ concentration of 50 μmol L−1. Furthermore, a blank solution without MeHg+ was prepared by adding incubation solution instead of MeHg+ solution. These samples were incubated overnight at 37 °C and pH 7.4 to simulate physiological conditions and investigated by LC/ESI-ToF-MS and LC/ICP-MS.
1000 (v/v) with the physiological incubation solution and spiked to a final MeHg+ concentration of 50 μmol L−1. Furthermore, a blank solution without MeHg+ was prepared by adding incubation solution instead of MeHg+ solution. These samples were incubated overnight at 37 °C and pH 7.4 to simulate physiological conditions and investigated by LC/ESI-ToF-MS and LC/ICP-MS.
Instrumental setup
LC separations were carried out using a Shimadzu HPLC system (Duisburg, Germany) consisting of two LC-10ADVP pumps, a SIL-10A autosampler, a SCL-10AVP system controller, a DGC14A degasser and a CTO-10ASVP column oven. The software LCSolution version 1.2.2 (Shimadzu) was used to control the HPLC system. The samples were analysed with the same LC system using the same LC conditions both with ESI-ToF-MS as well as ICP-MS detection to obtain both molecular and elemental information, respectively.For ESI-ToF-MS investigations, the LC outlet was directly coupled to an ESI source of a micrOTOF from Bruker Daltonics (Bremen, Germany). The following parameters were used for analyses of the incubated CA1 and hemolysate in the positive ion mode: mass range: m/z 500–2200, end plate offset: −500 V, capillary: 4000 V, nebulizer gas: 1.4 bar, dry gas: 8 L min−1, dry temperature: 190 °C, capillary exit: 150.0 V, skimmer 1: 50.0 V, skimmer 2: 22.0 V, hexapole 1: 23.0 V, hexapole 2: 21.0 V, hexapole RF: 400.0 V, transfer time: 60.0 μs, pre-pulse storage: 30.0 μs, lens 1 storage: 40 V, lens 1 extraction: 21.3 V.
For analyses of the enzymatic digests, the following ESI-ToF-MS parameters were used: mass range: m/z 100–2000: end plate offset: −500 V, capillary: 4000 V, nebulizer gas: 1.5 bar, dry gas: 8 L min−1, dry temperature: 200 °C, capillary exit: 150.0 V, skimmer 1: 50.0 V, skimmer 2: 26.5 V, hexapole 1: 23.0 V, hexapole 2: 21.4 V, hexapole RF: 300.0 V, transfer time: 70.0 μs, pre-pulse storage: 19.0 μs, lens 1 storage: 40 V, lens 1 extraction: 20.9 V.
The instrument was routinely calibrated using ammonium formate clusters as external standards. Furthermore, at the end of each data acquisition, internal calibration was performed using ammonium formate clusters as well. The software Data Analysis (Bruker Daltonics) was used for spectra evaluation. Deconvolution of protein mass spectra was performed using MagTran 1.02, which is based on a charge state deconvolution algorithm developed by Zhang and Marshall.23
For ICP-MS investigations, a quadrupole-based ICP-MS (iCap Qc, Thermo Fisher Scientific, Bremen, Germany) was used. The LC outlet was directly coupled to a PFA MicroFlow nebulizer (Elemental Scientific, Omaha, NE, USA) and a Peltier-cooled (−5 °C) cyclonic spray chamber. The instrument was controlled by the Qtegra ISDS software (Thermo Fisher Scientific). The following ICP-MS parameters were used: Plasma power: 1550 W, nebulizer gas: 0.6 L min−1, cool gas: 14 L min−1, auxiliary gas: 0.8 L min−1, oxygen as additional gas: 45 mL min−1, recorded isotopes 199Hg, 200Hg and 202Hg with a dwell time of 0.1 s, each.
Chromatographic conditions
The proteins and the enzymatic digest mixture were separated using a Discovery BioWidePore C5 column (2.1 × 150 mm, 5 μm, 4 × 4 mm guard column, 300 Å) from Supelco (Steinheim, Germany).Separations of the hemolysate were performed on a BioBasic C18 column (2.1 × 150 mm, 5 μm, 4 × 4 mm guard column, 300 Å) from Thermo Fisher Scientific (Dreieich, Germany). In both cases, the injection volume was 5 μL and the column oven had a temperature of 40 °C. Separation was performed using a binary gradient with aqueous formic acid (0.1%) as eluent A and acetonitrile as eluent B at a flow rate of 300 μL min−1. However, another gradient was used for peptide separation. Both gradient profiles are given in Table 1.
| Protein separations | |||||||
| t/min | 0 | 2 | 20 | 24 | 27 | 29 | 35 |
| B/% | 35 | 35 | 42 | 70 | 70 | 35 | 35 |
| Enzymatic digest | |||||||
| t/min | 0 | 2 | 19 | 23 | 28 | 30 | |
| B/% | 10 | 10 | 80 | 80 | 10 | 10 | |
3 Results and discussion
Adduct formation of human carbonic anhydrase 1 with MeHg+
CA from human erythrocytes was incubated with MeHg+ and THI at simulated physiological conditions and investigated by means of LC/ESI-ToF-MS, respectively. The obtained and deconvoluted mass spectra are shown in Fig. 1. The mass spectra show characteristic charge distributions for proteins (Fig. 1a, c and e).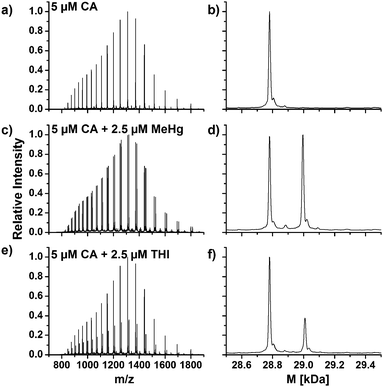 | ||
| Fig. 1 Charge distributions and deconvoluted mass spectra of native CA1 (a and b) and after incubation with MeHg+ (c and d) and THI (e and f). | ||
The mass spectra were deconvoluted in order to obtain neutral mass spectra (Fig. 1b, d and f). An experimental mass of 28781.0 Da was found for the unmodified CA1, which is in a good agreement with values described in literature or calculated from its primary structure.24,25
In the deconvoluted mass spectra of the sample after incubation with MeHg+ (Fig. 1d), a second signal arises, which can be assigned to a mass of 28995.7 Da. The mass difference of 214.7 Da in relation to the unmodified CA1 can be explained by a substitution of one proton (1.0079 Da) with a MeHg+ unit (215.6337 Da). The obtained mass difference is in good agreement with the calculated (214.6258 Da).
A similar reaction can be observed in the deconvoluted mass spectrum after incubation with THI (Fig. 1f). Here, also a second signal arises with a mass of 29009.7 Da. The mass difference of 228.7 Da indicates adduct formation with an EtHg+ unit. The found mass difference correlates well to a theoretical difference of 228.6524 Da. THI has hydrolyzed to thiosalicylic acid and EtHg+. These results indicate that MeHg+ and EtHg+ from THI are bound to CA1. It can be assumed that the mercury species are coordinated to the single free thiol group in the protein. To specify the expected binding site, an enzymatic digest was performed.
Enzymatic digest of human carbonic anhydrase 1
After adduct formation of human CA1 from human erythrocytes detected by means of the deconvoluted protein masses, the proposed binding site of the mercury species in the protein should be confirmed. To find out about the binding site, enzymatic digests were prepared and analysed by LC/ESI-ToF-MS and LC/ICP MS.Trypsin and chymotrypsin were used in parallel for the digestion to obtain different peptide patterns. The tryptic digest of CA1 results in 24 specific peptides, in which the peptide T19 (#174–213) is the peptide featuring the only cysteine residue and consists of 40 amino acids. The digestion with chymotrypsin produced 45 fragments from CA1. The peptide C40, which contains the cysteine, consists of 14 amino acids (#210–223).
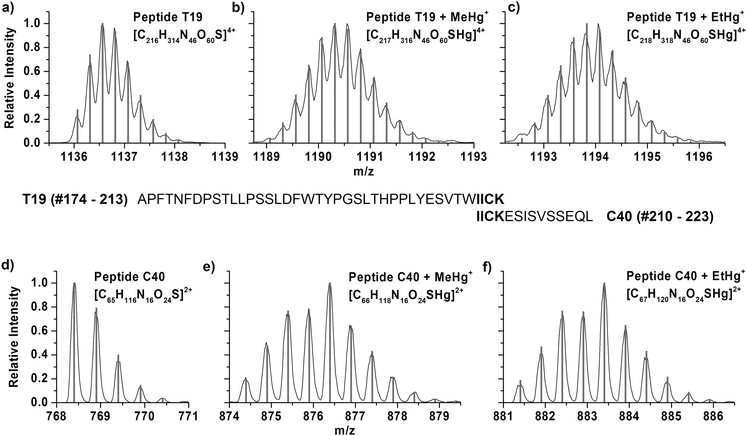
Fig. 2 shows the mass spectra of the T19 peptide after tryptic digest in the +4 charge state and the C40 peptide after chymotryptic digest in the +2 charge state, respectively. The isotopic patterns of the unmodified peptide are displayed in Fig. 2a and d. The resulting peptides after incubation with MeHg+ and following digestion show a characteristic isotopic pattern. Seven stable mercury isotopes cause a typical isotopic pattern of mercury containing peptides (Fig. 2b and e). The obtained isotopic pattern of T19 and C40 after incubation with THI show that adduct formation with EtHg+ has taken place at the cysteine containing peptide (Fig. 2c and f). In all cases, the obtained masses are in good agreement with calculated values, which are listed in Table 2.
| Sum formula | Exp. m/z | Calc. m/z | Dev. [ppm] | |
|---|---|---|---|---|
| T19 | [C216H314N46O60S]4+ | 1136.5672 | 1136.5657 | 1.3 |
| T19 + MeHg+ | [C217H316N46O60SHg]4+ | 1190.0633 | 1190.0603 | 2.6 |
| T19 + EtHg+ | [C218H318N46O60SHg]4+ | 1194.0682 | 1194.0647 | 2.9 |
| C40 | [C65H116N16O24S]2+ | 768.4029 | 768.4006 | 3.0 |
| C40 + MeHg+ | [C66H118N16O24SHg]2+ | 876.3946 | 876.3966 | −2.3 |
| C40 + EtHg+ | [C67H120N16O24SHg]2+ | 883.4044 | 883.4060 | −1.8 |
Since mercury binding was shown in both digestion experiments at the only cysteine containing peptide it can be considered as proof that mercury species are bound to the thiol function.
LC/ESI-ToF-MS analysis of the hemolysate
Since adduct formation of organomercury species with human hemoglobin and human CA1 was shown after incubation experiments with isolated proteins, incubation experiments with human blood hemolysate were conducted subsequently in order to confirm these results and, furthermore, to look for other high molecular biomolecules as potential binding partners for mercury species.For analysis of the hemolysate, a method was developed to separate the α- and β-subunits of hemoglobin, which are the main constituents of erythrocytes. In Fig. 3a, the extracted ion chromatograms (XIC) of charge state +13 of the α- and β-chain are shown. After deconvolution of the charge distribution spectra, neutral masses of 15126.2 Da for the α-chain and 15867.0 Da for the β-chain were determined. The obtained deconvoluted masses are in good accordance with calculated values from amino acid sequence and literature.26,27
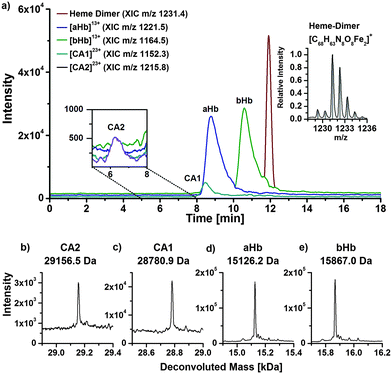 | ||
| Fig. 3 LC/ESI-ToF-MS chromatogram of human blood hemolysate with the XICs of the most abundant compounds (a). Deconvoluted mass spectra of the proteins CA2 (b), CA1 (c), αHb (d) and βHb (e). | ||
The complex of the hemoglobin subunits and the heme group is released through organic eluents during chromatography. The heme group appears as dimer with a mass of 1231.4 Da. The monomer and trimer were observed as well in lower intensities. The isotopic pattern of the recorded and calculated dimer matches well. The formation of heme dimer and other oligomers has been described by Pashynska et al.28
Besides hemoglobin, charge distributions of two other proteins were observed. Deconvoluted masses of 28780.9 Da and 29156.5 Da were determined, which can be assigned to human CA1 and human carbonic anhydrase 2 (CA2), respectively. The found protein masses agree well with values described in literature.24,25,29
Interaction of the hemolysate with MeHg+
To investigate the interaction of mercury species with components of human erythrocytes, hemolysate was spiked with MeHg+ solution, incubated at 37 °C and pH 7.4 to simulate physiological conditions and analysed by LC/ICP-MS and LC/ESI-ToF-MS to obtain molecular and elemental information. The presented results are obtained after incubation with relatively high MeHg+ concentrations, which provided the clearest results. However, lower concentrations were also applied during this study showing similar effects. It is expected that adduct formation of MeHg+ with free thiol groups of proteins occurs. Each α-chain of human hemoglobin contains one, each β-chain two free thiol groups per molecule. Both CA isoforms contain one free thiol function each, where adduct formation can be expected as well.Fig. 4a displays a LC/ICP-MS chromatogram of MeHg+ spiked hemolysate. The mercury trace shows four main peaks. The first can be assigned to unbound MeHg+, which elutes with the void volume. The other three signals can be assigned comparing retention times of the LC/ESI-ToF-MS measurements (Fig. 3b). The XIC of the MeHg+ protein adducts are in good agreement with the mercury signals obtained by LC/ICP-MS. The +13 charge state of the α-Hb + MeHg+ adduct (m/z 1181.5) was detected at 9.4 min with ICP- and ESI-ToF-MS. A peak of the MeHg+ adduct of the CA1 was detected at 8.3 min in LC/ICP-MS and LC/ESI-MS chromatograms as well. A signal for the MeHg+ adduct with CA2, which is expected at 6.2 min, could not be detected, as it is overlapped by the tailing peak of the free MeHg+ species. Moreover, the mercury background in this region is caused by slight species decomposition due to the low pH during separation.
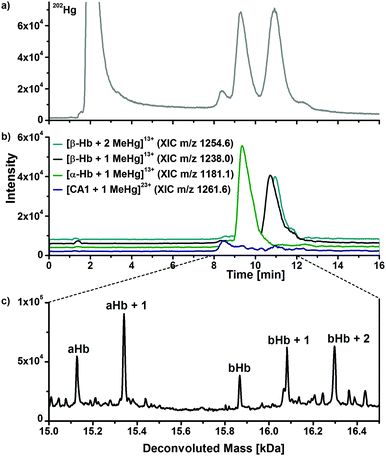 | ||
| Fig. 4 LC/ICP-MS (a) and LC/ESI-ToF-MS chromatogram of hemolysate, which was incubated with MeHg+. Deconvoluted mass spectrum (c) of the 9–12 min fraction of (b). | ||
To show that adduct formation of MeHg+ has taken place, a deconvoluted mass spectrum of the 9–12 min fraction was generated (Fig. 4c). There are five main signals. The first two signals at 15126.3 Da and 15340.9 Da can be assigned to the hemoglobin α-chain and its corresponding MeHg+ adduct. The mass difference of 214.6 Da can be explained by a substitution of the proton (1.0079 Da) of the free thiol group with one MeHg+ (215.6337 Da) unit, as described earlier. Furthermore, signals for the β-chain and its corresponding single and double MeHg+ adduct can be expected, because the hemoglobin β-subunit contains two free cysteine residues. The detected mass of the free β-chain of 15867.2 Da correlates well to values from literature. The single and double MeHg+ adducts with masses of 16082.3 Da and 16296.0 Da create mass differences of 215.1 Da and 428.8 Da relating to the free β-chain. The obtained mass differences are in good agreement with the calculated due to an addition of one and two MeHg+.
In addition to the detected mass increase of the protein after adduct formation, an effect on the retention time was observed (Fig. 3a and 4b). The free α-chain has a retention time of 8.6 min, whereas the MeHg+ adduct elutes at 9.3 min. Due to the additional MeHg+ group, the protein becomes less polar, and because of the used reversed phase conditions, a separation of the α-chain and the α-chain MeHg+ adduct was achieved. A similar effect was observed in case of the β-chain, whereas the shift in retention time was not as distinctive as for the α-chain. The unmodified β-chain elutes at 10.5 min, the single MeHg+ adduct at 10.7 min and the double MeHg+ adduct at 10.9 min. The shift in retention time was also observed after incubation experiments of the hemolysate with EtHg+. In this case, the retention times were shifted even more than for MeHg+.
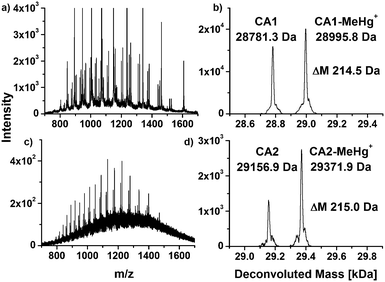
The amino acid sequence of human CA1 and CA2 shows that the protein contains one free cysteine residue each and it is thus assumed that similar reactions with mercury species take place at the free thiol group. Fig. 5a shows an enlargement of the mass spectra with the charge distributions of the free hemoglobin α chain and the coeluting CA1. The signal doublets of the CA1 indicate adduct formation, which can be confirmed due to deconvolution of this spectrum, which is shown in Fig. 5b. Two signals with masses of 28781.3 Da for the free CA1 and 28995.8 Da for the corresponding MeHg+ adduct can be assigned. The mass difference of 214.5 Da corresponds well to expected values due to an addition of MeHg+ as described above. In case of the CA2, similar reactions were observed (Fig. 5c and d). After deconvolution, masses of 29156.9 Da and 29371.9 Da can be assigned to the free protein and its adduct. The mass difference of 215.0 Da is still in good correlation to the expected value, whereas the lower abundance of the CA2 in the samples may lead to slight mass inaccuracies.
4 Conclusions
In this study, the interaction of mercury species with high molecular weight constituents of human erythrocytes was investigated by means of LC/ESI-ToF-MS and LC/ICP-MS. The complementary use of both MS techniques allows to obtain reliable data about possible reactions of mercury species with proteins. With the help of enzymatic digestion, the free cysteine residue within proteins has been identified as the binding site for methylmercury and ethylmercury cations. Incubation experiments under physiological conditions reveal that carbonic anhydrase, and not only hemoglobin, provides such binding site for organic mercury species and forms the related adducts. Since both proteins have a high abundance in blood, they both are expected to play a role in the transport of mercury in blood.References
- T. Syversen and P. Kaur, J. Trace Elem. Med. Biol., 2012, 26, 215–226 CAS.
- S. C. Hight and J. Cheng, Anal. Chim. Acta, 2006, 567, 160–172 CrossRef CAS.
- K. Weisser, K. Bauer, P. Volkers and B. Keller-Stanislawski, Bundesgesundheitsblatt – Gesundheitsforschung – Gesundheitsschutz, 2004, vol. 47, pp. 1165–1174 Search PubMed.
- J. G. Dórea, M. Farina and J. B. T. Rocha, J. Appl. Toxicol., 2013, 33, 700–711 CrossRef PubMed.
- R. Airaksinen, A. W. Turunen, P. Rantakokko, S. Männistö, T. Vartiainen and P. K. Verkasalo, Public Health Nutrition, 2011, 14, 480–489 CrossRef PubMed.
- M. E. Pichichero, A. Gentile, N. Giglio, M. M. Alonso, M. V. Fernandez Mentaberri, G. Zareba, T. Clarkson, C. Gotelli, M. Gotelli, L. Yan and J. Treanor, J. Pediatr., 2009, 155, 495–499 CrossRef CAS PubMed.
- W. Y. Feng, M. Wang, M. Guan, Y. Hui, J. W. Shi, B. Wang, M. Zhu, Y. L. Zhao and Z. F. Chai, J. Anal. At. Spectrom., 2011, 26, 156–164 RSC.
- S. Trümpler, W. Lohmann, B. Meermann, W. Buscher, M. Sperling and U. Karst, Metallomics, 2009, 1, 87–91 RSC.
- E. M. Krupp, B. F. Milne, A. Mestrot, A. A. Meharg and J. Feldmann, Anal. Bioanal. Chem., 2008, 390, 1753–1764 CrossRef CAS PubMed.
- D. J. Kutscher, A. Sanz-Medel and J. Bettmer, Metallomics, 2012, 4, 807–813 RSC.
- J. P. K. Rooney, Toxicology, 2007, 234, 145–156 CrossRef CAS PubMed.
- S. Trümpler, B. Meermann, S. Nowak, W. Buscher, U. Karst and M. Sperling, J. Trace Elem. Med. Biol., 2014, 28, 125–130 Search PubMed.
- S. Ancora, R. Rossi, P. D. Simplicio, L. Lusini and C. Leonzio, Arch. Environ. Contam. Toxicol., 2002, 42, 348–353 CrossRef CAS PubMed.
- S. Trümpler, S. Nowak, B. Meermann, G. A. Wiesmuller, W. Buscher, M. Sperling and U. Karst, Anal. Bioanal. Chem., 2009, 395, 1929–1935 CrossRef PubMed.
- D. L. Rabenstein, A. P. Arnold and R. D. Guy, J. Inorg. Biochem., 1986, 28, 279–287 CrossRef CAS PubMed.
- D. L. Rabenstein, A. A. Isab and R. S. Reid, Biochim. Biophys. Acta, Mol. Cell Res., 1982, 720, 53–64 CrossRef CAS.
- R. Janzen, M. Schwarzer, M. Sperling, M. Vogel, T. Schwerdtle and U. Karst, Metallomics, 2011, 3, 847–852 RSC.
- Z. Pedrero Zayas, L. Ouerdane, S. Mounicou, R. Lobinski, M. Monperrus and D. Amouroux, Anal. Bioanal. Chem., 2013, 406, 1121–1129 CrossRef PubMed.
- S. Lindskog, Pharmacol. Ther., 1997, 74, 1–20 CrossRef CAS PubMed.
- B. Tilander, B. Strandberg and K. Fridborg, J. Mol. Biol., 1965, 12, 740–760 CrossRef CAS PubMed.
- R. S. Herrick, C. J. Ziegler and T. C. Leeper, J. Organomet. Chem., 2014, 751, 90–110 CrossRef CAS.
- D. Ekinci, S. Beydemir and Ö. I. Küfrevioglu, J. Enzyme Inhib. Med. Chem., 2007, 22, 745–750 CrossRef CAS PubMed.
- Z. Q. Zhang and A. G. Marshall, J. Am. Soc. Mass Spectrom., 1998, 9, 225–233 CrossRef CAS PubMed.
- K.-T. D. Lin and H. F. Deutsch, J. Biol. Chem., 1973, 248, 1885–1893 CAS.
- M. Moini, S. M. Demars and H. L. Huang, Anal. Chem., 2002, 74, 3772–3776 CrossRef CAS PubMed.
- J. T. Wilson, L. B. Wilson, V. B. Reddy, C. Cavallesco, P. K. Ghosh, J. K. deRiel, B. G. Forget and S. M. Weissman, J. Biol. Chem., 1980, 255, 2807–2815 CAS.
- R. M. Lawn, A. Efstratiadis, C. O'Connell and T. Maniatis, Cell, 1980, 21, 647–651 CrossRef CAS PubMed.
- V. A. Pashynska, H. Van den Heuvel, M. Claeys and M. V. Kosevich, J. Am. Soc. Mass Spectrom., 2004, 15, 1181–1190 CrossRef CAS PubMed.
- L. E. Henderson, D. Henriksson and P. O. Nyman, J. Biol. Chem., 1976, 251, 5457–5463 CAS.
| This journal is © The Royal Society of Chemistry 2016 |

