CdTe quantum dots@luminol for trace-level chemiluminescence sensing of phenacetin based on biological recognition materials
Huimin
Duan
,
Leilei
Li
,
Xiaojiao
Wang
,
Yanhui
Wang
,
Jianbo
Li
and
Chuannan
Luo
*
Key Laboratory of Chemical Sensing & Analysis in Universities of Shandong (University of Jinan), School of Chemistry and Chemical Engineering, University of Jinan, Jinan 250022, China. E-mail: chm_luocn@ujn.edu.cn; Tel: +86 0531 89736065
First published on 4th November 2015
Abstract
A trace-level chemiluminescent (CL) sensor for the determination of phenacetin, utilising CdTe quantum dots@luminol (QDs@luminol) for signal amplification, based on a chitosan/magnetic graphene oxide-molecularly imprinted polymer (CsMG-MIP) as a biological recognition material was fabricated. CdTe QDs@luminol, which was used in the preparation process for the sensor, could amplify the signal of the CL sensor through chemiluminescence resonance energy transfer (CRET) while reducing the consumption of luminol. The CsMG-MIP, taking full advantage of the abundant hydroxyl and amino groups in chitosan which provide a lot of sites for the formation of hydrogen bonds in SMIP, using graphene oxide to improve the adsorption capacity and Fe3O4 nanoparticles to make the preparation of the recognition unit simple and easy, was introduced into the CL sensor. Under the optimized conditions of the CL sensor, phenacetin could be assayed in the range of 3.0 × 10⁻⁹–3.0 × 10⁻⁷ mol L−1 with a detection limit of 8.2 × 10⁻¹⁰ mol L−1 (3δ). With the advantages of amplifying the CL signal through CRET and reducing the consumption of luminol simultaneously, the sensor was successfully applied to the determination of trace-level phenacetin in real samples with a high selectivity and with the reagent economized.
1. Introduction
As it can cause methemoglobinemia, renal failure and even cancer in large doses or when used for a long period of time, phenacetin has been withdrawn from the market in many countries.1,2 In China and other countries, though it has strict requirements on dosage, phenacetin has not been completely banned. Thus, the accurate control of phenacetin content in tablets is very important. Up to now, methods reported for the determination of phenacetin have been electrochemical sensors,3 high performance liquid chromatography,4 biomimic bulk acoustic wave methods5 and spectrophotometric methods.6 Nevertheless, these methods are more or less limited by complicated processes, expensive equipment or high costs during their procedures. Hence, the development of a higher efficiency method for the detection of phenacetin is of significant importance. With the advantages of high sensitivity, simple instrumentation and no interference from background light scattering, chemiluminescence (CL) techniques have been developed to be a powerful tool over the past several decades in various fields7 and the CL of CdTe nanocrystals has been researched for several years.8,9In nanoscale space, with their properties positively changed following the structural change of their diameter, quantum dots (QDs) are an important part of nanometre science and technology.10 Due to their unique optical and physical properties such as high photostability, broad absorption spectra and narrow emission range, QDs have attracted much attention and have been used in in vivo imaging,11 fluorescence probes12 and biological luminescent labels13etc. With the booming research of QDs, QD compounds are also an exciting direction for the nanoscience field in the current century.14 CdTe QDs@luminol conjugates, a modification of the surface of QDs with luminol, could proceed with intermolecular resonance energy transfer between the chemiluminescent donor luminol and receptor QDs.15 With changes to the surface of QDs, their properties, in particular the CRET process, change accordingly.16,17 It was found that CdTe QDs@luminol is a potential material that could amplify CL signals with a higher CRET efficiency.15
Chemiluminescence resonance energy transfer (CRET) has been applied to the detection domain by using intra and intermolecular energy transfer processes since it was first put forward.18 The advantages of CRET were that no fluorescent light source, which could minimize the nonspecific signal caused by external light excitation which is often observed in fluorescence-based measurements, was necessary.19 CRET is a widely applied technique due to its dramatic reduction of the fluorescence bleaching and lessening of the autofluorescence of a system.
At present, as biological recognition materials, molecular imprinting polymers (MIPs) have been developed since they were first pioneered by Wulff20 in the early 1970s and have been applied in many fields.21 In recent years, basically because of its high specific surface area, and unique thermal and mechanical properties, graphene oxide (GO) has attracted considerable attention22,23 and is widely used in many fields.24 Due to its high specific surface area, GO could be used as a supporting plane in synthesizing new materials just like what we have done in this paper. Magnetic graphene oxide (MG) has attracted great attention in various application areas.25 The advantages of chitosan/magnetic graphene oxide (CsMG), including easy separation, stable physical properties, low toxicity and eco-friendliness were utilised incisively and vividly.
In this work, based on intramolecular CRET in CdTe QDs@luminol, a trace-level CL sensor with CsMG-MIP as the biological recognition material for phenacetin determination was established. In the CdTe QDs@luminol–CsMG-MIP CL sensor, CdTe QDs@luminol could not only amplify the signal of the CL greatly using CRET but also reduced the consumption of luminol. CsMG-MIP, taking full advantage of the abundant hydroxyl and amino groups in chitosan which could provide a lot of sites to form hydrogen bonds in SMIP, using graphene oxide to improve the adsorption capacity and Fe3O4 nanoparticles to make the preparation of the recognition unit simple and easy, could improve the selectivity and made the preparation process simple. Under the chosen conditions of CL, the CdTe QDs@luminol–CsMG-MIP-CL sensor was applied in the detection of phenacetin in real samples, and the sensor showed high sensitivity and selectivity.
2 Experimental
2.1 Chemicals and materials
Phenacetin (98%) and ethylene glycol dimethacrylate (EGDMA, A.R.) were supplied by Aladdin Industrial Co. (China); acrylamide (A.R.), CdCl2·2H2O (A.R.), 2,2-azobisisobutyronitrile (AIBN, A.R.), sodium thioglycolate (80%) and KBH4 (96%) were purchased from Sinopharm Chemical Reagent Co. Ltd (China); the ethanol, acetic acid, potassium hydroxide, methanol, luminol and all the other chemicals unless specified were of analytical reagent grade and used without further purification.EGDMA was distilled under operation pressure to remove inhibitors and AIBN was recrystallised with methanol prior to its first use. Redistilled water was used throughout the work.
2.2 The CdTe QDs@luminol–CsMG-MIP CL sensor
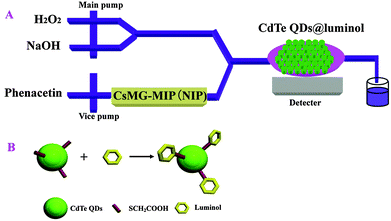
The IFFM-E flow injection CL analyzer (Xi'an Remex Electronic instrument High-Tech Ltd., China) was equipped with an automatic injection system and a detection system. PTFE tubes (id. 0.8 mm) were used to connect all of the components in the flow system. A glass capillary filled with CdTe QDs@luminol was positioned on the CL detection window. A certain amount of CsMG-MIP (CsMG-NIP) was placed in front of the CL analyser as the recognition element. The CL signal was recorded by a computer and the data was transposed by software. The mechanism of the sensor used in this work is shown in Fig. 1(A).2.3 Preparation of CdTe QDs@luminol
Thioglycolic acid capped CdTe QDs and CdTe QDs@luminol were synthesized according to a modified procedure described in the previous literature.15 The preparation process of CdTe QDs@luminol is shown in Fig. 1(B).Firstly, NaHTe solution was added to N2-saturated 0.1142 g CdCl2·2H2O solution in the presence of sodium thioglycolate and degassed with N2. Then, the pH of the solution was adjusted to 9.5. The reaction solution was heated and refluxed to prepare thioglycolic acid-capped CdTe QDs. Luminol was conjugated to thioglycolic acid-capped CdTe QDs using EGDMA as a coupling reagent. CdTe QDs were added into 1.0 mL of luminol–H3BO3–KOH buffer solution containing 0.01 g of EGDMA. Then, the mixture was stirred for 2 h. Finally, the prepared solution was purified by precipitation with methanol. The final product was dried in an oven for use.
2.4 Preparation of CsMG-MIP and CsMG-NIP
Graphene oxide was prepared from natural graphite powder using a modified Hummers method26 as shown in our previous work.27 5.0 g of graphite powder was added into a 500 mL flask containing 180 mL of H2SO4 and 20 mL of HNO3 and then cooled. After being well dispersed, 15 g of KMnO4 was added under stirring. When the color turned brownish, 150 mL of H2O2 was slowly added to the paste with agitation. Then, the mixture was washed until the pH reached 7 while under ultrasonication and was then dried to produce GO.CsMG was prepared according to the previous literature28 and the methods shown in our previous work.27 After suspending 0.2 g of chitosan in 40 mL of 2% acetic acid by ultrasonication, 0.1 g of magnetic particles and 0.1 g of GO were added to the molten chitosan under stirring. Then, 6 mL of glutaraldehyde was added to the mixed solution. Then, sodium hydroxide was added until the pH reached 10.5. The reaction was carried out and the precipitate was isolated in the magnetic field, washed and dried.
Preparation of the phenacetin–CsMG-MIP and phenacetin–CsMG-NIP was carried out according to previous reports.29 0.8 mmol of methacrylic acid and 0.2 mmol of phenacetin were dispersed into 30 mL of ethanol. After shaking, 0.05 g of CsMG, 8.0 mmol of EGDMA and 30 mg of AIBN was added under nitrogen protection at 65 °C. Then, the mixture was shaken for 8 h. The obtained product was washed and dried. The CsMG-NIP was prepared in the same way, but without the addition of phenacetin.
2.5 Adsorption performance of CsMG-MIP and CsMG-NIP
The adsorption capacities of CsMG-MIP and CsMG-NIP for phenacetin were investigated as follows: 20.0 mg of CsMG-MIP (CsMG-NIP) was mixed with 10.0 mL of phenacetin solution (1.0 × 10⁻² mol L−1) in a 50 mL iodine flask and oscillated for 24 h for adsorption.3 Results and discussion
CdTe QDs@luminol used for signal amplification based on CRET and CsMG-MIP used as a biological recognition material were synthesized to develop a CL sensor for the trace-level determination of phenacetin.3.1 Characterization of GO, CsMG, CsMG-MIP and CsMG-NIP
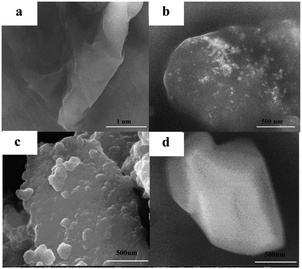
SEM was used to characterize the surface morphology of the GO (a), CsMG (b), CsMG-MIP (c) and CsMG-NIP (d), and the SEM images are shown in Fig. 2. As it can be observed in Fig. 2(a), the image shows that the prepared GO presented a sheet-like structure with a small thickness, smooth surface, and wrinkled edge. The folding nature is clearly visible. As it is shown in Fig. 2(b), the Fe3O4 spheres were uniformly decorated and anchored on the wrinkled GO layers with a high density. Hence, we considered that the Fe3O4 NPs were stably attached to the GO surface which served as a stabilizer against the aggregation of GO and enable the easy separation of the products.The SEM images of CsMG-MIP and CsMG-NIP are shown in Fig. 2(c) and (d) respectively. As we can see, the surface of the synthesized CsMG-MIP was rough while the surface of the CsMG-NIP was very smooth. The cavities on the CsMG-MIP were suitable for the recognition of phenacetin. These obvious differences between the CsMG-MIP and the CsMG-NIP indicated the successful synthesis of imprinting cavities on the surface of the CsMG-MIP.
3.2 Characterization of CdTe QDs and CdTe QDs@luminol
The FTIR spectrum of the CdTe QDs and the CdTe QDs@luminol particles were recorded within the range of 4000–500 cm−1, and are shown in Fig. 3(a). The peak at 670 cm−1 is the stretching vibration of C–S. It can be seen that the stretching vibration of the secondary amine contributed to the strong adsorption at 3350 cm−1. In the spectra of CdTe QDs@luminol, peaks at around 1108 and 1680 cm−1 were due to the bending and stretching vibrations of C![[double bond, length as m-dash]](https://www.rsc.org/images/entities/char_e001.gif) O respectively, which provided evidence of the successful preparation of CdTe QDs@luminol.
O respectively, which provided evidence of the successful preparation of CdTe QDs@luminol.
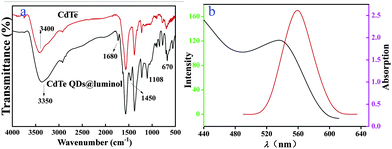 | ||
| Fig. 3 The FTIR spectra of CdTe QDs and CdTe QDs@luminol (a); the adsorption (red line) and emission (green line) spectra of CdTe QDs (b). | ||
As we can see in Fig. 3(b), the first adsorption peak of CdTe QDs is located at about 530 nm and a symmetric emission peak is located at about 560 nm. The relatively narrow emission peak was a signature of a narrow distribution of QD diameters.
3.3 Adsorption capacities of CsMG-MIP and CsMG-NIP
The amount of phenacetin adsorbed by the CsMG-MIP determined the adsorption capacity which not only influenced the detection limit but also the selectivity of the method. The adsorption capacity (Q) was calculated using the following formula:where c0 and ce (mol L−1) are the initial concentration of phenacetin in the solution and supernatant respectively, V (L) is the volume of the initial solution and m (g) is the mass of CsMG-MIP or CsMG-NIP.
The Q of phenacetin on the maximum adsorptions of CsMG-MIP and CsMG-NIP were 12.3 × 10⁻⁵ mol g−1 and 1.6 × 10⁻⁵ mol g−1. Because of the complementary spatial structure imprinted cavities on the surface of the CsMG-MIP, the target molecules could be adsorbed in a high concentration and rapidly by CsMG-MIP. In contrast, a poor adsorption capacity for the CsMG-NIP was obtained due to the absence of imprinting cavities. The results demonstrated that the CsMG-MIP was suitable for use in a CL sensor.
3.4 CL reaction conditions
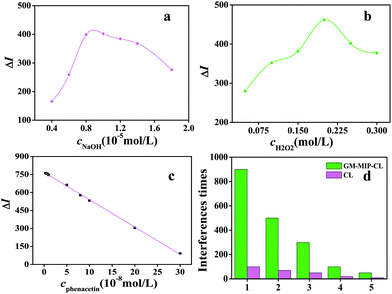
The concentrations of H2O2 and NaOH had great effects on the CL reaction. The optimal concentration conditions were 1.0 × 10⁻⁵ mol L−1 of NaOH and 0.2 mol L−1 of H2O2, respectively, as shown in Fig. 4(a) and (b).3.5 Analytical performance of the CdTe QDs@luminol–CsMG-MIP-CL sensor
Under the optimum conditions (c(H2O2) = 0.2 mol L−1, c(NaOH) = 1.0 × 10⁻⁵ mol L−1, the required amount of CdTe QDs@luminol), the analytical performance of the proposed CdTe QDs@luminol–CsMG-MIP-CL sensor was studied. The calibration was linear in the range of 3.0 × 10⁻⁹–3.0 × 10⁻⁷ mol L−1 and was described by the calibration curve ΔI = 769–2.3 × 10⁹c (mol L−1, R2 = 0.9992) shown in Fig. 4(c). The RSD was 2.9% (n = 11) for determination of 1.0 × 10⁻⁸ mol L−1 of phenacetin, and the detection limit was 8.2 × 10⁻¹⁰ mol L−1 (3δ), which was compared with conventional methods, and the results are shown in Table 1. The CL sensor, which used CdTe QDs@luminol as a CL signal amplifier and CsMG-MIP as the recognition material, exhibited a low detection limit and high sensitivity and selectivity.3.6 Interference study on the CdTe QDs@luminol–CsMG-MIP-CL sensor
Some chemically active compounds in the samples can also be oxidized under the same conditions. The interferences caused by these compounds were researched in detail. As shown in Fig. 4(d), the tolerable limits of coexistent species were taken as a relative error no larger than 5% in the standard solution of phenacetin with a concentration of 1.0 × 10⁻⁸ mol L−1. Interferences from aminopyrine, paracetamol and epinephrine are very serious because their spatial structures are similar to that of phenacetin. Critically, these compounds usually coexist in real samples. Conversely, they could only have small interferences when using CsMG-MIP, as the imprinting cavities on the surface of the CsMG-MIP could recognize and adsorb phenacetin specially and could not recognize and adsorb aminopyrine, paracetamol or epinephrine, which meant that only small interferences could be observed from aminopyrine, paracetamol or epinephrine when using CsMG-MIP. The above evidence gives persuasive proof that CsMG-MIP can be used as a pretreatment material to improve the selectivity of the CL sensor.3.7 Application of the CdTe QDs@luminol–CsMG-MIP CL sensor
To assess the performance of the proposed sensor for real pharmaceutical applications, samples were obtained from Qutong tablets and Children’s keganmin powder for analysis. In order to research the application of the sensor in complicated biological samples, matrix samples containing dyes, some biomacromolecules and food additives were mixed up with the waste water from our laboratory. The analytical results obtained under the optimal experimental conditions are shown in Table 2 and demonstrate that the use of the CdTe QDs@luminol–CsMG-MIP CL sensor for the determination of phenacetin is practical.| Sample | c (10−8 mol L−1) (n = 6) | RSD (%) | Added (10−8 mol L−1) | Found (n = 6) | Recovery (%) |
|---|---|---|---|---|---|
| Qutong tablet | 3.3 | 3.2 | 3.0 | 6.0 | 91 |
| 5.0 | 8.1 | 94 | |||
| Children keganmin powder | 5.7 | 3.7 | 3.0 | 8.8 | 102 |
| 5.0 | 10.4 | 95 | |||
| Complicated biological samples | 5.1 | 3.7 | 3.0 | 7.8 | 90 |
| 5.0 | 9.5 | 88 | |||
3.8 The possible CL mechanism
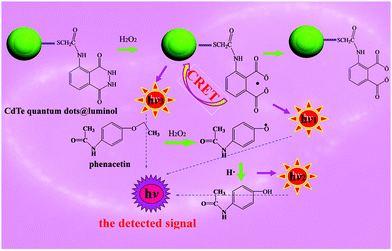
Thioglycolic acid capped CdTe QDs, chemically modified by luminol were used as a signal amplifier based on intramolecular CRET in CdTe QDs@luminol to determine phenacetin with a CsMG-MIP CL sensor. The first use of CdTe QDs@luminol in the analytical domain was a great success. The possible CL mechanism is shown in Fig. 5. At the beginning, the oxidized-state of the luminol reverting back to the ground state would emit photons, producing ‘hν1’. Then, the intramolecular CRET in the CdTe QDs@luminol conjugate, which was due to the overlapping areas between the emission spectrum of luminol and the adsorption spectrum of CdTe QDs, could amplify the CL intensity which occurred by using a luminol–H2O2 system as an energy donor and the CdTe QDs as an acceptor. High-energy CdTe QDs returned to the ground state by photon emission, producing ‘hν2’. For the existence of luminol in the CL system, the mechanism could be that either the CdTe QDs were the final emitter due to CRET, or a catalyst for the final emission from the excited-state of phenacetin. It was also possible that the direct oxidation of the CdTe QDs and the CRET process took place simultaneously. On the other hand, for the excited-state phenacetin, which was oxidized by H2O2 and was full of energy before returning to the ground state, the ‘hν3’ intensity was enhanced and it showed an increase in CL signal with the increase of phenacetin correspondingly. In conclusion, the detected signal was the CL of luminol, the fluorescence of CdTe QDs excited by the CL of luminol and the CL of phenacetin. This route has clearly indicated that CdTe QDs@luminol was remarkably effective for the detection of phenacetin.4 Conclusion
Firstly, thioglycolic acid capped CdTe QDs chemically modified by luminol and the biological recognition material chitosan/magnetic graphene oxide-molecularly imprinted polymer were synthesized. Secondly, the adsorption capacity of chitosan/magnetic graphene oxide-molecularly imprinted polymer was studied and found to be 12.3 × 10⁻⁵ mol g−1. Thirdly, the effects of the luminous reagents’ concentrations on the chemiluminescence were explored. Fourthly, the regression curve, linear range, detection limit and interference were investigated. The detection limit was 8.2 × 10⁻¹⁰ mol L−1 (3δ) which was lower than traditional methods. Finally, the interference and reusability of chitosan/magnetic graphene oxide-molecularly imprinted polymer was discussed. It was found that the proposed sensor was able to analyse trace-level phenacetin extraordinarily well in complex samples with high sensitivity and selectivity and in a reagent economizing way.Acknowledgements
This work was supported by the National Natural Science Foundation of China (NSFC, No. 21345005 and 21205048) and the Shandong Provincial Natural Science Foundation of China (No. ZR2012BM020).References
- C. B. Jensen and D. J. Jollow, Toxicol. Appl. Pharmacol., 1991, 111, 1–12 CrossRef CAS PubMed.
- M. G. Dominguez, J. M. Yuan, J. E. Castelao, R. K. Ross and M. C. Yu, Br. J. Cancer, 1999, 81, 542–548 CrossRef PubMed.
- L. Jiang, S. Q. Gu, Y. P. Ding, F. Jiang and Z. Zhang, Nanoscale, 2014, 6, 207–214 RSC.
- J. Jurica, J. Konecny, L. Z. Zahradnikova and J. Tomandl, J. Pharm. Biomed. Anal., 2010, 52, 557–564 CrossRef CAS PubMed.
- Y. G. Tan, H. Peng, C. D. Liang and S. Z. Yao, Sens. Actuators, B, 2001, 73, 179–184 CrossRef CAS.
- P. Nagaraja, K. C. S. Murthy and K. S. Rangappa, J. Pharm. Biomed. Anal., 1998, 17, 501–506 CrossRef CAS PubMed.
- G. Periyasami, L. Martelo, C. Baleizao and M. N. Berberan-Santos, New J. Chem., 2014, 38, 2258–2261 RSC.
- Z. Wang, J. Li, B. Liu, J. Hu and X. Yao, J. Phys. Chem. B, 2005, 109, 23304–23311 CrossRef CAS PubMed.
- Y. Wang, J. Lu, L. Tang, H. Chang and J. Li, Anal. Chem., 2009, 81, 9710–9715 CrossRef CAS PubMed.
- X. H. F. S. Kanwal and X. G. Su, Microchim. Acta, 2010, 169, 167–172 CrossRef.
- K. Yang, Y. A. Cao, C. M. Shi, Z. G. Li, F. J. Zhang, J. Yang and C. Zhao, Oral Oncol., 2010, 46, 864–868 CrossRef PubMed.
- L. Li, Q. L. Zhang, Y. P. Ding, X. Y. Cai, S. Q. Gu and Z. Y. Cao, Anal. Methods, 2014, 6, 2715–2721 RSC.
- H. Zhang, X. J. Hu and X. Fu, Biosens. Bioelectron., 2014, 57, 22–29 CrossRef CAS PubMed.
- J. Zhang and B. Li, Spectrochim. Acta, Part A, 2014, 125, 228–233 CrossRef CAS PubMed.
- Z. Li, Y. X. Wang, G. X. Zhang, W. B. Xu and Y. J. Han, J. Lumin., 2010, 13, 995–999 CrossRef.
- R. Gill, M. Zayats and I. Willner, Angew. Chem., Int. Ed., 2008, 47, 7602–7625 CrossRef CAS PubMed.
- X. Q. Liu, R. Freeman, E. Golub and I. Willner, ACS Nano, 2011, 5, 7648–7655 CrossRef CAS PubMed.
- J. S. Lee, H. A. Joung, M. G. Kim and C. B. Park, ACS Nano, 2012, 6, 2978–2983 CrossRef CAS PubMed.
- H. Mun, E. J. Jo, T. H. Li, H. A. Joung, D. G. Hong and M. G. Kim, Biosens. Bioelectron., 2014, 58, 308–313 CrossRef CAS PubMed.
- G. Wulff and A. Sarhan, Angew. Chem., Int. Ed. Engl., 1972, 11, 341 CAS.
- Y. K. Lv, Y. D. He, X. Xiong, J. Z. Wang, H. Y. Wang and Y. M. Han, New J. Chem., 2015, 39, 1792–1799 RSC.
- T. Xue, X. Cui, W. Guan, Q. Wang, C. Liu and W. Zheng, Biosens. Bioelectron., 2014, 58, 374–379 CrossRef CAS PubMed.
- D. Chen, H. Feng and J. Li, Chem. Rev., 2012, 112, 6027–6053 CrossRef CAS PubMed.
- Y. Wang, L. Tang, Z. Li, Y. Lin and J. Li, Nat. Protoc., 2014, 9, 1944–1955 CrossRef CAS PubMed.
- A. Hu, X. Chen, Y. Tang, Q. Tang, L. Yang and S. Zhang, Electrochem. Commun., 2013, 28, 139–142 CrossRef CAS.
- W. S. Hummers and R. E. Offeman, J. Am. Chem. Soc., 1958, 80, 1339 CrossRef CAS.
- H. Qiu, C. Luo, M. Sun, F. Lu, L. Fan and X. Li, Carbon, 2012, 50, 4052–4060 CrossRef CAS.
- M. Z. Kassaee, E. Motamedi and M. Majdi, Chem. Eng. J., 2011, 172, 540–549 CrossRef CAS.
- G. Cirillo, M. Curcio, O. I. Parisi, F. Puoci, F. Iemma, U. G. Spizzirri, D. Restuccia and N. Picci, Food Chem., 2011, 125, 1058–1063 CrossRef CAS.
| This journal is © The Royal Society of Chemistry and the Centre National de la Recherche Scientifique 2016 |

