Preparation of disordered carbon from rice husks for lithium-ion batteries
Yi
Li
a,
Fengying
Wang
a,
Jicai
Liang
a,
Xiaoying
Hu
b and
Kaifeng
Yu
*a
aKey Laboratory of Automobile Materials, Ministry of Education, and College of Materials Science and Engineering, Jilin University, Changchun 130025, P. R. China. E-mail: yukf@jlu.edu.cn
bCollege of Science, Changchun University, Changchun, P. R. China
First published on 27th October 2015
Abstract
Rice husk (RH) was employed as a precursor for the preparation of disordered carbon for lithium-ion batteries. Disordered carbon was synthesized by pyrolysis of RH under an inert gas atmosphere followed by base treatment to remove the silica fraction. These carbons were characterized through X-ray diffraction (XRD), Brunauer–Emmett–Teller (BET) measurements, scanning electron microscopy (SEM), Raman spectroscopy and transmission electron microscopy (TEM). The effects of reaction temperature for NaOH treatment on the capacity of these carbons were described. These carbons showed a high reversible capacity of 502 mA h g−1 after 100 cycles at 0.2 C in lithium-ion battery anodes.
1. Introduction
With the growth of the global population and economy, energy consumption has increased dramatically throughout the world. Currently, the world's energy sources are mainly dependent on fossil fuels (coal, petroleum, and natural gas). The main issue of using fossil fuels is that they are nonrenewable and produce CO2 and other greenhouse gases.1 There is increasing pressure for almost every manufacturer to go “green” and seek sustainable development, especially for the energy industry which is highly dependent on fossil fuels.2 Wind and hydropower are renewable sources and are environmentally friendly, but the facilities to produce energy from both these sources are high cost. Hence, the search for low-cost, clean and renewable energy materials, as well as their related devices, has aroused interest worldwide in recent years.3,4 Since lithium-ion secondary batteries were commercialized by SONY in 1991, they have become the best portable energy storage devices for the consumer electronics market.5 The application of lithium batteries is being extended to a variety of consumer and military applications where they are generally considered as one of the most state-of-the-art power devices, in conjunction with fuel cells and supercapacitors.6,7 Due to their low cost, eco-friendliness, high electrical conductivity, good electrocatalytic activity and chemical stability, as well as their low electrochemical potential toward lithium intake, carbonaceous materials have been widely studied as anode materials for rechargeable lithium-ion batteries (LIBs).7At present, graphite, a carbonaceous material with the highest degree of graphitization, as a commercial anode material for LIBs possesses the advantages of high Coulombic efficiency and good cycle stability.8,9 However, the low theoretical capacity (372 mA h g−1) and poor rate capability of commercialized graphite anode materials cannot meet the ever-increasing energy demands of portable electronics and practical electric vehicles.10,11 The intense search for alternative anode materials capable of intercalating larger amounts of lithium has led to the synthesis of many unique disordered carbon materials which possess high potential in many applications, including adsorption, gas storage, energy storage and conversion.12 Disordered carbons are widely used as anode materials for lithium-ion batteries due to their stable cycle performance, high specific capacity and negative redox potentials.13 A variety of carbonaceous materials used as anodes of lithium-ion batteries have been prepared by pyrolysis of biomass precursors such as sugar, cotton fibers, coffee beans, walnuts, rice husk and wood.5,14 The capacity of such materials is critically dependent on the pyrolysis conditions and the precursor sources.15 To lower the cost of raw materials, the selection of a precursor has been shifted to natural or agricultural residues in this work.
Recently, as a renewable source, biomass has attracted much attention for its application in the preparation of disordered carbon. Rice husk (RH) is a kind of agricultural biomass waste in rice-producing countries and has the advantages of being inexpensive and widely available.16 The annual yield of rice is about 600 million tons worldwide, which generates more than 100 million tons of rice husks (RHs).17,18 RH usually has a light weight, hence, the disposal of RH can be a problem. As a result, a great amount of RHs are burnt through wildfires or post-harvest burning of cultivation fields,19 which can cause air pollution and waste of resources. In some areas, RHs are used for fuel due to their high calorific power. The major components of RH are SiO2, cellulose (38%), hemicelluloses (18%), and lignin (22%), which yield carbon when pyrolyzed under an inert atmosphere.17 RH is the most studied carbon precursor among rice waste.19 The process of preparing disordered carbons from RH involves carbonation, pulverisation, chemical treatment, and activation. Fey's group reported the use of rice husk as a precursor for the preparation of pyrolytic carbons which were used as a negative electrode in Li ion batteries. High insertion capacities of 819 mA h g−1 were observed for carbon obtained from rice husk treated with 0.3 M NaOH.17 In this paper, we report the results of our work on the pyrolytic synthesis of carbons from RH, and their structural and electrochemical characteristics. The RH-derived carbon has advantages like low cost and an abundance of raw materials, and the carbon exhibits stable electrochemical performance. Furthermore, the preparation process of RH-derived carbon in this paper is very simple and low cost.
2. Results and discussion
Fig. 1a displays the TG trace recorded for the RH sample between room temperature and 900 °C at a heating ramp of 5 °C min−1 in nitrogen. The weight loss observed around 115 °C is due to the loss of superficial moisture and other light volatiles from the RHs. The active pyrolysis zone for the RHs was between 250 and 380 °C, which is attributed to the evolution of volatiles emanating upon decomposition of primary hemicellulose and cellulose.14 A third weight loss centered between about 400 and 500 °C is due to the loss of volatile vapors and aromatic condensation processes that are part of the intricate pyrolytic reactions. The decomposition of the precursor is completed around 500 °C and any change that occurs beyond this temperature is attributed to carbon layer organization.6 X-ray diffraction patterns of the carbons pyrolyzed at 500 °C are shown in Fig. 1b. The patterns of the two samples show no characteristic peaks, indicating that both samples exhibit the turbostratic structure of disordered carbon material.16 The diffraction patterns which give a broad peak for the (002) reflection around 22° suggest small domains of coherent and parallel stacking of the graphene sheets. A weak broad peak corresponding to the (100) reflections can be seen around 44°, indicating the presence of honeycomb structures formed by sp2 hybridized carbons.20 Moreover, no sharp peaks are observed in the XRD patterns, which indicates their amorphous state.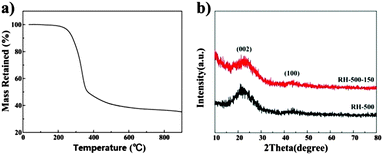 | ||
| Fig. 1 (a) TG curves of rice husk in nitrogen, (b) XRD patterns of RH-500 and RH-500-150, respectively. | ||
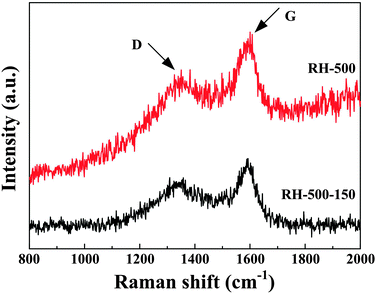
The Raman spectra of the carbons are shown in Fig. 2. The G-band appearing at 1590 cm−1 is attributed to the vibration of sp2-bonded carbon atoms in a 2D hexagonal lattice, while the peak of the D-band near 1340 cm−1 is related to edges, other defects, and disordered carbon in the graphitic structure. The ID/IG intensity ratio of RH-500-150 is 0.88, which is higher than that of RH-500 (ID/IG = 0.79). This represents a higher degree of disorder, more edges, and more other defects, which favors an enhanced reversible capacity of the anode.2,4,5
The morphology of the samples was characterized by SEM and TEM, and the results are shown in Fig. 3. Fig. 3a and b show the SEM and EDS of the samples; it can be seen that there is no obvious evidence of macropore formation. The particles do not have a definite shape for all of the samples. From Fig. 3a, it can be seen that the RH-500 sample exhibits a smooth surface, while Fig. 3b shows that the surface of the carbons is relatively rough, mainly due to the surface of the samples being corroded by NaOH solution. From the EDS of the samples, it can be seen that the content of silicon decreased obviously after base-treatment, which indicates the generation of pores due to the removal of SiO2. TEM images of RH-500 and RH-500-150 are shown in Fig. 3c and d. From the TEM image (Fig. 3c) of RH-500, there are no obvious pores on the surface of RH-500, and the material is composed of flake structures, which form a fraction of the macropores. After treatment with NaOH solution, a large number of mesopores appear on the surface of RH-500-150, and the edge of RH-500-150 is obviously corroded (shown in Fig. 3d). From Fig. 3d, it can also be seen that RH-500-150 is a composite of large quantities of flake structures and slit-shaped mesopores due to the removal of SiO2.
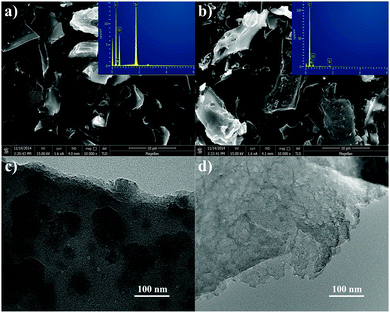 | ||
| Fig. 3 (a) and (b) SEM images of RH-500 and RH-500-150, respectively; the insets of (a) and (b) are EDS spectra; (c) and (d) TEM images of RH-500 and RH-500-150, respectively. | ||
Fig. 4a shows the nitrogen adsorption isotherms for RH-500 and RH-500-150. According to the isotherm and the BET surface area value (only 8.57 m2 g−1) of the RH-500 sample, the material consists of non-porous or a fraction of macroporous structures. After treatment with NaOH solution, the RH-500-150 materials exhibit a type-IV isotherm with a type-H4 hysteresis loop, and the BET surface area is increased to 351.81 m2 g−1. The type-IV isotherm indicates the existence of mesopores and the type-H4 hysteresis loops suggests the presence of slit-shaped pores and the formation of slits due to the accumulation of flake particles in the materials.21,22 The pore size distribution of RH-500-150 is shown in Fig. 4b, and indicates that the materials are mainly composed of mesopores with a broad pore size distribution in the range 17–48 nm. Compared to RH-500, RH-500-150 presents a higher BET surface area, which is ascribed to changes in the pore structure caused by the removal of SiO2. The presence of slit-shaped mesopores in RH-500-150 allows easier and faster penetration of electrolytes, and easier and faster diffusion of lithium ions. The results of nitrogen adsorption–desorption of the carbons are consistent with TEM of the carbons.
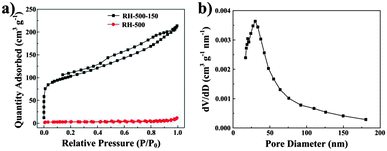 | ||
| Fig. 4 (a) Nitrogen adsorption–desorption isotherms of RH-500 and RH-500-150. (b) Pore size distribution of RH-500-150. | ||
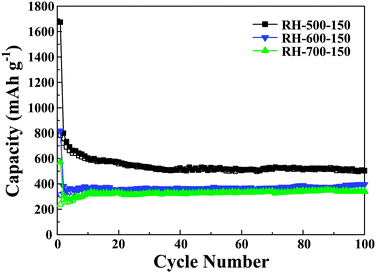
The electrochemical performance of the carbons as anode materials is investigated. Fig. 5 demonstrates the cycling performance of the RH-derived carbons under different calcination temperatures evaluated at a current density of 0.2 C for up to 100 cycles. It can be seen that the capacity of the carbons is decreased with increasing calcination temperature, which may be due to an increased degree of graphitization and the collapse of the mesopores at higher calcination temperatures. At low temperature (500 °C), there is insufficient thermal energy for the graphene sheets to rotate into a parallel alignment, which results in a large number of non-parallel and unorganized single layers of carbon in the low-temperature carbons. In addition, there are abundant mesopores in the low-temperature carbons. As a result, the number of sites for lithium insertion increases. With increasing temperature (increase to 600 or 700 °C), the thermal energies reach values high enough to break the links between adjacent sheets and favor alignment in parallel orientations; meanwhile, the mesopores collapse and fuse into macropores, which leads to a decrease in the number of sites for lithium insertion.5,23
Fig. 6a shows the cyclic voltammogram (CV) profiles of RH-500-150 electrodes at a scan rate of 0.1 mV s−1 between 0 and 3.0 V. Two main reduction peaks appear at around 0.65 and 1.45 V during the 1st reduction process for the RH-500-150 specimen. The peak at 1.45 V is assigned to the decomposition of the electrolyte and the formation of a solid electrolyte interface (SEI) film which is caused by electrolyte decomposition on the active electrode surface.5,24 The 0.65 V peak is stronger than the one at 1.45 V, which may be due to the reaction of the functional groups of the carbon with the lithium ions. No corresponding oxidation peaks are observed in the oxidation segment of the CV profile. Therefore, these two reactions are responsible for the obvious capacity loss in the first cycle.25 These peaks disappear after the 1st cycle, and the areas of the cathodic and anodic peaks tend to be equal to each other, implying the stability of the SEI layer and the structure of the carbon. Fig. 6b shows the discharge/charge profiles of RH-500-150 at a rate of 0.2 C. The initial discharge capacity of RH-500-150 is 1647 mA h g−1, corresponding to a Coulombic efficiency of 46.8%. A large irreversible capacity occurs during the 1st cycle for the carbon, which is a phenomenon seen in carbonaceous electrodes due to the formation of an SEI film. In fact, the SEI layer is advantageous, as it prevents the electrolyte from undergoing decomposition on the active electrode.4 However, the reversible capacity of the carbon becomes stable in the subsequent cycles. According to SEM, TEM and BET of the RH-500-150 sample, the high first-cycle insertion capacity is likely attributed to the high surface area, as well as the rough surface of the sample and the presence of a large number of slit-shaped mesopores.
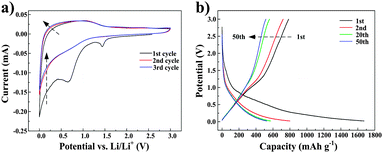 | ||
| Fig. 6 (a) Cyclic voltammogram (CV) profiles of RH-500-150, and (b) charge–discharge profiles of RH-500-150. | ||
Fig. 7a shows the cycling performance of the carbons evaluated at a current density of 0.2 C for up to 100 cycles. According to the curves, the capacity of the RH-500 carbon increases obviously up to 40 cycles, which can be attributed to the activation process of the anodes.26 This may be due to the SiO2 in the RH-500 carbon being electrochemically activated during the cycles.27 Compared with the RH-500 anode, the RH-500-150 anode shows excellent cyclability with high capacity. The Coulombic efficiencies were 90% or greater and increased dramatically to 95% after 5 cycles. After 50 cycles, the reversible capacity of the RH-500 anode is maintained at 354 mA h g−1; however, the reversible capacity of the RH-500-150 anode is maintained at 506 mA h g−1 and the Coulombic efficiency stabilizes at around 99%. After 100 cycles, the reversible capacity of the RH-500-150 anode is 502 mA h g−1 and the Coulombic efficiency is more than 100%. Furthermore, the rate performance of RH-500 and RH-500-150 were investigated at various rates from 0.2 to 10 C (Fig. 7b). At all current rates, RH-500-150 shows a higher capacity than RH-500. At a current rate of 10 C, the RH-500-150 electrode shows a reversible capacity of 172 mA h g−1, whereas the capacity of RH-500 is as low as 21 mA h g−1. The reversible capacity of 657 mA h g−1 is restored when the current density is reversed to 0.2 C, demonstrating the excellent rate performance of RH-500-150. The reversible capacity of RH-500-150 increases dramatically when the current density is reversed to 0.2 C, due to the activation process of the anodes. The high initial reversible and irreversible capacities of the RH-derived carbons are attributed to the high H/C ratios (Table 1) since Li atoms can bind in the vicinity of the H atoms in hydrogen-containing carbons.4,6 The presence of a large number of nanopores and high surface areas with reactive functional groups that provide ample sites for passivation also play an important role in the high reversible capacities.6
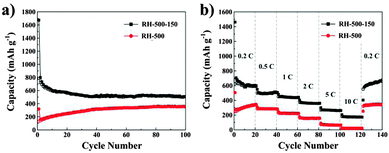 | ||
| Fig. 7 (a) Cycling performance profiles of RH-500 and RH-500-150; (b) rate performance of RH-500 and RH-500-150. | ||
| Sample | Percentage composition | |||
|---|---|---|---|---|
| C% | H% | N% | H/C | |
| RH-500 | 52.29 | 1.577 | 0.50 | 0.362 |
| RH-500-150 | 84.66 | 2.077 | 0.96 | 0.294 |
Although the RH-derived carbon exhibits a high irreversible capacity, this type of carbon has advantages like low cost and an abundance of raw materials, and it possesses stable electrochemical performance.
3. Conclusions
In summary, disordered pyrolytic carbons derived from RH have been shown to possess high capacities for lithium intake. The treatment of the carbon with 2 mol L−1 NaOH solution at 150 °C for 3 h results in carbon materials with a 33-fold increase in surface area, and an initial discharge capacity of 1647 mA h g−1 at 0.2 C in lithium-ion battery anodes. These carbons showed a high reversible capacity of 502 mA h g−1 after 100 cycles at a current density of 0.2 C. The high capacities in these disordered carbons are believed to be caused by the binding of lithium on the extra surfaces of the single layers of carbon and in the nanocavities. Although these carbons exhibit high capacities, their high irreversible capacities and continued loss of capacity with cycling are major concerns for their application in lithium-ion batteries. The preparation process of the disordered carbon still needs to be further refined to lower the irreversibility capacity loss and to increase the cycle life. The simple and low-cost synthesis procedure described here will open up new avenues for the preparation of carbon electrode materials.4. Experimental section
4.1 Preparation of disordered carbon
Carbon samples for this work were synthesized as described below. The raw material was obtained from a local rice mill and thoroughly washed with deionized water to remove adherent soil and clay, then dried in an oven overnight. About 7 grams of the dried husk was transferred into a horizontal tube furnace, which was then purged with nitrogen for 30 min. The tube was heated at a heating ramp of 5 °C min−1 in a nitrogen atmosphere and was held at 500 °C for 3 h. After natural cooling to room temperature, the black residues (about 2.5 g) were ground into fine powders and then refluxed with 2 mol L−1 HCl solution at 80 °C in a water bath for an hour. After leaching, the specimens were thoroughly washed with deionized water until the filtrate was free from acid, and the water in the sample was allowed to evaporate in an oven overnight. The dried samples, denoted as RH-500, were treated with 2 mol L−1 NaOH solution using a hydrothermal method to remove silica from the RH in a reactor at 150 °C for 3 h. After leaching, the samples were thoroughly washed with deionized water to remove the activating agent until pH 7, and were dried in an oven. The final products were denoted as RH-500-150. In order to obtain a better understanding of the electrochemical performance of the RHs, the RHs were treated at different calcination temperatures (600 °C and 700 °C). The subsequent processes were the same as those described above. The final products were denoted as RH-600-150 and RH-700-150, respectively.4.2 General characterization
Powder X-ray diffraction was performed (Siemens D 5000 X-ray diffractometer) with nickel-filtered Cu Ka radiation. The data were collected between scattering angles (2y) of 10° and 80° (2θ) in steps of 0.05°. Raman spectra were recorded on a Renishaw inVia instrument. The morphology of the disordered carbons was observed by scanning electron microscopy (SEM) and energy dispersive spectrometry (EDS) with a field-emission-scanning electron microscope (JEOL JSM-6700F). The specific surface area and pore size distribution of the carbons were measured using nitrogen adsorption–desorption measurements (Micromeritics, ASAP 2420). The microstructures of the carbons were examined by transmission electron microscopy (JEM-2100F). The samples for TEM studies were prepared by dispersing powders of the products in ethanol, placing a drop of the clear solution on a carbon coated copper grid and subsequent drying. Elemental analyses were performed on a FlashEA1112 spectrometer.4.3 Electrochemical measurements
The carbon electrodes for the cells were fabricated on a weight basis of 85 wt% RH-derived carbon, 5 wt% carbon black and 10 wt% PVDF. Excess N-methyl-2-pyrrolidone (NMP) was used and the mixture was stirred for at least 5 h until the paste reached a smooth syrupy viscosity, and a copper foil was coated with the mixed slurry. After drying at 120 °C in a vacuum oven for 12 h, circular discs were punched out, with the diameter of the circular discs being 10 mm. The carbon electrodes were coupled with lithium metal in a coin cell, with a 1 mol L−1 solution of LiPF6 in a 1![[thin space (1/6-em)]](https://www.rsc.org/images/entities/char_2009.gif) :
:![[thin space (1/6-em)]](https://www.rsc.org/images/entities/char_2009.gif) 1 (v/v) mixture of EC–DEC. All cells were assembled into 2025 button cells in an argon-filled glovebox with moisture and oxygen levels of less than 1 ppm. Galvanostatic charge–discharge profiles were recorded between 0.02 and 3.0 V at a 0.2 C (1 C = 372 mA h g−1) rate on a LAND (CT2001A) multi-channel battery tester. Cyclic voltammetry tests were performed on an electrochemical workstation (CHI660C) within a voltage window of 0–3.0 V and at a scan rate of 0.1 mV s−1.
1 (v/v) mixture of EC–DEC. All cells were assembled into 2025 button cells in an argon-filled glovebox with moisture and oxygen levels of less than 1 ppm. Galvanostatic charge–discharge profiles were recorded between 0.02 and 3.0 V at a 0.2 C (1 C = 372 mA h g−1) rate on a LAND (CT2001A) multi-channel battery tester. Cyclic voltammetry tests were performed on an electrochemical workstation (CHI660C) within a voltage window of 0–3.0 V and at a scan rate of 0.1 mV s−1.
Acknowledgements
This work is supported by the Key Scientific and Technological Project of Jilin Province, Project Grant No. 20140204052GX; Open Project of the State Key Laboratory of Inorganic Synthesis and Preparative Chemistry, College of Chemistry, Jilin University (No. 201505).Notes and references
- P. Poudel and Q. Qiao, Nano Energy, 2014, 4, 157–175 CrossRef CAS.
- S. X. Wang and L. P. Yang, ACS Appl. Mater. Interfaces, 2013, 5, 12275–12282 CAS.
- Y. Q. Sun, Q. Wu and G. Q. Shi, Energy Environ. Sci., 2011, 4, 1113–1132 CAS.
- L. Chen, Y. Zhang and C. Lin, J. Mater. Chem. A, 2014, 25, 9684–9690 Search PubMed.
- S. Han, D. Jung and J. Jeong, Chem. Eng. J., 2014, 254, 597–604 CrossRef CAS.
- Y. J. Hwang, S. K. Jeong, J. S. Shin and K. S. Nahm, J. Alloys Compd., 2008, 448, 141–147 CrossRef CAS.
- X. L. Wu, L. L. Chen and S. Xin, ChemSusChem, 2010, 3, 703–707 CrossRef CAS PubMed.
- R. C. Lee, Y. P. Lin and Y. T. Weng, J. Power Sources, 2014, 253, 373–380 CrossRef CAS.
- P. Adelhelm, Y. S. Hu and B. M. Smarsly, Adv. Mater., 2007, 19, 4012–4017 CrossRef CAS.
- F. Han, W. C. Li and D. Li, J. Energy Chem., 2013, 22, 329–335 CrossRef CAS.
- H. L. Lv, S. Qiu and G. X. Lu, Electrochim. Acta, 2015, 151, 214–221 CrossRef CAS.
- Z. X. Wu and D. Y. Zhao, Chem. Commun., 2011, 47, 3332–3338 RSC.
- Z. X. Wu, W. Li, Y. Y. Xia and P. Webley, J. Mater. Chem., 2012, 22, 8835–8845 RSC.
- G. T. Fey, Y. Cho, C. Chen and T. P. Kumar, Pure Appl. Chem., 2010, 82, 2157–2165 CrossRef CAS.
- G. T. Fey and C. Chen, J. Power Sources, 2001, 97–98, 47–51 CrossRef CAS.
- G. Q. Wang, D. L. Wang and S. Kuang, Renewable Energy, 2014, 63, 708–714 CrossRef CAS.
- L. P. Wang, Z. Schnepp and M. M. Titirici, J. Mater. Chem. A, 2013, 17, 5269–5273 Search PubMed.
- N. Liu, K. F. Huo and M. T. McDowell, Sci. Rep., 2013, 3, 24–29 Search PubMed.
- H. Basta, V. Fierro and H. El-Saied, Bioresour. Technol., 2009, 100, 3941–3947 CrossRef PubMed.
- M. Stephan, T. P. Kumar and R. Ramesh, Mater. Sci. Eng., A, 2006, 430, 132–137 CrossRef.
- K. T. Lee, J. C. Lytle and N. S. Ergang, Adv. Funct. Mater., 2005, 15, 547–556 CrossRef CAS.
- J. Liu, Y. Wen, Y. Wang and P. A. Aken, Adv. Mater., 2014, 26, 6025–6030 CrossRef CAS PubMed.
- G. T. K. Fey, D. C. Lee and Y. Y. Lin, Synth. Met., 2003, 139, 71–80 CrossRef CAS.
- B. Xu, L. Shi and X. Guo, Electrochim. Acta, 2011, 56, 6464–6468 CrossRef CAS.
- F. D. Han, Y. J. Bai and R. Liu, Adv. Energy Mater., 2011, 1, 798–801 CrossRef CAS.
- L. Qie, W. M. Chen and Z. H. Wang, Adv. Mater., 2012, 24, 2047–2050 CrossRef PubMed.
- L. Wang, J. Xue and B. Gao, RSC Adv., 2014, 4, 64744–64746 RSC.
| This journal is © The Royal Society of Chemistry and the Centre National de la Recherche Scientifique 2016 |

