The effect of magnetic coupling on magneto-caloric behaviour in two 3D Gd(III)–glycolate coordination polymers†
Jiang-Zhen
Qiu
a,
Yan-Cong
Chen
a,
Long-Fei
Wang
a,
Quan-wen
Li
a,
Martin
Orendáč
b and
Ming-Liang
Tong
*a
aKey Laboratory of Bioinorganic and Synthetic Chemistry of Ministry of Education, School of Chemistry & Chemical Engineering, Sun Yat-Sen University, Guangzhou, 510275 P. R. China. E-mail: tongml@mail.sysu.edu.cn; Fax: (+)86 20 8411-2245
bCentre of Low Temperature Physics Faculty of Science Laboratory, Institute of Experimental Physics SAS, P. J. Šafárik University, Park Angelinum 9, 04013 Košice, Slovakia. E-mail: martin.orendac@upjs.sk
First published on 17th November 2015
Abstract
Two different 3D coordination polymers, [Gd(glc)(Hglc)(H2O)]n·nH2O (1) and [Gd(Hglc)3]n (2) (H2glc = glycolic acid), have been prepared based on the reaction of Gd(III) ions with H2glc in different pH environments. Due to the deprotonation of the α-OH groups from half of the H2glc ligands in 1, [Gd2] units with a Gd–O–Gd bridging model are observed and suggest a stronger magnetic coupling than that in 2. Magnetic and heat capacity studies reveal the significant impact of the strength of magnetic coupling on the magneto-caloric effect (MCE) in systems. Although a theoretical calculation suggests the −ΔSm (50.5 J kg−1 K−1) of 1 is larger than 2 (45.2 J kg−1 K−1), the stronger antiferromagnetic coupling in 1 decreases the number of low-lying excited spin states upon the lowering of temperature, thus giving a smaller value of −ΔSm than 2 at various fields (e.g. −ΔSm,max = 24.8 J kg−1 K−1 and 41.1 J kg−1 K−1 for 1 and 2 respectively at ΔH = 3 T). This case reveals that the effect of magnetic coupling on MCE plays a dominant role for designing low-temperature 3D Gd(III)-based magnetic coolants.
Introduction
The magnetocaloric effect (MCE), which was first observed in metallic iron in 1881 by Warburg, is dependent on the change of magnetic entropy upon application of a varying magnetic field.1 This interesting phenomenon can be used in cooling applications via adiabatic demagnetization. In recent years, molecular magnetic refrigerators working at the low temperature region with a large MCE have attracted intense interest from researchers due to their obvious merits, e.g. energy-efficiency, economy, environmentally friendly nature, synthetic controllability and functional tunability, in contrast to traditional refrigerators.2 Theoretically, the magnetic coolants will possess a large entropy change (−ΔSm) when meeting certain conditions: (1) a large spin ground state S due to the magnetic entropy amount R![[thin space (1/6-em)]](https://www.rsc.org/images/entities/char_2009.gif) ln(2S + 1);3 (2) a small magnetic anisotropy can hinder the polarization of net molecular spins along the easy axis;4 (3) a high magnetic density (or a large metal/ligand mass ratio), since the diamagnetic ligands have negative impact on MCE;5 (4) a weak magnetic coupling in the magnetic coolant will result in a lower working temperature and a maximum of −ΔSm close to its paramagnetic limit.6
ln(2S + 1);3 (2) a small magnetic anisotropy can hinder the polarization of net molecular spins along the easy axis;4 (3) a high magnetic density (or a large metal/ligand mass ratio), since the diamagnetic ligands have negative impact on MCE;5 (4) a weak magnetic coupling in the magnetic coolant will result in a lower working temperature and a maximum of −ΔSm close to its paramagnetic limit.6
Therefore, the combination of light ligands and Gd(III), which has a large spin value (S = 7/2) and is isotropic, has been proven to be one of the effective strategies for obtaining magnetic coolers with a large MCE. To date, a large number of Gd(III) based molecular clusters and coordination polymers with impressive MCE have been reported.5,7–9 Among them, the construction of high-dimensional Gd(III) based polymers, such as [Gd(HCOO)(OAc)2(H2O)2]n,9a [Gd(HCOO)3]n,9b [Gd(OH)CO3]n,9c and [GdF3]n,8f is beneficial to obtain materials with promising MCE, when considering the enhanced magnetic density due to the sharing of bridging ligands between magnetic centers and that the nonmagnetic guest or solvent molecules are more difficult to trap in such structures.
On the other hand, with increasing magnetic density in systems, the distance between the Gd(III) ions will be shorter, which may result in stronger magnetic coupling. Although the magnetic coupling between Gd(III) ions is weak due to the shielding effect of 5s and 5p orbitals, the strengthening of magnetic coupling, which may result in a higher ordering temperature,10 is unfavorable for magnetic coolers working at lower temperature, especially in the ultra-low temperature region (i.e., sub-millikelvin).
Herein, we report a family of 3D coordination polymers, [Gd(glc)(Hglc)(H2O)]n·nH2O (1) and [Gd(Hglc)3]n (2) (H2glc = glycolic acid). The structural analysis indicates the α-OH groups of half of the H2glc ligands in 1 are deprotonated, giving di-deprotonated glc2− anions, while only mono-deprotonated Hglc− anions, as a result of deprotonation of the carboxyl groups of H2glc, are observed in 2. Although antiferromagnetic (AF) couplings are found in both complexes, the different degree of deprotonation of H2glc leads to different strengths of magnetic couplings in 1 and 2. For 1, each deprotonated hydroxyl oxygen atom bridges two Gd(III) ions into a [Gd2] unit, leading to a stronger intra-dinuclear AF coupling than 2, in which the Gd(III) ions are more separated with a Gd–OCO–Gd connecting model (Scheme 1), thus giving a very weak AF magnetic coupling. As confirmed by the MCE measurements, although the theoretical maximum −ΔSm of 1 (50.5 J kg−1 K−1) is larger than 2 (45.2 J kg−1 K−1), the relatively strong AF coupling in 1 decreases the number of low-lying excited spin states, resulting in a weaker MCE (−ΔSm, max = 40.7 J kg−1 K−1, ΔTad, max = 16 K at ΔH = 7 T) than 2 (−ΔSm,max = 43.7 J kg−1 K−1, ΔTad,max = 24.5 K at ΔH = 7 T). Additionally, at a lower temperature down to 0.5 K at ΔH = 7 T, the −ΔSm of 2 still maintains a considerable value of 39.5 J kg−1 K−1, which is obviously higher than that of 1 (−ΔSm,max = 17.1 J kg−1 K−1), confirming that the weak magnetic coupling in 2 makes it a promising magnetic refrigerator working at low temperature.
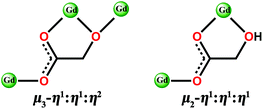 | ||
| Scheme 1 The bridging model of di-deprotonated glc2− (left) and mono-deprotonated Hglc− ligand (right) with Gd(III) ions. | ||
Experimental
Synthesis
All chemicals were obtained from commercial sources and used as received without further purification.![[thin space (1/6-em)]](https://www.rsc.org/images/entities/char_2009.gif) :
:![[thin space (1/6-em)]](https://www.rsc.org/images/entities/char_2009.gif) v = 1
v = 1![[thin space (1/6-em)]](https://www.rsc.org/images/entities/char_2009.gif) :
:![[thin space (1/6-em)]](https://www.rsc.org/images/entities/char_2009.gif) 1) followed by the addition of [(CH3)4N]OH·5H2O (0.009 g, 0.05 mmol). The resulting solution was sealed in a Teflon-lined, stainless steel vessel (23 mL) and heated at 120 °C for 3 days, and then cooled to room temperature at a rate of 5 °C h−1. Colorless block crystals (yield: 81%) were obtained. Elemental analysis (%) calc for C4H9GdO8: C 14.03, H 2.65; found: C 13.90, H 2.68. Infrared (KBr disc, cm−1): 3599 (m), 3448 (m), 3276 (m), 3140 (m), 2889 (m), 2827 (m), 2640 (m), 2440 (w), 2214 (w), 2106 (w), 1599 (s), 1545 (s), 1410 (s), 1227 (w), 1105 (s), 1057 (s), 1005 (w), 937 (m), 716 (m), 575 (m), 530 (m), 467 (m), 277 (m).
1) followed by the addition of [(CH3)4N]OH·5H2O (0.009 g, 0.05 mmol). The resulting solution was sealed in a Teflon-lined, stainless steel vessel (23 mL) and heated at 120 °C for 3 days, and then cooled to room temperature at a rate of 5 °C h−1. Colorless block crystals (yield: 81%) were obtained. Elemental analysis (%) calc for C4H9GdO8: C 14.03, H 2.65; found: C 13.90, H 2.68. Infrared (KBr disc, cm−1): 3599 (m), 3448 (m), 3276 (m), 3140 (m), 2889 (m), 2827 (m), 2640 (m), 2440 (w), 2214 (w), 2106 (w), 1599 (s), 1545 (s), 1410 (s), 1227 (w), 1105 (s), 1057 (s), 1005 (w), 937 (m), 716 (m), 575 (m), 530 (m), 467 (m), 277 (m).
![[thin space (1/6-em)]](https://www.rsc.org/images/entities/char_2009.gif) :
:![[thin space (1/6-em)]](https://www.rsc.org/images/entities/char_2009.gif) v = 1
v = 1![[thin space (1/6-em)]](https://www.rsc.org/images/entities/char_2009.gif) :
:![[thin space (1/6-em)]](https://www.rsc.org/images/entities/char_2009.gif) 1) was sealed in a Teflon-lined, stainless steel vessel (23 mL) and heated at 120 °C for 3 days, and then cooled to room temperature at a rate of 5 °C h−1. Colorless block crystals (yield: 60%) were obtained. Elemental analysis (%) calcd for C6H9GdO9: C, 18.84, H 2.37; found: C 18.61, H 2.49. Infrared (KBr disc, cm−1): 3395 (br), 2948 (m), 2813 (w), 2659 (w), 1590 (vs), 1475(w), 1448 (w), 1403 (m), 1385 (s), 1333 (s), 1332 (w), 1080 (s), 1064 (s), 998 (w), 940 (m), 817 (w), 707 (m), 575 (w), 540 (m).
1) was sealed in a Teflon-lined, stainless steel vessel (23 mL) and heated at 120 °C for 3 days, and then cooled to room temperature at a rate of 5 °C h−1. Colorless block crystals (yield: 60%) were obtained. Elemental analysis (%) calcd for C6H9GdO9: C, 18.84, H 2.37; found: C 18.61, H 2.49. Infrared (KBr disc, cm−1): 3395 (br), 2948 (m), 2813 (w), 2659 (w), 1590 (vs), 1475(w), 1448 (w), 1403 (m), 1385 (s), 1333 (s), 1332 (w), 1080 (s), 1064 (s), 998 (w), 940 (m), 817 (w), 707 (m), 575 (w), 540 (m).
General characterization
Elemental analyses were performed on an Elementar Vario EL elemental analyzer. Powder X-ray diffraction measurements (Fig. S1, ESI†) were performed with a Bruker D8 X-Ray Diffractometer. The FTIR spectra were measured on a Thermo NICOLET AVATAR 330 FTIR spectrometer.Crystal data
Crystal diffraction data were recorded at 150(2) K on a Rigaku R-AXIS SPIDER Image Plate Diffractometer with MoKα radiation. The structures were solved by direct methods and all nonhydrogen atoms were refined anisotropically by least squares on F2 using the SHELXTL program.11For 1: C4H9GdO8, Mr = 342.36, monoclinic, space group P21/c, a = 6.2789(3) Å, b = 9.0295(6) Å, c = 14.8336(9) Å, α = 90°, β = 92.585(2)°, γ = 90°, V = 840.14(9) Å3, Z = 2, ρ = 2.707 g cm−3; R1 = 0.0292 (I > 2σ(I)), wR2 = 0.0729 (all data). Final GooF = 1.035.
For 2: C6H9GdO9, Mr = 382.38, monoclinic, space group P21, a = 8.1242(11) Å, b = 8.0394(13) Å, c = 8.4324(12) Å, α = 90°, β = 117.490(4)°, γ = 90°, V = 488.57(13) Å3, Z = 2, ρ = 2.599 g cm−3; R1 = 0.0423 (I > 2σ(I)), wR2 = 0.1001 (all data). Final GooF = 1.099.
CCDC 1426346 (1) and 1426347 (2) contain the supplementary crystallographic data for this paper.
Magnetic measurements
The magnetic measurements were performed by using a Quantum Design MPMS XL-7 SQUID magnetometer and a Quantum Design PPMS on polycrystalline samples with an empirical diamagnetic correction. The specific heat was studied in a Quantum Design PPMS with the 3He option adopting the standard relaxation technique.Results and discussion
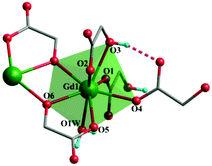
Both complexes are synthesized through a hydrothermal process between Gd3+ and H2glc in H2O/MeOH solution. The presence of tetramethylammonium hydroxide is essential for separating complexes 1 and 2, for which the α-OH group of H2glc could be deprotonated in an alkaline environment, thus giving the di-deprotonated glc2− ligand. Besides, the acetylacetonate (acac) may serve as an auxiliary ligand to prevent the hydrolysis of Gd3+ ions into other compounds.7aSingle-crystal X-ray diffraction analysis reveals complex 1 crystallizes in the monoclinic P21/c space group with one full formula unit in the asymmetric unit cell. In the crystal structure, each Gd(III) center is coordinated by eight oxygen atoms from two mono-deprotonated Hglc− ligands, three di-deprotonated glc2− ligands and one water molecule, resulting in a triangular dodecahedron geometry (Fig. 1) with a CShM value of 0.79 calculated by SHAPE 2.1.12 The Gd–O bond lengths range from 2.283(3) to 2.521(3) Å.
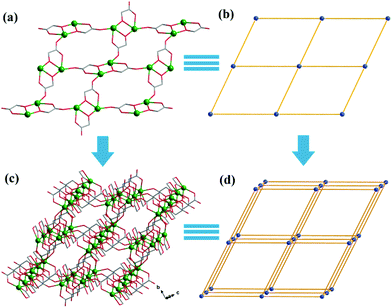
Both Hglc− and glc2− ligands are observed in the structure of 1 and employ μ3-η1:η1:η2 and μ2-η1:η1:η1 bridging modes respectively between the Gd(III) ions (Scheme 1). Upon the bridging of the hydroxyl μ2-oxygen atoms from glc2− ligands between two Gd(III) ions, [Gd2] dinuclear units are formed and connected with each other through four glc2− ligands, extending to a 4-connected 2D layer on the bc plane of unit cell (Fig. 2a and b). The Gd(III) ions in a dinuclear unit are separated by 3.7880(3) Å and the Gd–O–Gd angle is 110.37(11)°. Additionally, the [Gd2] dinuclear units in the 2D layers are bridged by Hglc− ligands along a axis of the unit cell, forming a 3D structure with a typical pcu topology (Fig. 2c and d).
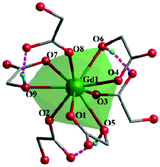
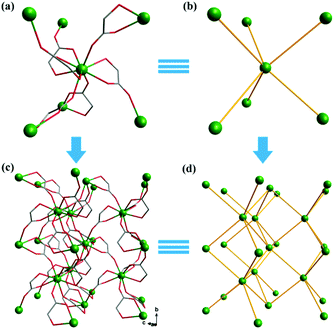
Complex 2, which is synthesized in the absence of tetramethylammonium hydroxide, crystallizes in the monoclinic space group P21. The asymmetric unit of 2 contains one Gd(III) ion and three mono-deprotonated Hglc− ligands. In contrast with 1, only mono-deprotonated Hglc− ligands are observed in 2, indicating the degree of deprotonation of H2glc is pH-dependent and thus making the “fine-tuning” of the coordinating structure possible. In 2, each Hglc− ligand not only chelates a Gd(III) ion with the carboxyl and hydroxyl groups, but also extends into a μ-bridging mode by an syn–anti carboxyl bridge (Gd–OCO–Gd, 6.3784(11) Å). As far as Gd(III) is concerned, each Gd(III) ion is coordinated with nine oxygen atoms from six Hglc− ligands, giving a spherical capped square antiprism geometry with a CShM value of 0.59. More precisely, three of the ligands chelate the Gd(III) center with two oxygen atoms from a hydroxyl and carboxylic group respectively, whereas the other three ligands are coordinated in the opposite direction through one carboxyl oxygen atom (Fig. 3). Topologically, the Gd(III) ions can be simplified as 6-connected nodes (Fig. 4a and b) and the ligands as linkers, which gives rise to a 3D acs topology (Fig. 4c and d).13
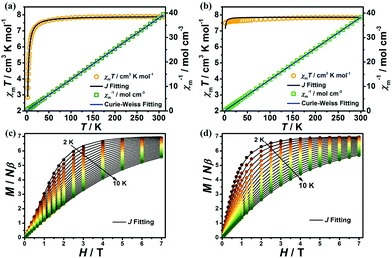
The variable-temperature magnetic susceptibilities of 1 and 2 were collected from 1.8 to 300 K and 2 to 300 K for 1 and 2 respectively in an applied direct-current (dc) field of 0.1 T. At room temperature, the χmT values for complexes 1 and 2 are 7.87 cm3 K mol−1 and 7.84 cm3 K mol−1, respectively, which are both in good agreement with the spin-only value expected for a free Gd(III) ion with g = 2 (7.875 cm3 K mol−1). However, as the temperature decreases, both complexes exhibit different magnetic behaviours. For 1, the χmT value remains essentially constant upon lowering of the temperature to about 30 K, after which it decreases sharply to a minimum value of 2.85 cm3 K mol−1 at 1.8 K (Fig. 5a), indicating AF coupling in 1, which is in agreement with the Curie–Weiss fitting for 1 (C = 7.94 cm3 mol−1 K and θ = −2.07 K). The χmT value for 2 is essentially constant, between 7.51 and 7.84 cm3 K mol−1, with very weak interactions as indicated by the Curie–Weiss fit (C = 7.85 cm3 K mol−1, θ = −0.6 K in the range 1.8–300 K, Fig. 5b). To further understand the magneto-structural correlations of both complexes,14,15 the fitting of the variable-temperature magnetic susceptibilities and magnetization of 1 and 2 was performed using PHI software.16 For 1, the dominant antiferromagnetic interaction is inside the [Gd2] dinuclear unit with J = −0.103 cm−1, accompanied by a negligible zJ < 0.001 cm−1. For 2, the antiferromagnetic interaction can be easily rationalized by an intermetallic zJ = −0.005 cm−1 (Fig. 5). It is obvious that the AF interactions in 1 are stronger than in 2, such observation is mainly attributed to the single-oxygen bridged Gd(III)⋯Gd(III) coupling in the [Gd2] unit of 1, in which the Gd(III)⋯Gd(III) distance (3.7880(3) Å for 1) is obviously shorter than in 2 (6.3036(6) Å), resulting in stronger AF coupling in 1.17
Magnetization measurements were performed at T = 2–10 K for 1 and 2, in the field range of 0.01–7 T (Fig. 5c and d). The magnetization increased steadily with the external field and reached saturation values of 6.90 and 7.02Nβ for 1 and 2 respectively at 1.8 K and 7 T, which are in good agreement with the theoretical value of 7Nβ for a Gd(III) ion (S = 7/2, g = 2).
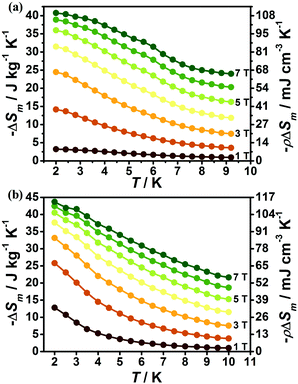
According to experimental magnetization data, the magnetic entropy changes (−ΔSm) for 1 and 2 can be calculated by applying the Maxwell equation.18
The magnetic field dependent magnetic entropy change (−ΔSm) of each complex at various temperatures is shown in Fig. 6. It is obviously observed that the −ΔSm values of 1 and 2 gradually increase with the lowering of the temperature and increase of the applied field. For 1, the −ΔSm value reaches a maximum value of 40.7 J kg−1 K−1 with ΔH = 7 T at 2 K (Fig. 6a), which is far smaller than its theoretical limiting value of 50.5 J kg−1 K−1 calculated from R![[thin space (1/6-em)]](https://www.rsc.org/images/entities/char_2009.gif) ln(2SGd + 1) with SGd = 7/2. For 2, due to the relatively smaller metal/ligand ratios of 2 in contrast to 1, the calculated theoretical maximum −ΔSm with the value 45.2 J kg−1 K−1 is smaller than that of 1, however, the experimental result indicates the MCE effect for 2 is more promising than for 1, as confirmed by the larger −ΔSm with an experimental value of 43.7 J kg−1 K−1 at T = 2 K and ΔH = 7 T (Fig. 6b). Such observation mainly originates from the different strength of magnetic coupling in these two systems as confirmed by their different magnetic coupling parameters (J). As a result, the obvious antiferromagnetic coupling in 1 can decrease the number of low-lying excited spin states upon the lowering of temperature, leading to a decrease of magnetic entropy changes while the magnetic coupling in 2 is much weaker, which makes the Gd(III) ions keep mainly paramagnetic states at lower temperature and gives a large MCE close to its paramagnetic limits. The volumetric −ΔSm values for 1 and 2 are 107.7 and 113.6 mJ cm−3 K−1 respectively. Both 1 and 2 display considerable MCE in comparison with some reported 4f magnetic coolants as shown in Table 1.
ln(2SGd + 1) with SGd = 7/2. For 2, due to the relatively smaller metal/ligand ratios of 2 in contrast to 1, the calculated theoretical maximum −ΔSm with the value 45.2 J kg−1 K−1 is smaller than that of 1, however, the experimental result indicates the MCE effect for 2 is more promising than for 1, as confirmed by the larger −ΔSm with an experimental value of 43.7 J kg−1 K−1 at T = 2 K and ΔH = 7 T (Fig. 6b). Such observation mainly originates from the different strength of magnetic coupling in these two systems as confirmed by their different magnetic coupling parameters (J). As a result, the obvious antiferromagnetic coupling in 1 can decrease the number of low-lying excited spin states upon the lowering of temperature, leading to a decrease of magnetic entropy changes while the magnetic coupling in 2 is much weaker, which makes the Gd(III) ions keep mainly paramagnetic states at lower temperature and gives a large MCE close to its paramagnetic limits. The volumetric −ΔSm values for 1 and 2 are 107.7 and 113.6 mJ cm−3 K−1 respectively. Both 1 and 2 display considerable MCE in comparison with some reported 4f magnetic coolants as shown in Table 1.
| Complex | ΔH (T) | −ΔSm,max | |
|---|---|---|---|
| J kg−1 K−1 | mJ cm−3 K−1 | ||
| 1 (this work) | 7 | 40.7 | 110 |
| 2 (this work) | 7 | 43.7 | 114 |
| [{Gd(OAc)3(H2O)2}2]·4H2O8a | 7 | 40.6 | 82.8 |
[Gd(HCOO)(OAc)2(H2O)2]n![[thin space (1/6-em)]](https://www.rsc.org/images/entities/char_2009.gif) 9a 9a |
7 | 45.9 | 110 |
[Gd2(N-BDC)3(dmf)4]n![[thin space (1/6-em)]](https://www.rsc.org/images/entities/char_2009.gif) 9a 9a |
7 | 29.0 | 41.2 |
[Gd(HCOO)(bdc)]n![[thin space (1/6-em)]](https://www.rsc.org/images/entities/char_2009.gif) 8b 8b |
9 | 47.0 | 125 |
| [Gd2(OH)2(suc)2(H2O)]n·2nH2O7a | 7 | 42.8 | 120 |
| [Gd6(OH)8(suc)5(H2O)2]n·4nH2O7a | 7 | 48.0 | 144 |
[Gd(HCOO)3]n![[thin space (1/6-em)]](https://www.rsc.org/images/entities/char_2009.gif) 9b 9b |
7 | 55.9 | 215.7 |
{[Gd6O(OH)8(ClO4)4(H2O)6](OH)4}n![[thin space (1/6-em)]](https://www.rsc.org/images/entities/char_2009.gif) 8c 8c |
7 | 46.6 | 215.6 |
| [Gd(C2O4)(H2O)3Cl]5b | 7 | 48.0 | 144 |
[Gd4(SO4)4(μ3-OH)4(H2O)]![[thin space (1/6-em)]](https://www.rsc.org/images/entities/char_2009.gif) n8d n8d |
7 | 51.3 | 198.9 |
Gd(OH)3![[thin space (1/6-em)]](https://www.rsc.org/images/entities/char_2009.gif) 8e 8e |
7 | 62.0 | 346 |
[Gd(OH)CO3]n![[thin space (1/6-em)]](https://www.rsc.org/images/entities/char_2009.gif) 9c 9c |
7 | 66.4 | 355 |
GdF3![[thin space (1/6-em)]](https://www.rsc.org/images/entities/char_2009.gif) 8f 8f |
7 | 71.6 | 506 |
Heat capacity
To further investigate the MCE of 1 and 2, low-temperature heat capacity (C) measurements were performed at applied fields of 0, 3, 5 and 7 T down to approximately 0.5 K. As shown in Fig. 7, the higher temperature regions for the two complexes are dominated by lattice contributions arising from the thermal vibration, which fits well with Debye's model and yields Debye temperatures (θD) of 272 and 460 K for 1 and 2 respectively. At lower temperatures, the heat capacities for the two complexes are dominated by the field-sensitive Schottky-type magnetic contributions. The observed increase of C upon cooling is attributed to the calculated Schottky anomaly, however, no obvious λ peaks are found in the measured temperature range at zero field, indicating the absence of magnetic ordering for both complexes above 0.5 K.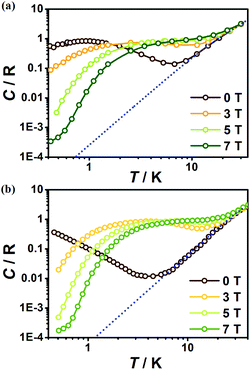 | ||
| Fig. 7 Temperature dependent heat capacities (C) for 1 (a) and 2 (b) under various fields. The dotted blue lines represent the estimated lattice contribution. | ||
From the experimental C, the temperature dependent entropies (S) for 1 and 2 are obtained by numerical integration using  . Additionally, a compensation to the zero-field entropy has to be added for each complex based on the saturation value of magnetic entropy (Sm,sat = R
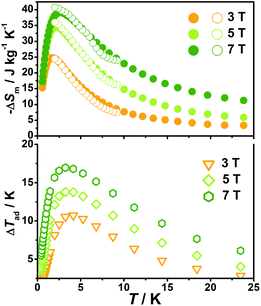
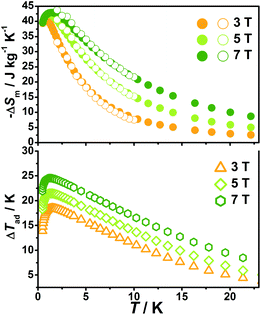
![[thin space (1/6-em)]](https://www.rsc.org/images/entities/char_2009.gif) ln(2S + 1) = 2.08R) (Fig. S2, ESI†). Therefore, the isothermal magnetic entropy change (−ΔSm) and the adiabatic temperature change (ΔTad) for each complex (Fig. 8 and 9) can be extracted from the temperature and field dependencies of the relative Stotal(T0,H) data by vertical and horizontal subtraction, respectively.
ln(2S + 1) = 2.08R) (Fig. S2, ESI†). Therefore, the isothermal magnetic entropy change (−ΔSm) and the adiabatic temperature change (ΔTad) for each complex (Fig. 8 and 9) can be extracted from the temperature and field dependencies of the relative Stotal(T0,H) data by vertical and horizontal subtraction, respectively.
With the information available in the lower-temperature region, one can easily recognize the peaks of the −ΔSm–T curves and the expected shift to higher temperature with an increasing field. The ΔSm of each complex shows good agreement from both independent evaluations, that is, heat capacity and magnetization respectively, confirming the consistency of the two measurements of magnetic entropy change. Due to the weaker magnetic coupling in 2, the observed peaks of −ΔSm for 2 (Fig. 7) are obviously located at lower temperature regions than 1 (Fig. 8). At ΔH = 7 T, the corresponding maximum of −ΔSm for 2 is observed at 1.4 K, obviously lower than that of 1 (2.6 K). Additionally, it is noted the maximum of −ΔSm for 2 at a mild field of ΔH = 3 T gives a considerable value of 41.1 J kg−1 K−1 at 0.78 K, which is also close to its maximum of 43.7 J kg−1 K−1 at 7 T, indicating the energy efficiency and practical applicability of 2. What's more important, on lowering the temperature to 0.5 K, which is the lowest measured temperature, complex 2 still maintains a high −ΔSm of 39.5 J kg−1 K−1 while the −ΔSm of 1 sharply decreases to 17.1 J kg−1 K−1, such observation indicates that the weak magnetic coupling avoids the magnetic ordering of 2 at low temperature, thus making it a potential candidate for ultra-low temperature application.
When considering the other parameter, ΔTad, complex 2 with a maximum of 24.5 K for ΔH = 7 T is also obviously superior to 1 (ΔTad = 16.9 K at T = 3.2 K and ΔH = 7). Such larger ΔTad of 2 in contrast to 1 is attributed to not only its higher −ΔSm value, but also the higher Debye temperature of 2, which leads to less lattice contribution of the heat capacity at the corresponding temperature, and therefore a relatively greater temperature variation (ΔTad) can be obtained.
Conclusions
In summary, through controlling the pH environment in the hydrothermal reaction of H2glc ligands and Gd(III) ions, we successfully obtain two Gd(III)-based polymers, 1 and 2. In the structure of 1, due to the deprotonation of the α-OH group of H2glc, each hydroxyl oxygen atom bridges two Gd(III) ions in the μ2 model (Gd–O–Gd, 110.37(11)°), resulting in a dinuclear [Gd2], thus giving a stronger magnetic coupling than 2 in which the Gd(III) ions are more separated at 6.3784(11) Å through the Gd–COC–Gd bridging model. A theoretical calculation suggested a higher −ΔSm value of 1 than 2, however, the following MCE measurement indicates both the maxima of −ΔSm and ΔTad of 2 at ΔH = 7 T (−ΔSm,max = 43.7 J kg−1 K−1, ΔTad,max = 24.5 K) are larger than 1 (−ΔSm, max = 39.8 J kg−1 K−1, ΔTad, max = 16 K). Additionally, the weak magnetic coupling in 2 makes it maintain a considerable value of −ΔSm,max at moderate field (−ΔSm,max = 41.1 J kg−1 K−1 at ΔH = 3 T) and has a lower working temperature region. This observation indicates the importance of controlling not only the large metal/ligand ratio but also weak magnetic interactions for successful design of molecular refrigerants.Acknowledgements
This work was supported by the “973 Project” (2012CB821704 and 2014CB845602), project NSFC (Grant no. 91122032, 21371183, 21121061 and 21201137), the NSF of Guangdong (S2013020013002), Program for Changjiang Scholars and Innovative Research Team in University of China (IRT1298).Notes and references
- (a) E. Warburg, Ann. Phys., 1881, 249, 141 CrossRef; (b) P. Debye, Ann. Phys., 1926, 386, 1154 CrossRef; (c) W. F. Giauque, J. Am. Chem. Soc., 1927, 49, 1864 CrossRef CAS; (d) W. F. Giauque and D. P. MacDougall, J. Am. Chem. Soc., 1935, 57, 1175 CrossRef CAS.
- (a) M. Evangelisti and E. K. Brechin, Dalton Trans., 2010, 39, 4672 RSC; (b) M. Evangelisti, F. Luis, L. J. de Jongh and M. Affronte, J. Mater. Chem., 2006, 16, 2534 RSC; (c) Y.-Z. Zheng, G.-J. Zhou, Z.-P. Zheng and R. E. P. Winpenny, Chem. Soc. Rev., 2014, 43, 1462 RSC; (d) J.-L. Liu, Y.-C. Chen, F.-S. Guo and M.-L. Tong, Coord. Chem. Rev., 2014, 281, 26 CrossRef CAS.
- R. L. Carlin, Magnetochemistry, Springer-Verlag, Germany, 1986 Search PubMed.
- (a) F. Torres, J. M. Hernández, X. Bohigas and J. Tejada, Appl. Phys. Lett., 2000, 77, 3248 CrossRef CAS; (b) X.-X. Zhang, H.-L. Wei, Z.-Q. Zhang and L. Zhang, Phys. Rev. Lett., 2001, 87, 157203 CrossRef CAS PubMed.
- (a) F.-S. Guo, J.-D. Leng, J.-L. Liu, Z.-S. Meng and M.-L. Tong, Inorg. Chem., 2012, 51, 405 CrossRef CAS PubMed; (b) Y. Meng, Y.-C. Chen, Z.-M. Zhang, Z.-J. Lin and M.-L. Tong, Inorg. Chem., 2014, 53, 9052 CrossRef CAS PubMed.
- Y.-C. Chen, F.-S. Guo, J.-L. Liu, J.-D. Leng, P. Vrábel, M. Orendáč, J. Prokleška, V. Sechovský and M.-L. Tong, Chem. – Eur. J., 2014, 20, 3029 CrossRef CAS PubMed.
- (a) Y.-C. Chen, F.-S. Guo, Y.-Z. Zheng, J.-L. Liu, J.-D. Leng, R. Tarasenko, M. Orendáč, J. Prokleška, V. Sechovský and M.-L. Tong, Chem. – Eur. J., 2013, 19, 13504 CrossRef CAS PubMed; (b) L.-X. Chang, G. Xiong, L. Wang, P. Cheng and B. Zhao, Chem. Commun., 2013, 49, 1055 RSC; (c) F.-S. Guo, Y.-C. Chen, L.-L. Mao, W.-Q. Lin, J.-D. Leng, R. Tarasenko, M. Orendáč, J. Prokleška, V. Sechovský and M.-L. Tong, Chem. – Eur. J., 2013, 19, 14876 CrossRef CAS PubMed; (d) M. Wu, F. Jiang, X. Kong, D. Yuan, L. Long, S. A. Al-Thabaiti and M. Hong, Chem. Sci., 2013, 4, 3104 RSC; (e) J. W. Sharples, Y.-Z. Zheng, F. Tuna, E. J. L. McInnes and D. Collison, Chem. Commun., 2011, 47, 7650 RSC; (f) R. J. Blagg, F. Tuna, E. J. L. McInnes and R. E. P. Winpenny, Chem. Commun., 2011, 47, 10587 RSC; (g) F.-S. Guo, Y.-C. Chen, J.-L. Liu, J.-D. Leng, Z.-S. Meng, P. Vrábel, M. Orendáč and M.-L. Tong, Chem. Commun., 2012, 48, 12219 RSC; (h) J.-Z. Qiu, L.-F. Wang, Y.-C. Chen, Z.-M. Zhang, Q.-W. Li and M.-L. Tong, Chem. – Eur. J., 2015, 21 DOI:10.1002/chem.201503796.
- (a) M. Evangelisti, O. Roubeau, E. Palacios, A. Camín, T. N. Hooper, E. K. Brechin and J. J. Alonso, Angew. Chem., Int. Ed., 2011, 50, 6606 CrossRef CAS PubMed; (b) R. Sibille, T. Mazet, B. Malaman and M. François, Chem. – Eur. J., 2012, 18, 12970 CrossRef CAS PubMed; (c) Y.-L. Hou, G. Xiong, P.-F. Shi, R.-R. Cheng, J.-Z. Cui and B. Zhao, Chem. Commun., 2013, 49, 6066 RSC; (d) S.-D. Han, S.-H. Miao, S.-J. Liu and X.-H. Bu, Inorg. Chem. Front., 2014, 1, 549 RSC; (e) Y. Yang, Q.-C. Zhang, Y.-Y. Pan, L.-S. Long and L.-S. Zheng, Chem. Commun., 2015, 51, 7317 RSC; (f) Y.-C. Chen, J. Prokleška, W.-J. Xu, J.-L. Liu, J. Liu, W.-X. Zhang, J.-H. Jia, V. Sechovský and M.-L. Tong, J. Mater. Chem. C, 2015, 2, 12206–12211 RSC.
- (a) G. Lorusso, M. A. Palacios, G. S. Nichol, E. K. Brechin, O. Roubeau and M. Evangelisti, Chem. Commun., 2012, 48, 7592 RSC; (b) G. Lorusso, J. W. Sharples, E. Palacios, O. Roubeau, E. K. Brechin, R. Sessoli, A. Rossin, F. Tuna, E. J. L. McInnes, D. Collison and M. Evangelisti, Adv. Mater., 2013, 25, 4653 CrossRef CAS PubMed; (c) Y.-C. Chen, Z.-S. Meng, L. Qin, Y.-Z. Zheng, J.-L. Liu, F.-S. Guo, R. Tarasenko, M. Orendáč, J. Prokleška, V. Sechovský and M.-L. Tong, J. Mater. Chem. A, 2014, 2, 9851 RSC; (d) L. Sedláková, J. Hanko, A. Orendáčová, M. Orendáč, C.-L. Zhou, W.-H. Zhu, B.-W. Wang, Z. M. Wang and S. Gao, J. Alloys Compd., 2009, 425 CrossRef; (e) G. Lorusso, M. A. Palacios, G. S. Nichol, E. K. Brechin, O. Roubeau and M. Evangelisti, Chem. Commun., 2012, 48, 7592 RSC; (f) P. F. Shi, Y. Z. Zheng, X. Q. Zhao, G. Xiong, B. Zhao, F. F. Wam and P. Cheng, Chem. – Eur. J., 2012, 18, 15086 CrossRef CAS PubMed; (g) S. Biswas, A. Adhikary, S. Goswami and S. Konar, Dalton Trans., 2013, 42, 13331 RSC; (h) S.-J. Liu, J.-P. Zhao, J. Tao, J.-M. Jia, S.-D. Han, Y. Li, Y.-C. Chen and X.-H. Bu, Inorg. Chem., 2013, 52, 9163 CrossRef CAS PubMed.
- A. T. Skjeltorp, C. A. Catanese, H. E. Meissner and W. P. Wolf, Phys. Rev. B: Solid State, 1973, 7, 2062 CrossRef CAS.
- SHELXTL 6.10, Bruker Analytical Instrumentation, Madison, WI, USA, 2000 Search PubMed.
- D. Casanova, M. Llunel, P. Alemany and S. Alvarez, Chem. – Eur. J., 2005, 11, 1479 CrossRef CAS PubMed.
- A. C. Sudik, A. P. Côté and O. M. Yaghi, Inorg. Chem., 2005, 44, 2998 CrossRef CAS PubMed.
- T. Rajeshkumar, S. K. Singh and G. Rajaraman, Polyhedron, 2013, 52, 1299 CrossRef CAS.
- L. Cañadillas-Delgado, Ó. Fabelo, C. Ruiz-Pérez and J. Cano, Magnetic Interactions in Oxo-Carboxylate Bridged Gadolinium(III) Complexes, Nova publishing, Spain, 2010 Search PubMed.
- N. F. Chilton, R. P. Anderson, L. D. Turner, A. Soncini and K. S. Murray, J. Comput. Chem., 2013, 34, 1164 CrossRef CAS PubMed.
- (a) A. Adhikary, J. A. Sheikh, S. Biswas and S. Konar, Dalton Trans., 2014, 43, 9334 RSC; (b) A.-J. Hutchings, F. Habib, R. J. Holmberg, I. Korobkov and M. Murugesu, Inorg. Chem., 2014, 53, 2102 CrossRef CAS PubMed; (c) F. Yang, Q. Zhou, G. Zeng, G.-H. Li, L. Gao, Z. Shi and S.-H. Feng, Dalton Trans., 2014, 43, 1238 RSC.
- (a) V. K. Pecharsky and K. A. Gschneidner Jr., J. Magn. Magn. Mater., 1999, 200, 44 CrossRef CAS; (b) M. Evangelisti and E. K. Brechin, Dalton Trans., 2010, 39, 4672 RSC.
Footnote |
| † Electronic supplementary information (ESI) available. CCDC 1426346 (1) and 1426347 (2). For ESI and crystallographic data in CIF or other electronic format see DOI: 10.1039/c5qi00208g |
| This journal is © the Partner Organisations 2016 |

