A “turn on” fluorescent and chromogenic chemosensor for fluoride anion: experimental and DFT studies†
Pranila B.
Thale‡
,
Pravin N.
Borase‡
and
Ganapati S.
Shankarling
*
Dyestuff Technology Department, Institute of Chemical Technology, Mumbai 400019, India. E-mail: gsshankarling@gmail.com; Fax: +91-22-33611020; Tel: +91-22-33612708
First published on 4th May 2016
Abstract
A simple, convenient “turn on” fluorescent and chromogenic chemosensor for fluoride anion detection in acetonitrile as well as in water has been developed. This probe shows high selectivity and good sensitivity towards fluoride ions. The fluoride-triggered phenolic O–H bond cleavage and hydrogen bonding between the NH group have been mechanistically investigated on the basis of spectral titration with TBAOH, 1H NMR and density functional theory (DFT) studies. The colorimetric sensing of 2-(bis((4-(p-tolyl)thiazole-2-yl)amino)methyl)phenol (BTA) was successfully utilized in the preparation of solid support silica for real sample analysis to detect F− ions. The detection limit for F− was found to be 4.1 × 10⁻⁷ M and the binding stoichiometry was proposed to be 1![[thin space (1/6-em)]](https://www.rsc.org/images/entities/char_2009.gif) :
:![[thin space (1/6-em)]](https://www.rsc.org/images/entities/char_2009.gif) 2 based on the Job's plot and 1H NMR spectroscopic techniques.
2 based on the Job's plot and 1H NMR spectroscopic techniques.
1. Introduction
Selective anion recognition has become a developing area of research in supramolecular chemistry.1,2 In recent years, the progress in synthetic receptors for anion detection has attracted considerable interest. This is because of the crucial role of anions in a wide range of biological, chemical, industrial and environmental processes.3–7 Anions are also present in 70% of all enzymatic sites, which play an important role in the storage of genetic information.8 Thus, it is obligatory to develop a technique for the detection and quantification of anions which will help us to understand the host–guest interaction occurring in chemical and biological systems.Among the various anions, the fluoride ion is of prime importance because of its role in the prevention of osteoporosis and dental caries.9–11 However, excess intake of fluoride ions may lead to serious health problems such as gastric and kidney disorders. The most serious effect is the accumulation of fluoride ions in bones which may cause skeletal fluorosis and bone fractures. Fluoride ion contamination of drinking water is a matter of serious concern in many parts of the world, when its concentration exceeds the maximum permissible limit 1.0–4.0 mg L−1 (Standard regulated by the United States Environmental Protection Agency).12 Therefore, the scientific community is interested in the development of a highly selective, real time responsive fluoride ion sensor that works in either partially or completely aqueous system. Recently, anion sensing through the naked eye (UV-visible) and fluorescence spectroscopy have attracted considerable interest as they are precise, selective, and sensitive methods for monitoring low level concentrations of the target anion.13,14 The structure of the chemosensor consists of the binding site and signalling subunits. These subunits can be covalently or non-covalently linked. Various signalling subunits such as amines, urea, thiourea, amides, azophenols and pyrroles have been employed for the selective recognition and detection of anions.15–20 A major fluorescence signalling mechanism employed for sensing of anions is photoinduced electron transfer21–23 (PET) while, other mechanisms such as fluorescence resonance energy transfer24,25 (FRET), excited state proton transfer26–31 (ESPT) and the intramolecular charge transfer process32,33 (ICT) are also reported in the literature. In the intramolecular charge transfer mechanism, the UV-visible and emission properties are dependent on the electron donor/acceptor strength. The anion can bind either to the electron donor or the acceptor moiety hence, appreciable changes in the signalling mechanism can be observed. In the designing of the anion chemosensor operating through the PET mechanism, the presence of the anion induces the appearance or removal of the energy level between HOMO and LUMO of the fluorophore, thus inducing quenching or enhancement of the fluorescence emission. Generally, an ESPT process involves the transfer of the hydroxy proton to carbonyl oxygen through a pre-existing five or six membered ring hydrogen bonding configuration. These molecules are applied in fluorescent chemosensors because of their suitable photophysical properties including large Stokes shifts and intense fluorescence. Usually, inhibition of the ESPT process is observed upon interaction of the anion with these fluorophores. The FRET sensor consists of a recognition element fused to a pair of fluorophores capable of giving a FRET system. Due to anion binding, the changes in the relative position of the two fluorophores or their orientation is observed, which leads to changes in the FRET efficiency.
Fluoride being the smallest and the most electronegative ion can form strong hydrogen-bonds with hydrogen-bond donors. This unique property has been extensively utilized by scientists to develop fluoride anion sensors. The strategies used for fluoride anion sensors involve hydrogen bonding,34 cleavage of the Si–O bond35,36 and anion–π interaction.37,38 These methods have disadvantages like, interference by thiols for fluoride assisted cleavage of the Si–O bond and interference of acetate and pyrophosphate ions for detection of fluoride anions in urea/thiourea based sensors. The reported fluoride sensors are often complex molecule structures39,40 and require several synthetic steps for their preparation.41 Hence, here we report a simple and easy method to synthesize a novel receptor which can selectively detect F− in the presence of other anions. This supramolecular platform based receptor contains two thiazole rings connected via NH subunits, which represents a simple, highly selective colorimetric and fluorogenic chemosensor.
2. Experimental section
2.1 Materials and methods
All anions were used in the form of n-tetrabutylammonium salts. All analytical grade chemicals and reagents were purchased from S. D. Fine Chem. Ltd, India. The spectroscopic grade solvents were used as received without further purification. Distilled water was used throughout the experiment. The NMR spectra were obtained by using a Varian 500 MHz NMR using CDCl3 as the solvent and tetramethylsilane (TMS) as an internal standard. Chemical shifts were expressed in (δ) ppm using TMS as an internal standard. The mass data of the BTA were recorded on a Bruker ultrafleXtreme MALDI-TOF mass spectrometer. The FT-IR spectra were measured with KBr pellets using a Bruker-VERTEX 80v vacuum FTIR spectrometer.2.2 UV-visible and fluorescence experiments
All UV-Vis spectroscopic measurements were recorded on a Varian Cary 50 Conc UV/VIS spectrometer. Fluorescence spectra were recorded on a Varian Cary Eclipse fluorescence spectrometer at room temperature. The absorption and emission spectral measurements were performed by using a quartz cuvette of 1 cm path length. The emission spectra were recorded by exciting the receptor BTA at 385 nm. Excitation and emission slit widths were kept constant at 10 nm and the data points were smoothened by using the Savitzky–Golay smoothing filter. Stock solutions of the anion (1 mM) and the receptor BTA (50 μM) were prepared in acetonitrile. For spectrophotometric titrations, the required amount of the receptor was taken directly into a quartz cuvette. The spectral measurements were recorded after each aliquot addition of the anion solution using a micropipette. The changes in absorbance at 488 nm were plotted against fluoride ion concentration to obtain the results. The Job's plot was constructed by using a continuous concentration variation method.2.3 Fluoride ion signalling for the practical sample
To confirm the practical applicability of BTA, a comparative study of fluoride signalling from distilled water and simulated water was carried out. The changes in the signalling of BTA for distilled water and simulated water were measured as a function of fluoride ion concentrations. Stock solutions of potassium fluoride (1 × 10⁻² M) were prepared in distilled water and simulated water. The stock solution of BTA (1 × 10⁻² M) was prepared using a 5% H2O![[thin space (1/6-em)]](https://www.rsc.org/images/entities/char_2009.gif) :
:![[thin space (1/6-em)]](https://www.rsc.org/images/entities/char_2009.gif) DMSO system. Simulated water has the following composition: [Cl−], [Br−], [I−], [HPO2−4], [SO2−4], [AcO−] = (1 × 10⁻⁴ M) of each.
DMSO system. Simulated water has the following composition: [Cl−], [Br−], [I−], [HPO2−4], [SO2−4], [AcO−] = (1 × 10⁻⁴ M) of each.
2.4 Synthesis of the receptor (BTA)
![[thin space (1/6-em)]](https://www.rsc.org/images/entities/char_2009.gif) :
:![[thin space (1/6-em)]](https://www.rsc.org/images/entities/char_2009.gif) 20). Yield: 0.78 g, 62%. Melting point: 243 °C.
20). Yield: 0.78 g, 62%. Melting point: 243 °C.
IR/cm−1: 3447, 3062, 3040, 2851, 1621, 1599, 1455, 1148, 1029, 753.
1H NMR: (500 MHz, CDCl3, TMS): δ ppm = 12.18 (s, 1H, –OH), 9.14 (s, 1H, –NH), 7.41 (m, J = 6.5 Hz, 5H), 7.20 (dt, J = 7.7 Hz, 1H), 7.01 (m, J = 8.4, 2.7 Hz, 5H), 6.97–6.93 (m, 2H), 6.77 (d, J = 8.0 Hz, 1H), 6.38 (s, 1H), 2.29 (s, 6H).
13C NMR (125 MHz, CDCl3, TMS) δ ppm = 167.10, 164.68, 161.55, 153.05, 150.41, 138.00, 135.54, 134.72, 133.64, 131.06, 129.87, 129.25, 129.10, 128.21, 120.99, 119.66, 118.44, 117.52, 115.92, 37.19, 21.29.
ESI MS m/z (M + H): 485.1490 Calc. for C27H24N4OS2 = 484.1392.
3. Results and discussion
3.1 Colorimetric sensing of BTA
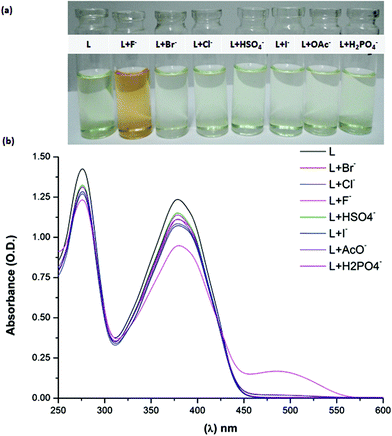
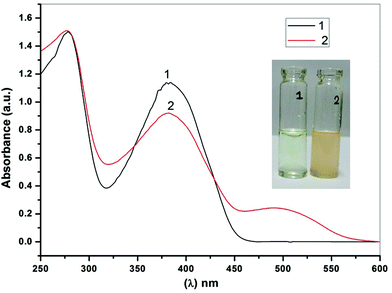
The receptor BTA was synthesized by using the steps as depicted in Scheme 1 and was characterized by various spectral techniques (IR, 1H NMR, 13C NMR and ESI-QTOF). The anion binding ability of the receptor BTA towards different anions such as F−, OAc−, H2PO4−, Cl−, Br−, I−, and HSO4− was investigated by the naked eye, UV-Vis absorption and fluorescence spectroscopy. The first indication for anion binding of the receptor was observed with the naked eye. The receptor showed a remarkable colour change from slight yellow to dark orange upon addition of 10 equivalents of the F− anion whereas, upon addition of 10 equivalents of different anions (1 mM, in acetonitrile) such as Br−, Cl−, I−, OAc−, HSO4−, and H2PO4−, it did not show any colour change (Fig. 1). The UV-vis spectrum of the free receptor BTA exhibited two π–π* absorption bands at 288 and 385 nm. Upon addition of F− (10 equivalents of F−, 1 mM, in acetonitrile), a new charge transfer band at 488 nm was observed with a large red-shift of 105 nm (Fig. 1). However, no change was observed in the absorbance spectra even after excess addition of the other anion solutions. The color change is due to the hydrogen bond interaction43,44 of the NH group with the fluoride ion and deprotonation of the receptor45 by the fluoride ion. These results clearly indicate that the receptor BTA exhibited a distinct host–guest interaction with the fluoride ion. The remarkable bathochromic shift shows the existence of the ground state interaction of the fluoride ion with –OH and –NH groups. The high selectivity for the fluoride ion is observed due to its high charge density and small size.The specificity of the receptor BTA was studied by performing a competitive experiment (Fig. S3†). The absorbance of the receptor (1.0 ml, 10 mM) was recorded in the presence of F− (0.5 ml, 1 mM) and other interfering anions (0.5 ml, 1 mM). It was observed that the absorption enhancement at 488 nm caused by the F− anion was retained and did not interfere with, on the addition of other competitive anions. Also, the orange colour change was retained in the presence of other anions. The oxygen-containing anions especially the acetate and dihydrogen phosphate are the interfering anions in the detection of fluoride, the reason being their similar basicity and surface charge density. To illustrate the selectivity of receptor BTA towards fluoride, the comparison data with some of the reported anion sensors is mentioned in Table S1.†
Further, to examine the practical application of the receptor in the presence of water, the spectral and colorimetric changes were investigated using a mixed solvent system. The intensity of the color decreases reversibly on addition of water because the presence of a protic solvent presumably competes with the anion for binding sites and disturbs the hydrogen bond interaction. However, in a 5% H2O![[thin space (1/6-em)]](https://www.rsc.org/images/entities/char_2009.gif) :
:![[thin space (1/6-em)]](https://www.rsc.org/images/entities/char_2009.gif) ACN system, the receptor BTA showed both the colorimetric and spectral response towards the fluoride ion which makes it suitable for biological applications. (Fig. S4†).
ACN system, the receptor BTA showed both the colorimetric and spectral response towards the fluoride ion which makes it suitable for biological applications. (Fig. S4†).
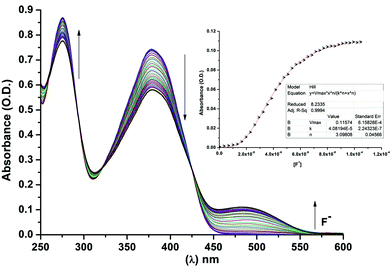
The changes in the absorption spectra of BTA as a function of F− ion concentration is shown in Fig. 2. Upon addition of F− ions to the solution of BTA, the absorption peak at 385 nm gradually decreased while a new peak at 488 nm appeared with the formation of clear isosbestic points at 321 and 425 nm. This clearly indicates the formation of a 1![[thin space (1/6-em)]](https://www.rsc.org/images/entities/char_2009.gif) :
:![[thin space (1/6-em)]](https://www.rsc.org/images/entities/char_2009.gif) 2 binding complex in the solution. The titration isotherm shows a sigmoidal curve and hence, we have used the Hill equation for titration isotherm (Fig. 2, inset). From the graph, the Hill coefficient (n) was found to be 3 (n > 1) indicating a positive binding cooperative binding process, which indicates the presence of more than one binding site in the ligand BTA. For 1
2 binding complex in the solution. The titration isotherm shows a sigmoidal curve and hence, we have used the Hill equation for titration isotherm (Fig. 2, inset). From the graph, the Hill coefficient (n) was found to be 3 (n > 1) indicating a positive binding cooperative binding process, which indicates the presence of more than one binding site in the ligand BTA. For 1![[thin space (1/6-em)]](https://www.rsc.org/images/entities/char_2009.gif) :
:![[thin space (1/6-em)]](https://www.rsc.org/images/entities/char_2009.gif) 2 host guest equilibria, a stepwise process as described in eqn (1) and (2) is possible with the two binding constants eqn (3) and (4).
2 host guest equilibria, a stepwise process as described in eqn (1) and (2) is possible with the two binding constants eqn (3) and (4).
| BTA + F− ⇌ BTA·F | (1) |
| BTA·F + F− ⇌ BTA·2F | (2) |
| K1 = [BTA·F]/([BTA][F−]) | (3) |
| K2 = [BTA·2F]/([BTA·F][F−]) | (4) |
From the absorption titration plot, binding constants were calculated by using an iterative data fitting procedure46 in the origin software by using eqn (5). (The detailed mathematical equations are given in the ESI.†)
 | (5) |
Further, the detection limit was calculated by using the equation, 3σ/S, where σ = standard deviation of BTA absorbance, S = slope obtained from the graph of optical densities versus anion concentration (Fig. S2†). The limit of detection (LOD) for the F− anion was 4.1 × 10⁻⁷ M.
The binding stoichiometry of the receptor BTA towards the F− ion was performed by Job's plot analysis using the continuous concentration variation method. The total concentration of BTA and F− ions was kept constant (2.5 × 10⁻⁴ M in acetonitrile) and the spectroscopic changes were recorded by varying the BTA![[thin space (1/6-em)]](https://www.rsc.org/images/entities/char_2009.gif) :
:![[thin space (1/6-em)]](https://www.rsc.org/images/entities/char_2009.gif) F ratio (Fig. 3). The BTA·2F complex concentration approaches maximum when the mole fraction of BTA is 0.33, which means BTA and F− form a 1
F ratio (Fig. 3). The BTA·2F complex concentration approaches maximum when the mole fraction of BTA is 0.33, which means BTA and F− form a 1![[thin space (1/6-em)]](https://www.rsc.org/images/entities/char_2009.gif) :
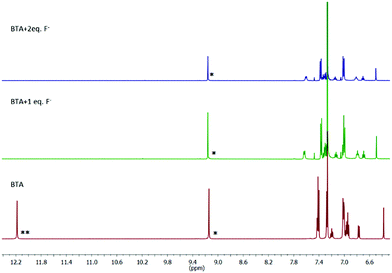
:![[thin space (1/6-em)]](https://www.rsc.org/images/entities/char_2009.gif) 2 complex. Further, 1H NMR titration was performed to understand the binding stoichiometry between the receptor and F− ion. As shown in Fig. 5, the chemical shift value of phenolic OH at 12.18 ppm completely disappears upon the addition of 2.0 equivalents of F− ions whereas, the chemical shift value of the NH proton shifts slightly downfield from 9.14 to 9.16 ppm indicating the hydrogen bonding interaction of the NH groups with the F− ion. Upfield shifts were observed for all aromatic protons. The high acidity and hydrogen bonding ability of the OH group make it preferable to undergo deprotonation whereas, the NH group prefers to form hydrogen bonding. The deprotonation mechanism of the OH group was also proved by spectral titration of the receptor BTA with a strong base TBAOH (Fig. S6†) which shows similar spectral changes to those observed in the presence of F− ions.
2 complex. Further, 1H NMR titration was performed to understand the binding stoichiometry between the receptor and F− ion. As shown in Fig. 5, the chemical shift value of phenolic OH at 12.18 ppm completely disappears upon the addition of 2.0 equivalents of F− ions whereas, the chemical shift value of the NH proton shifts slightly downfield from 9.14 to 9.16 ppm indicating the hydrogen bonding interaction of the NH groups with the F− ion. Upfield shifts were observed for all aromatic protons. The high acidity and hydrogen bonding ability of the OH group make it preferable to undergo deprotonation whereas, the NH group prefers to form hydrogen bonding. The deprotonation mechanism of the OH group was also proved by spectral titration of the receptor BTA with a strong base TBAOH (Fig. S6†) which shows similar spectral changes to those observed in the presence of F− ions.
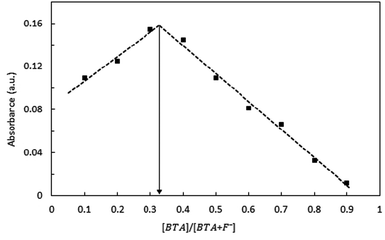 | ||
Fig. 3 Job's plot indicating the 1![[thin space (1/6-em)]](https://www.rsc.org/images/entities/char_2009.gif) : :![[thin space (1/6-em)]](https://www.rsc.org/images/entities/char_2009.gif) 2 complex relationship between the receptor BTA and F− ions. The total concentration of BTA and F− ions was kept constant (2.5 × 10⁻⁴ M). 2 complex relationship between the receptor BTA and F− ions. The total concentration of BTA and F− ions was kept constant (2.5 × 10⁻⁴ M). | ||
3.2 Fluorescence study
The anion binding behaviour of the receptor was also studied by fluorescence spectroscopy as shown in Fig. 4. The excitation of the receptor BTA at 385 nm resulted in emission at 450 nm. On incremental addition of F− anions, the emission band was blue shifted with an eleven fold increment in the fluorescence intensity whereas, on addition of other anions, there was no shift in the emission intensity. Fig. S5† shows the evolution of emission spectra of the receptor with incremental addition of F− ions. The clear changes in the emission spectra indicate the presence of a strong interaction of the receptor with the F− ion. Further, the changes in fluorescence intensity were examined upon addition of various competitive anions along with the F− ion, (Fig. S3†) which shows that there is no interference with the sensing ability of BTA for F− ions.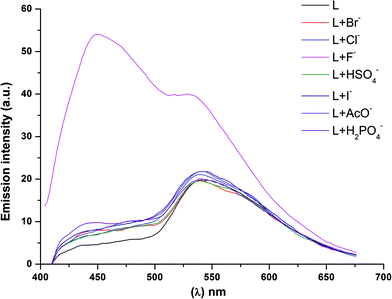 | ||
| Fig. 4 Emission spectra of the receptor BTA in the presence of different anions ([L] = 25 μM, [Anion] = 1 mM) in acetonitrile (λex = 385 nm). | ||
3.3 Computational study
In order to complement our findings, electronic properties were computed by using the Turbomole-V6.6 program47–49 using density functional theory. The Becke's three-parameter hybrid exchange functional with the Lee–Yang–Parr gradient correlated correlation (B3LYP as functional) and def-SV(P) as the basis set was used in the DFT method. To evaluate the solvent effect, acetonitrile was used as a solvent by using the conductor like screening model (COSMO) method. The geometry optimised structures of the receptor BTA and BTA·2F complex along with important bond lengths are shown in Fig. 6. Significant changes such as reduction in C–O and C–N bond lengths and the elongation of O–H and N–H bond lengths were observed upon interaction with the F− ion as shown in Table 1. This explains the deprotonation of the phenolic OH group50 and presence of the hydrogen bonding between the two NH groups51 upon interaction with the F− ion. After the ground state geometry optimisation, we have calculated the binding energy [ΔE = Eelec(complex) − Eelec(anion) − Eelec (ligand)] for the BTA·2F complex. The binding energy was found to be −274.10 kJ mol−1, which shows that F− ions form a strong complex with the receptor. The analysis of the molecular electrostatic potential diagram of BTA shows two electropositive regions (blue colour) located above the amine proton and hydroxy proton. These on interaction with F− ions show a molecular twist in the BTA structure (Fig. 7). The natural bond orbital (NBO) analysis shows that the electron density at the oxygen atom of the receptor was changed from −0.69271 to −0.71149 with the formation of the BTA·2F complex.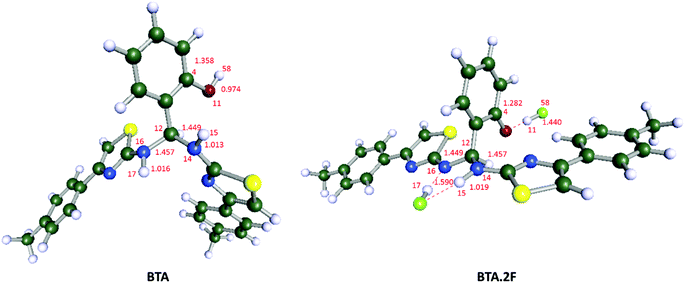 | ||
| Fig. 6 DFT computed optimised structure of BTA and BTA·2F by applying the B3LYP/def-SV(P) method in the acetonitrile phase using the COSMO model. | ||
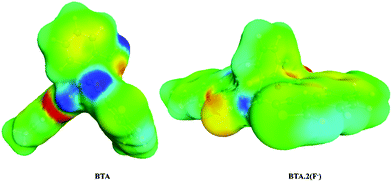 | ||
| Fig. 7 Molecular electrostatic potential diagram of BTA and BTA·2F (red: negative charge, blue: positive charge, green: neutral). | ||
| Bond length (Å) | BTA | BTA·2F |
|---|---|---|
| C(4)–O(11) | 1.358 | 1.282 |
| O(11)–H(58) | 0.974 | 1.440 |
| C(12)–N(16) | 1.457 | 1.449 |
| N(16)–H(17) | 1.016 | 1.59 |
| C(12)–N(14) | 1.449 | 1.457 |
| N(14)–H(15) | 1.013 | 1.019 |
Further, the highest occupied molecular orbital (HOMO) and lowest unoccupied molecular orbital (LUMO) of the BTA·2F complex were computed based on the binding stoichiometry as investigated by the Job's plot analysis, shown in Fig. 8. The HOMO and LUMO electron densities of BTA and the BTA·2F complex indicate π–π* electronic transition. The HOMO electron density of BTA was distributed mainly on one of the thiazole rings, whereas, the HOMO electron density of the BTA·2F complex is distributed on the other thiazole ring because of charge delocalization which has occurred due to the deprotonation process. In addition, the HOMO–LUMO band gap of BTA decreases from 4.41 to 0.75 eV on interaction with the F− ion which supports the occurrence of a new intense absorption band centered at 488 nm and orange coloration of the BTA·2F complex.
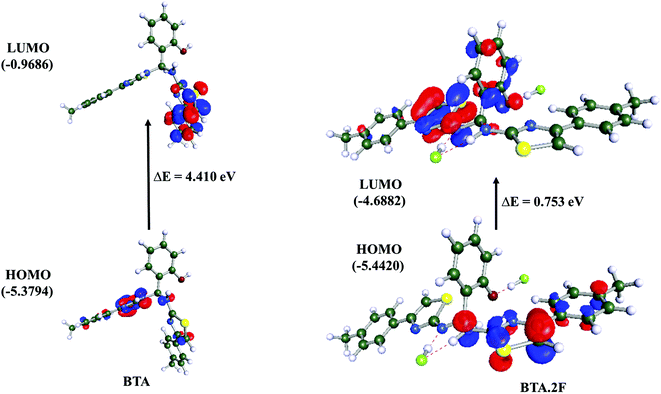 | ||
| Fig. 8 HOMO and LUMO diagrams of BTA and BTA·2F obtained by applying the B3LYP/def-SV(P) method in the acetonitrile phase in the COSMO model. | ||
3.4 Analytical application of BTA
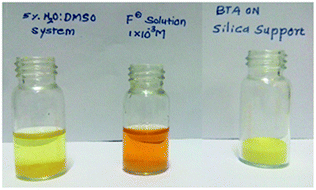
After envisaging the correlation between experimental and theoretical chemistry, we have explored the practical utility of the sensor.Test kit for fluoride detection: In order to ensure practical applicability for the detection of F− ions, BTA loaded silica gel was prepared. The silica gel (60–120 mesh, 5 g) was first treated with BTA (in methanol, 10 ml, 1 × 10⁻³ M) and then dried to obtain yellow color silica loaded with the receptor BTA. The silica was then added to the fluoride solution (1 × 10⁻³ M, 5% H2O![[thin space (1/6-em)]](https://www.rsc.org/images/entities/char_2009.gif) :
:![[thin space (1/6-em)]](https://www.rsc.org/images/entities/char_2009.gif) DMSO) and 5% H2O
DMSO) and 5% H2O![[thin space (1/6-em)]](https://www.rsc.org/images/entities/char_2009.gif) :
:![[thin space (1/6-em)]](https://www.rsc.org/images/entities/char_2009.gif) DMSO system (Fig. 9 and ESI video†). The faint yellow color promptly turned to an orange color on addition of BTA loaded silica to fluoride solution which clearly inferred the practical application of BTA for qualitative detection of fluoride in a mixed aqueous system.
DMSO system (Fig. 9 and ESI video†). The faint yellow color promptly turned to an orange color on addition of BTA loaded silica to fluoride solution which clearly inferred the practical application of BTA for qualitative detection of fluoride in a mixed aqueous system.
Moreover, analytical application of the receptor for real sample analysis was also performed. The sample was prepared by using a reported literature method.52 20 mg of a toothpaste sample was dissolved in 1 ml of water and subsequently filtered. On addition of 0.25 ml of the filtrate to a 50 μM receptor (in DMSO), the colour changed from light yellow to orange with the appearance of a charged transfer absorbance band at 488 nm as shown in Fig. 10.
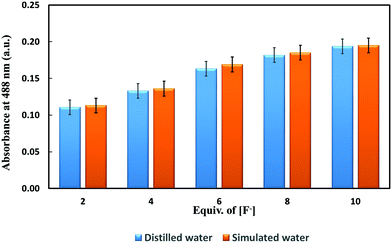
Finally, the application of the receptor BTA for determination of fluoride in distilled water and simulated water was evaluated as shown in Fig. 11. The response of BTA with respect to change in the fluoride ion concentration both in distilled water and simulated water was similar. It shows that the receptor BTA is useful for selective quantification of fluoride ions in practical samples.
4. Conclusion
In summary, a novel colorimetric and fluorescent “turn-on” sensor for selective detection of fluoride ions in acetonitrile as well as in a mixed aqueous system has been developed. The anion binding ability of the receptor has been thoroughly studied by 1H NMR titration, DFT and spectroscopic techniques. The dual signalling phenomenon forms the basis for potential applications in analytical fields. We could effectively detect fluoride ions in a toothpaste sample. Further, qualitative detection of F− ions in a mixed aqueous system by the naked eye has been successfully demonstrated by a solid silica support technique. Owing to the above features, the receptor BTA can find many potential applications in biological sample analyses.Acknowledgements
Authors are thankful to UGC-SAP, Technical Education Quality Improvement Programme for providing financial assistance.Notes and references
- T. Gunnlaugsson, M. Glynn, G. M. Tocci (née Hussey), P. E. Kruger and F. M. Pfeffer, Coord. Chem. Rev., 2006, 250, 3094–3117 CrossRef CAS.
- E. a. Katayev, Y. a. Ustynyuk and J. L. Sessler, Coord. Chem. Rev., 2006, 250, 3004–3037 CrossRef CAS.
- C. Suksai and T. Tuntulani, Top. Curr. Chem., 2003, 255, 163–198 Search PubMed.
- R. Martínez-Máñez and F. Sancenón, J. Fluoresc., 2003, 15, 267–285 CrossRef PubMed.
- P. a. Gale, Coord. Chem. Rev., 2003, 240, 191–221 CrossRef CAS.
- H. W. Rhee, J. C. So, H. Y. Sang, O. J. Yong, H. P. Hun, R. M. Pinto, J. C. Cameselle, F. J. Sandoval, S. Roje, K. Han, S. C. Doo, J. Suh and J. I. Hong, J. Am. Chem. Soc., 2009, 131, 10107–10112 CrossRef CAS PubMed.
- R. M. Duke, E. B. Veale, F. M. Pfeffer, P. E. Kruger and T. Gunnlaugsson, Chem. Soc. Rev., 2010, 39, 3936–3953 RSC.
- P. S. Dieng and C. Sirlin, Int. J. Mol. Sci., 2010, 11, 3334–3348 CrossRef CAS PubMed.
- P. L. Andrus, Tex. Med., 1982, 78, 57–61 CAS.
- O. Barbier, L. Arreola-Mendoza and L. M. Del Razo, Chem.-Biol. Interact., 2010, 188, 319–333 CrossRef CAS PubMed.
- M. Kleerekoper, Endocrinol. Metab. Clin. North Am., 1998, 27, 441–452 CAS.
- J. Chilton, E. Dahi, M. Lennon, P. Jackson, J. Fawell, K. Bailey, L. Fewtrell and Y. Magara, Fluoride in Drinking-water, IWA Publishing, London, 2006, pp. 83–93 Search PubMed.
- Y. Zhou, J. F. Zhang and J. Yoon, Chem. Rev., 2014, 114, 5511–5571 CrossRef CAS PubMed.
- N. H. Evans and P. D. Beer, Angew. Rev., 2014, 53, 11716–11754 CrossRef CAS PubMed.
- V. Amendola, L. Fabbrizzi and L. Mosca, Chem. Soc. Rev., 2010, 39, 3889–3915 RSC.
- C. Bazzicalupi, A. Bencini and V. Lippolis, Chem. Soc. Rev., 2010, 39, 3709–3728 RSC.
- P. Dydio, D. Lichosyt and J. Jurczak, Chem. Soc. Rev., 2011, 40, 2971–2985 RSC.
- P. a. Gale, Coord. Chem. Rev., 2000, 199, 181–233 CrossRef CAS.
- P. a. Gale and R. Quesada, Coord. Chem. Rev., 2006, 250, 3219–3244 CrossRef CAS.
- Y. Zhou, J. Y. Jung, H. R. Jeon, Y. Kim, S. J. Kim and J. Yoon, Org. Lett., 2011, 13, 2742–2745 CrossRef CAS PubMed.
- S. K. Kim and J. Yoon, Chem. Commun., 2002, 1, 770–771 RSC.
- T. Gunnlaugsson, A. P. Davis and M. Glynn, Chem. Commun., 2001, 2556–2557 RSC.
- V. Thiagarajan, P. Ramamurthy, D. Thirumalai and V. T. Ramakrishnan, Org. Lett., 2005, 7, 657–660 CrossRef CAS PubMed.
- R. Pohl, D. Aldakov, P. Kubát, K. Jursíková, M. Marquez and P. Anzenbacher, Chem. Commun., 2004, 1282–1283 RSC.
- T. Kuner and G. J. Augustine, Neuron, 2000, 27, 447–459 CrossRef CAS PubMed.
- Y. Zhao, B. Zhang, C. Duan, Z. Lin and Q. Meng, New J. Chem., 2006, 30, 1207–1213 RSC.
- K. Choi and A. D. Hamilton, Angew. Chem., Int. Ed., 2001, 40, 3912–3915 CrossRef CAS.
- V. Luxami and S. Kumar, Tetrahedron Lett., 2007, 48, 3083–3087 CrossRef CAS.
- Y. Wu, X. Peng, J. Fan, S. Gao, M. Tian, J. Zhao and S. Sun, J. Org. Chem., 2007, 72, 62–70 CrossRef CAS PubMed.
- S. Mukherjee, A. Kumar and H. Stoeckli-evans, Sens. Actuators, B, 2014, 202, 1190–1199 CrossRef CAS.
- X. Li, B. Hu, J. Li, P. Lu and Y. Wang, Sens. Actuators, B, 2014, 203, 635–640 CrossRef CAS.
- F.-Y. Wu, Z. Li, L. Guo, X. Wang, M.-H. Lin, Y.-F. Zhao and Y.-B. Jiang, Org. Biomol. Chem., 2006, 4, 624–630 CAS.
- S. Sharma, M. S. Hundal and G. Hundal, Tetrahedron Lett., 2013, 54, 2423–2427 CrossRef CAS.
- X. Y. Liu, D. R. Bai and S. Wang, Angew. Chem., Int. Ed., 2006, 45, 5475–5478 CrossRef CAS PubMed.
- S. Y. Kim and J. I. Hong, Org. Lett., 2007, 9, 3109–3112 CrossRef CAS PubMed.
- P. Sokkalingam and C. H. Lee, J. Org. Chem., 2011, 76, 3820–3828 CrossRef CAS PubMed.
- Y. Kubo, T. Ishida, A. Kobayashi and T. D. James, J. Mater. Chem., 2005, 15, 2889–2895 RSC.
- Y. Kubo, A. Kobayashi, T. Ishida, Y. Misawa and T. D. James, Chem. Commun., 2005, 2846–2848 RSC.
- S. Arimori, M. G. Davidson, T. M. Fyles, T. G. Hibbert, D. James and G. I. Kociok-k, Chem. Commun., 2004, 1640–1641 RSC.
- P. Thiampanya, N. Muangsin and B. Pulpoka, Org. Lett., 2012, 14, 4050–4053 CrossRef CAS PubMed.
- X. Jiang, M. C. Vieweger, J. C. Bollinger, B. Dragnea and D. Lee, Org. Lett., 2007, 9, 3579–3582 CrossRef CAS PubMed.
- R. M. El-Shishtawy, F. Borbone, Z. M. Al-Amshany, A. Tuzi, A. Barsella, A. M. Asiri and A. Roviello, Dyes Pigm., 2013, 96, 45–51 CrossRef CAS.
- S. Nishizawa, P. Bühlmann, M. Iwao and Y. Umezawa, Tetrahedron Lett., 1995, 36, 6483–6486 CrossRef CAS.
- P. J. Smith, M. V. Reddington and C. S. Wilcox, Tetrahedron Lett., 1992, 33, 6085–6088 CrossRef CAS.
- X. Zhang, L. Guo, F. Y. Wu and Y. B. Jiang, Org. Lett., 2003, 5, 2667–2670 CrossRef CAS PubMed.
- A. E. Hargrove, Z. Zhong, J. L. Sessler and E. V. Anslyn, New J. Chem., 2010, 34, 348 RSC.
- TURBOMOLE V6.6 (2014), A Development of University of Karlsruhe and Forschungszentrum Karlsruhe GmbH, 1989–2007, TURBOMOLE GmbH, since 2007, available from http://www.turbomole.com.
- O. Ahlrichs and R. Ahlrichs, Efficient molecular numerical integration schemes, J. Chem. Phys., 1995, 102, 346–354 CrossRef.
- M. Von Arnim and R. Ahlrichs, Performance of parallel TURBOMOLE for density functional calculations, J. Comput. Chem., 1998, 19, 1746–1757 CrossRef CAS.
- D. Sharma, S. K. Sahoo, R. K. Bera and R. Kamal, J. Fluoresc., 2013, 23, 387–392 CrossRef CAS PubMed.
- T. Ghosh and B. G. Maiya, J. Phys. Chem. A, 2004, 108, 11249–11259 CrossRef CAS.
- S. Suganya, J. S. Park and S. Velmathi, Sens. Actuators, B, 2014, 190, 679–684 CrossRef CAS.
Footnotes |
| † Electronic supplementary information (ESI) available. See DOI: 10.1039/c6qi00033a |
| ‡ These authors contributed equally. |
| This journal is © the Partner Organisations 2016 |


