Visible-light-induced water reduction reaction for efficient hydrogen production by N-doped In2Ga2ZnO7 nanoparticle decorated on RGO sheets†
Deepak kumar
Padhi
ab,
Kulamani
Parida
*ac and
S. K.
Singh
ab
aAcademy of Scientific and Innovative Research (AcSIR), Council of Scientific and Industrial Research, Anusandhan Bhawan, 2 Rafi Marg, New Delhi-110 001, India. E-mail: paridakulamani@yahoo.com
bAdvanced Materials Technology Department, CSIR-Institute of Minerals and Materials Technology, Bhubaneswar – 751 013, Odisha, India
cCentre for Nano Science and Nano Technology, ITER, Sikha ‘O’ Anusandhan University, Bhubaneswar—751 030, Odisha, India
First published on 26th September 2016
Abstract
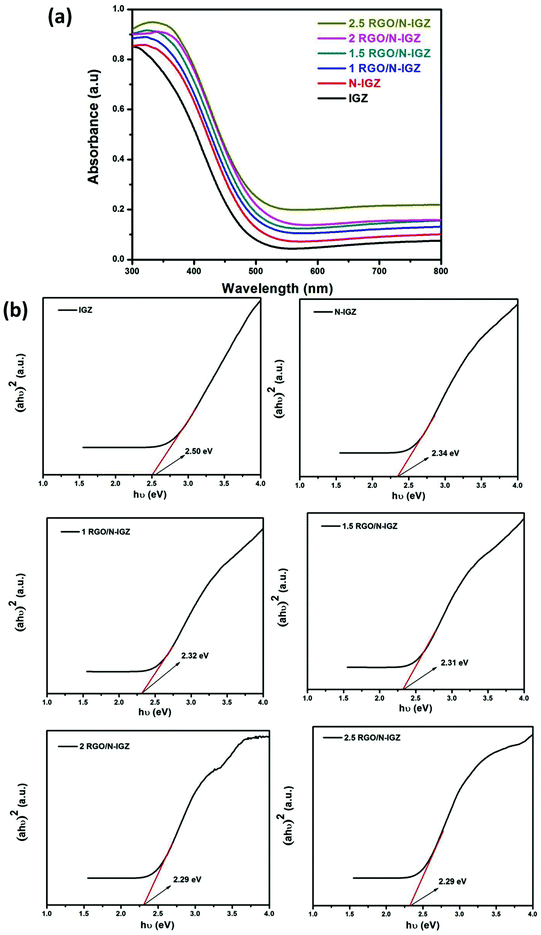
This work presents an efficient in situ chemical method for constructing graphene-based N-doped In2Ga2ZnO7 nanocomposites (RGO/N-IGZ) for the production of hydrogen (H2) under visible-light irradiation. Well-anchored N-doped IGZ nanoparticles on RGO sheets were successfully obtained by the hydrothermal route that was employed. Several crystallographic, microscopic, and spectroscopic methods (XRD, DRUV-vis, PL spectra, TRPL analysis, XPS, TEM, and photoelectrochemical and photostability measurements) were adopted to study the robust photocatalytic activity of all the synthesised photocatalysts. A DRS study revealed that doping an IGZ nanoparticle with N reduced its band gap (Eg) from 2.50 eV to 2.34 eV and, furthermore, the introduction of RGO into the N-IGZ nanoparticle altered its Eg to 2.29 eV. The loading amount of RGO in an N-IGZ nanoparticle played a crucial role in enhancing the photocatalytic H2-producing ability of the N-IGZ nanoparticle. In the absence of a co-catalyst, a loading of RGO of only 2 wt% in N-IGZ enabled the production of the highest amount of H2, i.e. 726 μmol h−1, under visible-light irradiation. The superior photocatalytic activity of the 2RGO/N-IGZ nanocomposite in comparison with that of neat N-IGZ nanoparticles was demonstrated by correlation with the results obtained from BET surface area analysis, TEM, PL, TRPL, and photocurrent and photostability measurements, which concluded by showing better charge separation in the 2RGO/N-IGZ nanocomposite. 2RGO/N-IGZ exhibited low PL intensity, a longer average decay time (the values of <τ> for N-IGZ and 2RGO/N-IGZ were 2.11 and 7.11 ns, respectively), high photocurrent generation (42 times greater than that of N-IGZ), a large surface area and the production of the highest amount of H2 under visible-light irradiation without using any co-catalyst.
1. Introduction
As far as the “hydrogen economy” is concerned, the production of hydrogen energy using visible-light-driven semiconductor-based photocatalysts has been considered to be one of the most promising fields of research.1 Many semiconductor-based photocatalysts such as oxides, sulfides, oxynitrides and nanocomposites have already been developed by many researchers since the significant discovery of TiO2 photocatalysts by Honda and Fujishima in 1972.2–8 However, the flash recombination of photoexcited electron–hole pairs is the major drawback of metal oxides for their commercial application. In this context, several techniques such as doping with cations or anions,9–12 the formation of heterostructures, and also loading with noble metal co-catalysts such as Pt, Pd, Au and Ag13–16 have been introduced to reduce the recombination of charge carriers.In general, doping of metal oxide materials with cations creates a platform for the trapping of electrons by metal centres, which reduces their photocatalytic efficiency. Therefore, doping with anions is preferable. In particular, many researchers have reported N-containing materials such as N-doped TiO2,17 N-doped Ta2O5,18 solid solutions of GaN:ZnO,19 Ge3N4,20 N-doped In2O3,21 TaON,22 N-doped metal tantalite,23 and Mg–Zr-cosubstituted Ta3N5![[thin space (1/6-em)]](https://www.rsc.org/images/entities/char_2009.gif) 24 for water splitting. However, their low stability towards photocorrosion25,26 restricts the practical application of these N-containing materials.
24 for water splitting. However, their low stability towards photocorrosion25,26 restricts the practical application of these N-containing materials.
Among different metal oxides, d10-based metal oxides have been considered to be some of the most suitable candidates, as determined by Arai et al.27 Metal ions with d10 electronic configurations form metal oxides that consist of distorted metal–oxygen octahedral/tetrahedral coordination and also form highly dispersed broad sp conduction bands, which enable greater mobility of photoexcited electrons for photocatalytic reactions. In this regard, d10-based metal oxides such as In2Ga2ZnO7 mixed oxide nanorods, N-doped In2Ga2ZnO7, N-doped GaZn mixed oxides, RuO2-dispersed Zn2GeO4, GaN:ZnO solid solutions, (Ga1−xZnx)(N1−xOx) solid solutions and In-doped GaON, etc., have been developed for the photocatalytic production of H2 under visible-light irradiation.28–35 Among these, our group have reported In2Ga2ZnO7 mixed oxide nanorods, N-doped In2Ga2ZnO7 and N-doped GaZn mixed oxides for the production of H2 under visible-light irradiation.28–31
On the other hand, graphene-based hybrid photocatalysts have been extensively used in the field of photocatalysis in recent years. Among several carbon-based materials, graphene possesses remarkable optical, thermal, electrical, mechanical and unique surface properties,36,37 by which it extracts photoexcited electrons from the conduction band (CB) of a metal oxide and channels them through its 2D honeycomb lattice composed of an sp2-hybridised π-conjugated carbon network for the better utilisation of photoexcited electrons in the photochemical process. Taking this into account, several graphene-based metal oxide photocatalysts have already been reported,38 including the work carried out by the authors’ group on α-Fe2O3 nanorods/RGO, α-FeOOH nanorods/RGO, Gd(OH)3 nanorods/RGO, RGO/In2Ga2ZnO7 and RGO/N-GZ mixed oxide nanocomposite systems for photocatalytic applications.39–43
Until now, N-containing d10-based metal oxide/graphene hybrid photocatalysts have not been widely reported for the photocatalytic production of H2. Considering the advantages of the unique properties of graphene, the special features of d10-based metal oxide nanoparticles and doping of metal oxides with N for band gap engineering, in this work we have devised a novel approach for the in situ one-pot fabrication of a RGO/N-In2Ga2ZnO7 mixed oxide nanocomposite by a single-step hydrothermal route and its employment for the production of H2. In our previous work, N-doped In2Ga2ZnO7 was synthesised by a solid-state reaction route.29 The priority of this work was to increase the photocatalytic efficiency of N-doped In2Ga2ZnO7 by making a composite with graphene. RGO/N-doped In2Ga2ZnO7, which was synthesised by a hydrothermal route, displayed outstanding optical and electronic properties, by which enhanced photocatalytic activity was observed in comparison with our previous work on neat N-doped In2Ga2ZnO7![[thin space (1/6-em)]](https://www.rsc.org/images/entities/char_2009.gif) 29 and also a RGO/InGaZn mixed oxide nanocomposite.42
29 and also a RGO/InGaZn mixed oxide nanocomposite.42
2. Experimental
2.1 Materials
Indium nitrate (In(NO3)3), gallium nitrate (Ga(NO3)3), zinc nitrate (Zn(NO3)2), pyridine, natural graphite powder and potassium permanganate (KMnO4) were obtained from Sigma Aldrich chemicals. Sulphuric acid (H2SO4), hydrochloric acid (HCl), sodium nitrate (NaNO3), hydrogen peroxide (H2O2) and sodium hydroxide (NaOH) were obtained from Finar Chemicals Limited.2.2 Hydrothermal synthesis of RGO/N-IGZ mixed oxide
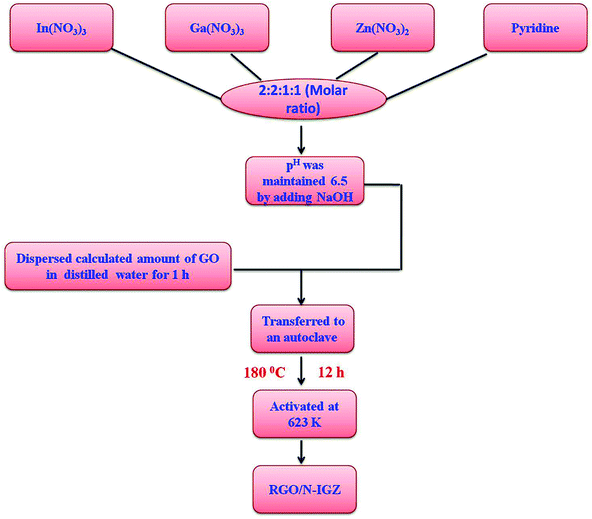
In a typical experiment, pyridine was used as the nitrogen source for doping the metal oxide matrix. In brief, the calculated amounts of In(NO3)3, Ga(NO3)3, Zn(NO3)2 and pyridine were mixed in a molar ratio of 2![[thin space (1/6-em)]](https://www.rsc.org/images/entities/char_2009.gif) :
:![[thin space (1/6-em)]](https://www.rsc.org/images/entities/char_2009.gif) 2
2![[thin space (1/6-em)]](https://www.rsc.org/images/entities/char_2009.gif) :
:![[thin space (1/6-em)]](https://www.rsc.org/images/entities/char_2009.gif) 1
1![[thin space (1/6-em)]](https://www.rsc.org/images/entities/char_2009.gif) :
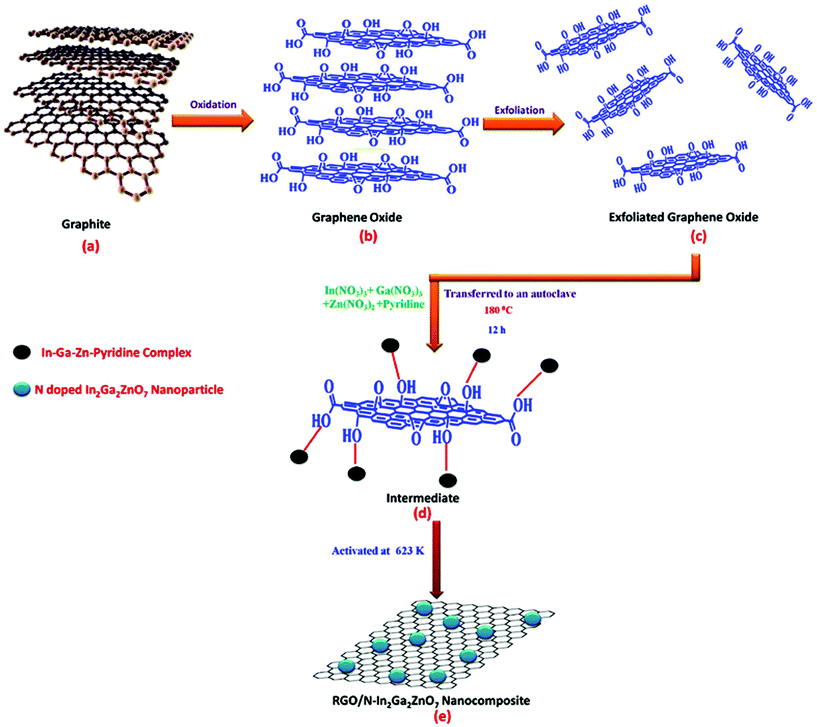
:![[thin space (1/6-em)]](https://www.rsc.org/images/entities/char_2009.gif) 1 and dissolved in 40 mL distilled water. The pH of the solution mixture was adjusted to 6.5 by adding NaOH solution. On the other hand, graphene oxide (GO) was prepared by the modified Hummers method.44 Then, a dispersed GO solution (the calculated amount of GO sonicated in 40 mL deionised water for 1 h) was mixed with the metal nitrate solution of which the pH had previously been adjusted and stirred for 1 h. The suspensions were subjected to hydrothermal treatment at 180 °C for 12 h. The obtained samples were centrifuged and washed several times with deionised water for the removal of undesired products. Lastly, the obtained products were dried at 80 °C for 24 h and activated at 623 K. The abovementioned synthesis procedure is shown in Scheme 1. The obtained final product was designated as RGO/N-IGZ. The as-synthesised RGO/N-IGZ nanocomposites with various amounts of GO, i.e. 1, 1.5, 2 and 2.5 wt%, added to the N-In2Ga2ZnO7 mixed oxide were designated as 1RGO/N-IGZ, 1.5RGO/N-IGZ, 2RGO/N-IGZ and 2.5RGO/N-IGZ, respectively.
1 and dissolved in 40 mL distilled water. The pH of the solution mixture was adjusted to 6.5 by adding NaOH solution. On the other hand, graphene oxide (GO) was prepared by the modified Hummers method.44 Then, a dispersed GO solution (the calculated amount of GO sonicated in 40 mL deionised water for 1 h) was mixed with the metal nitrate solution of which the pH had previously been adjusted and stirred for 1 h. The suspensions were subjected to hydrothermal treatment at 180 °C for 12 h. The obtained samples were centrifuged and washed several times with deionised water for the removal of undesired products. Lastly, the obtained products were dried at 80 °C for 24 h and activated at 623 K. The abovementioned synthesis procedure is shown in Scheme 1. The obtained final product was designated as RGO/N-IGZ. The as-synthesised RGO/N-IGZ nanocomposites with various amounts of GO, i.e. 1, 1.5, 2 and 2.5 wt%, added to the N-In2Ga2ZnO7 mixed oxide were designated as 1RGO/N-IGZ, 1.5RGO/N-IGZ, 2RGO/N-IGZ and 2.5RGO/N-IGZ, respectively.
2.3 Photocatalytic water splitting procedure
The photocatalytic water redox reaction was carried out in an inner irradiation-type reactor. For the water reduction and oxidation experiments, a 0.05 g synthesised powdered sample was suspended in 50 mL of a 10 volume% aqueous solution of CH3OH and a 0.05 M AgNO3 solution, respectively. The photocatalytic water redox reaction was carried out after evacuating the reactor several times by purging with nitrogen gas to remove air completely. In the addition procedure, settling of the powdered sample at the bottom of the reactor was avoided by stirring with a magnetic stirrer. A 125 W Hg visible lamp at medium pressure was used as the irradiation source. In the reactor, a water jacket containing a 1 mol L−1 NaNO2 solution acted as a cut-off filter to eliminate light with wavelengths of less than 400 nm. The water displacement technique was employed to collect the evolved gas, which was analyzed by a GC-17A apparatus.2.4 Analytical characterisation
The characterisation of the synthesized photocatalysts was performed using several analytical techniques such as PXRD, DRUV-vis, TEM, XPS, PL, TRPL, BET surface area analysis and photoelectrochemical measurements. X-ray diffraction patterns were recorded over the range of 10° < 2θ < 60° using Cu Kα radiation (λ = 1.54 Å) with a Rigaku MiniFlex (set at 30 kV and 15 mA) instrument. A Varian Cary 100 spectrophotometer was used to measure the optical absorbance properties of all the samples in the region of 400–800 nm. Transmission electron microscopy (TEM) and high-resolution transmission electron microscopy (HRTEM) images were recorded on a Philips Tecnai G2 instrument at an accelerating voltage of 200 kV. A VG Microtech Multilab ESCA 3000 spectrometer with a non-monochromatised Mg Kα X-ray source was used to record the X-ray photoelectron spectra (XPS) of the prepared photocatalysts and the obtained results were corrected by using the binding energy of the C 1s peak, i.e. 284.9 eV, as a reference. The photoluminescence (PL) spectra of all the prepared photocatalysts were recorded at room temperature at an excitation wavelength of 350 nm with an LS 55 fluorescence spectrometer (PerkinElmer). A time-correlated single-photon counting (TCSPC) spectrometer (Edinburgh, OB920) was used to measure the time-resolved photoluminescence decay of all the prepared photocatalysts. A three-electrode potentiostat (VersaSTAT 3, Princeton Applied Research) was used for photoelectrochemical measurements of all the samples, where Ag/AgCl and Pt were used as the reference and counter electrode, respectively.3. Results and discussion
3.1 Structural characterization
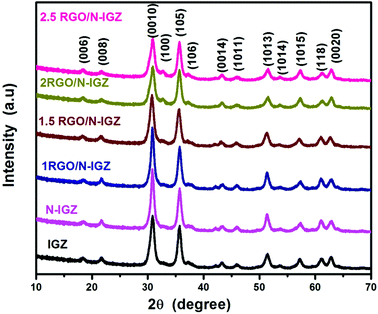
The structural identification and phase formation of neat In2Ga2ZnO7, N-doped In2Ga2ZnO7 and RGO-loaded In2Ga2ZnO7 were confirmed from their X-ray diffraction (PXRD) patterns. The XRD patterns of IGZ, N-IGZ and RGO/N-IGZ are shown in Fig. 1. As shown in Fig. 1, all the observed peaks in the XRD patterns are well matched with the characteristic reflections of the hexagonal phase of In2Ga2ZnO7 corresponding to JCPDS file no. 38-1097. The abovementioned XRD results confirm the successful synthesis of a highly pure crystalline phase of hexagonal In2Ga2ZnO7, even if in the presence of graphene. The XRD patterns also reveal that there were no impurities in the as-synthesized samples even after doping with nitrogen and the introduction of GO. In this addition process, the comparative broadening of all the reflection peaks indicates the formation of a nanomaterial. Furthermore, the successful assimilation of nitrogen (N) into the hexagonal crystal of In2Ga2ZnO7 did not disrupt the structure, although a N atom has a larger ionic radius of 0.171 nm than that of an oxygen (O) atom of 0.132 nm.29 The results of nitrogen analysis show that a very small amount of nitrogen, i.e. 0.18% (Table 1), was incorporated into IGZ, which might be insufficient for its structural transformation.29 The disappearance of the reflection peak of GO for all the synthesised nanocomposites may be due to its presence in very low amounts and also the disruption of its regular lamellar structure, which results in the formation of highly exfoliated GO sheets during hydrothermal synthesis.45,46 The TEM study also supports this evidence for the exfoliation of graphene sheets.| Catalyst | Binding energy (eV) | Average particle size (nm) | BET surface area (m2 g−1) | Nitrogen (%) | Ref. |
|---|---|---|---|---|---|
| IGZ | 2.50 | 17 ± 2 | 27 | 0 | 39 |
| 3RGO/IGZ | 2.46 | 14 ± 2 | 55 | ||
| N-IGZ | 2.34 | 13 ± 1 | 36 ± 1.3 | 0.18 | Present work |
| 2RGO/N-IGZ | 2.29 | 10 ± 1 | 67 ± 1.8 |
3.2 Optical properties and band gap
In order to determine the optical absorption characteristics of all the prepared samples, their diffuse reflectance spectra were recorded. The diffuse reflectance spectra in absorption mode of as-synthesized IGZ, N-IGZ and the RGO-based N-IGZ mixed oxides are displayed in Fig. 2(a). From the optical absorption spectra, it was observed that neat IGZ exhibited absorption at 500 nm, whereas this was observed for N-doped IGZ at 540 nm. The observed red shift is due to doping of IGZ with nitrogen and is very similar to that seen in our previous work.29 Furthermore, the observed slight red shift for all RGO-loaded N-doped IGZ samples could be attributed to the formation of a chemical bond between N-IGZ and specific carbon atoms of RGO sheets, whereas the higher optical absorption characteristics are due to the presence of black body characteristics in RGO sheets.47,48 The higher optical absorption characteristics of all graphene-loaded N-doped IGZ samples suggest the reduction of GO to RGO by hydrothermal treatment.43 The abovementioned observations confirm that RGO indirectly modifies the fundamental process of electron–hole pair formation in N-IGZ mixed oxide nanoparticles during a photochemical process by increasing their surface electric charge.40The band gap energy (Eg) of IGZ, N-IGZ and all the RGO-loaded N-IGZ photocatalysts was calculated by using the Schuster–Kubelka–Munk equation:39
| αhv = A(hv − Eg)n |
3.3 TEM
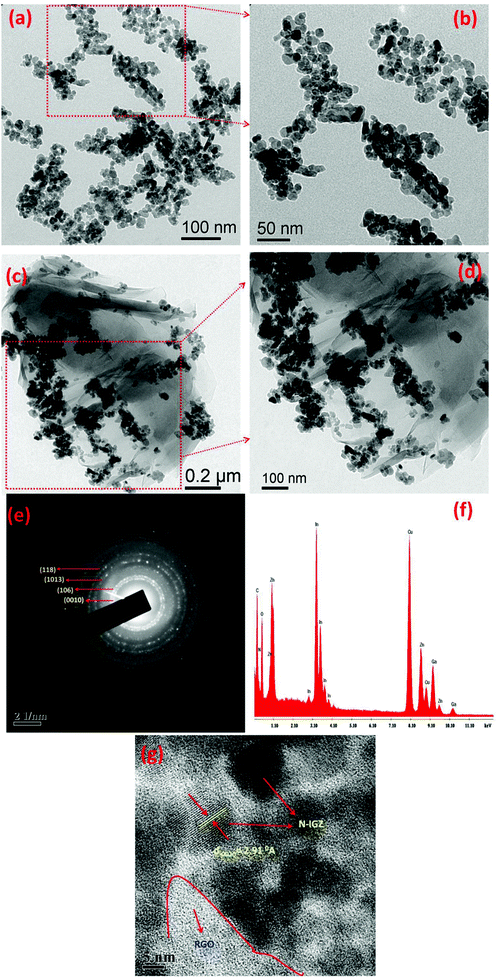
TEM analysis was carried out to determine the core structure of N-IGZ and 2RGO/N-IGZ nanoparticles. Fig. 3(a)–(d) show TEM images of N-IGZ and the 2RGO/N-IGZ nanocomposite. An irregular N-doped IGZ mixed oxide with an average particle size of 13 ± 1 nm can be clearly seen in Fig. 3(a) and (b). In Fig. 3(c) and (d), there can clearly be seen the firm anchoring of N-doped IGZ nanoparticles with an average particle size of 10 ± 1 nm on 2D RGO sheets with lengths of micrometers, which was successfully achieved after hydrothermal synthesis. Furthermore, the magnified TEM images of 2RGO/N-IGZ reveal that anchoring of N-IGZ mixed oxide nanoparticles increased the stability of individual graphene sheets.43 Thus, the chemical bonding interactions (electrostatic and van der Waals interactions) and intimate interfacial contact between N-IGZ nanoparticles and oxygen-containing moieties present on the surface of GO such as hydroxyl groups can be relevant and led to firm anchoring of N-IGZ nanoparticles on RGO sheets after hydrothermal treatment. Fig. 3(e) and (f) show the SAED and EDAX analysis of the 2RGO/N-IGZ nanocomposite, respectively. The SAED pattern of the 2RGO/N-IGZ nanocomposite shows the hexagonal phase of the N-IGZ mixed oxide, which well coincides with its XRD pattern. The several bright ring patterns confirm the polycrystalline nature of N-IGZ mixed oxide nanoparticles. The EDAX spectrum indicates the presence of C, N, O, In, Ga and Zn in the 2RGO/N-IGZ nanocomposite (Fig. 3(f)). An HRTEM image of the 2RGO/N-IGZ nanocomposite is shown in Fig. 3(g). The observed lattice spacing of 2.91 Å corresponds to the (0010) plane of the hexagonal N-IGZ mixed oxide. The SAED pattern and HRTEM image reveal the highly crystalline nature of the prepared 2RGO/N-IGZ mixed oxide nanocomposite, which is more advantageous for better photocatalytic activity.42In brief, the TEM analysis summarises the highly crystalline nature of the prepared 2RGO/N-IGZ mixed oxide nanocomposite, which has an interior structure with firm anchoring and good interfacial contact of N-IGZ nanoparticles with graphene sheets that favours an increase in the stability of individual graphene sheets, as well as better channeling of photoexcited electrons through the pi-conjugated network of graphene from the CB of N-IGZ. This results in effective e−/h+ separation and simultaneously increases the ability for the photocatalytic production of H2 of N-IGZ nanoparticles. Scheme 2 illustrates the formation mechanism of RGO/N-IGZ mixed oxide nanocomposites. GO was prepared by the reported modified Hummers method (Scheme 2(b)) and was further dispersed in distilled water for 1 h to obtain exfoliated GO sheets (Scheme 2(c)). All metal nitrate solutions together with pyridine as the nitrogen precursor were mixed in water and the pH was adjusted to 6.5 by adding NaOH solution. Then, the precipitation reaction took place and the formed metal hydroxides interacted with pyridine, resulting in the formation of a metal hydroxide–pyridine complex. The oxygen-containing functional groups interacted with the metal hydroxide–pyridine complex to form an intermediate state (Scheme 2(d)). Thus, IGZ species are supposed to be anchored on GO sheets via bonding with oxygen-containing species of GO (IGZ-O-GR). Furthermore, the intermediate sample was activated at 623 K to form graphene sheets decorated with N-doped IGZ nanoparticles (Scheme 2(e)).
3.4 XPS study
The elemental composition of the 2RGO/N-IGZ mixed oxide nanocomposite was investigated by an XPS study. The high resolution XPS survey scan of 2RGO/N-IGZ indicates the presence of C, N, O, In, Ga and Zn and is shown in Fig. 4. The reduction of GO to RGO was evidenced by the deconvolution of the high-resolution XPS spectrum of C 1s. As shown in the deconvolved high-resolution XPS scan of C 1s, binding energy values of 284.8 and 287.3 eV are assigned to sp2 carbon and oxygenated carbon species of RGO such as C–OH and C![[double bond, length as m-dash]](https://www.rsc.org/images/entities/char_e001.gif) O, respectively.42,43 Thus, the lower intensity of the XPS spectrum of C 1s in comparison with that reported for C 1s in GO clearly reveals that the amount of oxygenated functionalities in GO was significantly reduced in the case of 2RGO/N-IGZ.45,46 The N 1s peak observed at 397.3 eV is assigned to substitution by N in N-IGZ mixed oxide nanoparticles.43 Furthermore, deconvolution of the O 1s peak shows two individual peaks at 529.5 and 531.4 eV, which are due to lattice and surface oxygen, respectively.42 The individual XPS scan for Ga 3d showed a peak at 20.5 eV, which confirms the presence of Ga in the +3 oxidation state in 2RGO/N-IGZ.29 However, the individual XPS scan for In 3d showed two individual peaks at 444.7 eV and 452.3 eV, which are assigned to In 3d5/2 and In 3d3/2, respectively, and confirm the presence of In in the +3 oxidation state.42 The individual XPS scan for Zn 2p showed two individual symmetric peaks at 1021.4 eV and 1044.5 eV, which are assigned to Zn 2p3/2 and Zn 2p1/2, respectively, and confirm the presence of Zn in the +2 oxidation state.42
O, respectively.42,43 Thus, the lower intensity of the XPS spectrum of C 1s in comparison with that reported for C 1s in GO clearly reveals that the amount of oxygenated functionalities in GO was significantly reduced in the case of 2RGO/N-IGZ.45,46 The N 1s peak observed at 397.3 eV is assigned to substitution by N in N-IGZ mixed oxide nanoparticles.43 Furthermore, deconvolution of the O 1s peak shows two individual peaks at 529.5 and 531.4 eV, which are due to lattice and surface oxygen, respectively.42 The individual XPS scan for Ga 3d showed a peak at 20.5 eV, which confirms the presence of Ga in the +3 oxidation state in 2RGO/N-IGZ.29 However, the individual XPS scan for In 3d showed two individual peaks at 444.7 eV and 452.3 eV, which are assigned to In 3d5/2 and In 3d3/2, respectively, and confirm the presence of In in the +3 oxidation state.42 The individual XPS scan for Zn 2p showed two individual symmetric peaks at 1021.4 eV and 1044.5 eV, which are assigned to Zn 2p3/2 and Zn 2p1/2, respectively, and confirm the presence of Zn in the +2 oxidation state.42
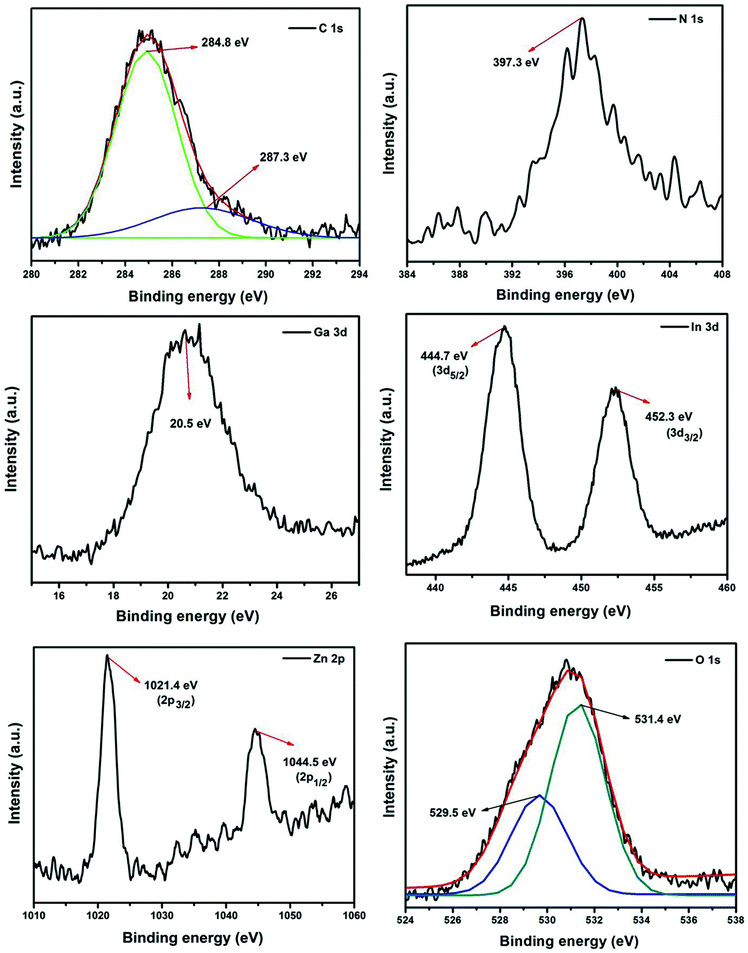 | ||
| Fig. 4 High resolution XPS spectra of N 1s, C 1s, Ga 3d, In 3d, Zn 2p and O 1s of 2RGO-N-IGZ nanocomposite. | ||
3.5 Photoluminescence (PL) analysis
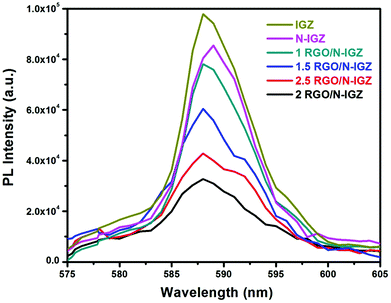
To examine the phenomena of the photoinduced charge migration, transfer and recombination processes, the photoluminescence (PL) spectra of all the prepared photocatalysts were recorded and are presented in Fig. 5. In this present investigation, the PL intensity of all the prepared samples was observed to be in the following order, i.e. IGZ > N-IGZ > 1RGO/N-IGZ > 1.5RGO/N-IGZ > 2.5RGO/N-IGZ > 2RGO/N-IGZ. In this case, the 2RGO/N-IGZ mixed oxide exhibited the lowest PL intensity in comparison with all the other synthesised photocatalysts, which indicates the effective separation of photoexcited electrons and holes owing to the successful transfer of excited electrons through the interface.49 This means that an appropriate amount of graphene loaded on N-IGZ nanoparticles acts as an additional pathway for the removal of charge carriers, which leads to longer e−/h+ pair lifetimes and facilitates the better transportation of excited electrons from the CB of N-IGZ nanoparticles to graphene sheets. Thus, the presence of graphene gives rise to the fast transfer of photoexcited e− from N-IGZ nanoparticles to its 2D surface, which leads to quenching of photoemission and simultaneously increases the photocatalytic activity. Hence, among all the prepared photocatalysts, 2RGO/N-IGZ displayed the highest ability for the photocatalytic production of H2 under visible-light irradiation.3.6 Time-resolved photoluminescence (TRPL) analysis
In order to reveal the characteristics of the transfer dynamics of photoexcited electrons (e−), decay components were calculated from time-resolved photoluminescence (TRPL) measurements of all the prepared photocatalysts and are illustrated in Fig. 6. The well-fitted decay dynamics for IGZ, N-IGZ, 1RGO/N-IGZ, 1.5RGO/N-IGZ, 2RGO/N-IGZ and 2.5RGO/N-IGZ are given in Table 2. From Table 2, N-IGZ displayed a longer decay time in comparison with that of neat IGZ, which demonstrates a delay in the recombination of e− and h+ owing to the presence of N in IGZ mixed oxide nanoparticles. Furthermore, the value of the decay time increased up to a loading of 2 wt% and then decreased at a loading of 2.5 wt% of RGO in the N-IGZ nanocomposite. The longer decay time of the 2RGO/N-IGZ nanocomposite in comparison with that of all the other prepared samples was due to effective charge relocation across the interface of graphene with N-IGZ nanoparticles.50 Moreover, an increase in decay time (τ1, τ2 and τ3) also implies a gradual decrease in the density of trapped states in the following order, i.e. IGZ > N-IGZ > 1RGO/N-IGZ > 1.5RGO/N-IGZ > 2.5RGO/N-IGZ > 2RGO/N-IGZ. The lower density of trapped states and longer average decay time (<τ2>) of the 2RGO/N-IGZ nanocomposite than those of neat N-IGZ signifies that 2D graphene sheets facilitated charge separation by extracting photoexcited electrons to its pi-conjugated carbon network from the CB of N-IGZ, which resulted in an increase in activity in the photocatalytic production of H2 for the 2RGO/N-IGZ nanocomposite.42,43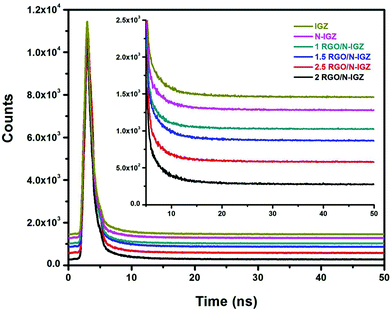 | ||
| Fig. 6 Time-resolved photoluminescence spectra of IGZ, N-IGZ, and all RGO-loaded N-IGZ mixed oxide nanocomposites. | ||
| Sample name | Decay time (ns) | Fractional contribution | Goodness-of-fit parameter (χ2) | |||||
|---|---|---|---|---|---|---|---|---|
| τ 1 | τ 2 | τ 3 | <τ> | f 1 | f 2 | f 3 | ||
| IGZ | 0.3 | 3.35 | 6.01 | 1.58 | 0.257 | 0.31 | 0.433 | 1.176 |
| N-IGZ | 0.71 | 3.32 | 11.52 | 2.11 | 0.241 | 0.293 | 0.466 | 1.213 |
| 1RGO/N-IGZ | 0.75 | 3.2 | 12.88 | 2.48 | 0.187 | 0.305 | 0.508 | 1.135 |
| 1.5 RGO/N-IGZ | 0.76 | 3.42 | 18.0 | 4.03 | 0.21 | 0.196 | 0.594 | 1.102 |
| 2RGO/N-IGZ | 0.76 | 3.61 | 33.8 | 7.11 | 0.194 | 0.278 | 0.528 | 1.076 |
| 2.5RGO/N-IGZ | 0.75 | 3.59 | 18.64 | 4.54 | 0.243 | 0.319 | 0.438 | 1.183 |
3.7 Photoelectrochemical (PEC) study
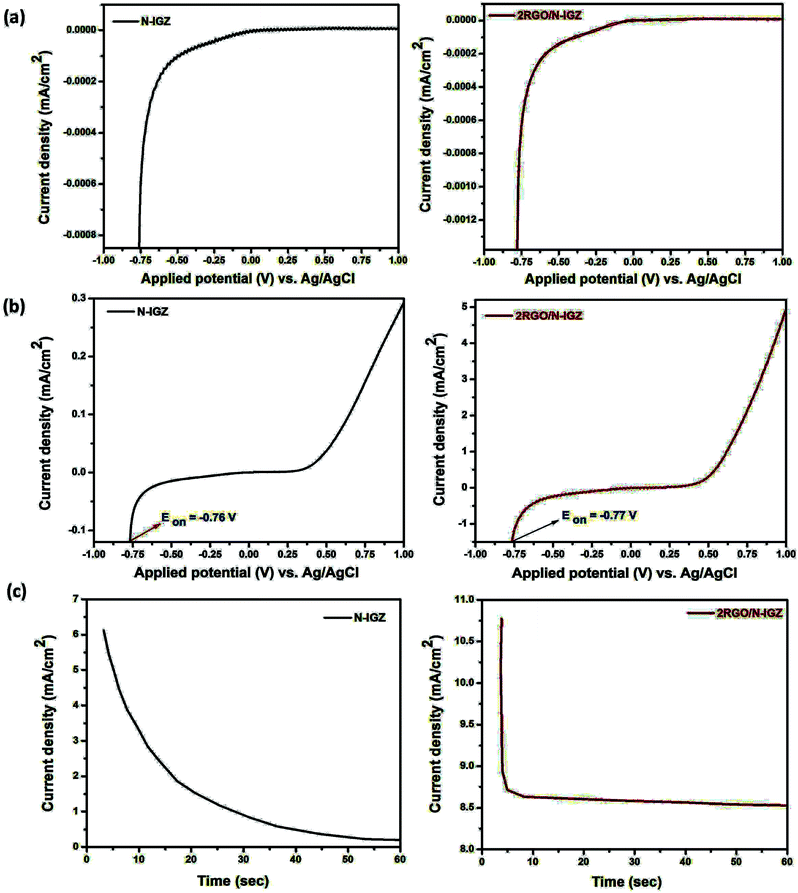
Photoelectrochemical (PEC) measurements were performed to determine the relative positions of the band edge and factors affecting the generation of excited electron–hole pairs in the N-IGZ and 2RGO/N-IGZ photocatalysts. Fig. 7(a) and (b) show the photocurrent spectra of the N-IGZ and 2RGO/N-IGZ photocatalysts in the dark and light, respectively. Furthermore, for better confirmation the photocurrent spectra of 1RGO/N-IGZ, 1.5RGO/N-IGZ and 2.5RGO/N-IGZ are shown in the ESI (Fig. S1†). From the results for the photocurrent spectra, no current was generated by either prepared electrode (N-IGZ or 2RGO/N-IGZ) under dark conditions, whereas under illumination by light (λ ≥ 400 nm) N-IGZ and 2RGO/N-IGZ exhibited photocurrent densities of 0.21 mA cm−2 and 8.79 mA cm−2, respectively. Both N-IGZ and 2RGO/N-IGZ displayed characteristics of the generation of anodic photocurrent, which increased with an increase in applied potential. This means that both N-IGZ and 2RGO/N-IGZ exhibited n-type semiconducting properties.43 The photocurrent density of 2RGO/N-IGZ appeared to be nearly 42 times higher than that of neat N-IGZ and was also nearly 2.5 times higher than that of our previously reported 3RGO/IGZ photocatalysts.42 This significant increase in photocurrent density for 2RGO/N-IGZ indicates that more free e− were successfully transferred in the circuit in the case of the 2RGO/N-IGZ photoelectrode in comparison with the neat N-IGZ photoelectrode. This shows that the firm anchoring of N-IGZ nanoparticles on graphene sheets facilitates the better separation of photoexcited charge, as graphene possesses outstanding electron mobility and can efficiently transport electrons through its pi-conjugated carbon network.39–43The CB edges of both N-IGZ and 2RGO/N-IGZ photocatalysts were calculated from their flat band potentials, which were assumed to be their photocurrent onset potentials.42 The photocurrent onset potentials of the N-IGZ and 2RGO/N-IGZ photoelectrodes were observed at −0.76 and −0.77 V vs. Ag/AgCl at a pH of 6, respectively. According to the positions of the CB edges, the VB maxima were calculated to be 1.74 and 1.52 eV, as the Eg values of N-IGZ and 2RGO/N-IGZ are 2.5 and 2.29 eV, respectively.43 At a pH of 6, the reduction potential of H+ lies at −0.55 V. From the PEC study, it was observed that both the CB and VB edges of the N-IGZ and 2RGO/N-IGZ photocatalysts are more negative than the reduction potential of H+. Hence, both N-IGZ and 2RGO/N-IGZ photocatalysts satisfy the thermodynamic requirements for the evolution of H2 from water. The N-IGZ and 2RGO/N-IGZ photocatalysts displayed higher valence band edge potentials than the oxidation potential of water, i.e. +0.68 V vs. Ag/AgCl at a pH of 6. Thus, the prepared photocatalysts are also suitable for the evolution of O2 from water. The PEC study confirmed that the as-synthesised N-IGZ and graphene-based N-IGZ photocatalysts could be useful for both water oxidation and reduction reactions.
Under continuous irradiation by light, the stability of both N-IGZ and 2RGO/N-IGZ photoelectrodes at a potential of 0.8 V vs. Ag/AgCl was measured for one minute and is shown in Fig. 7(c). From the above, it was observed that 2RGO/N-IGZ exhibited stable generation of photocurrent over time, whereas an exponential decrease in photocurrent generation was observed for the N-IGZ photoelectrode. Thus, the 2RGO/N-IGZ photoelectrode displayed much higher stability in comparison with the neat N-IGZ photoelectrode. This enhanced photostability of the 2RGO/N-IGZ nanocomposite is attributed to the strong interaction of N-IGZ with graphene sheets. In brief, the PEC study provides strong evidence for the enhanced photocatalytic activity of the 2RGO/N-IGZ nanocomposite in terms of higher photocurrent density and greater photostability in comparison with neat N-IGZ photocatalysts.
3.8 Photocatalytic activity
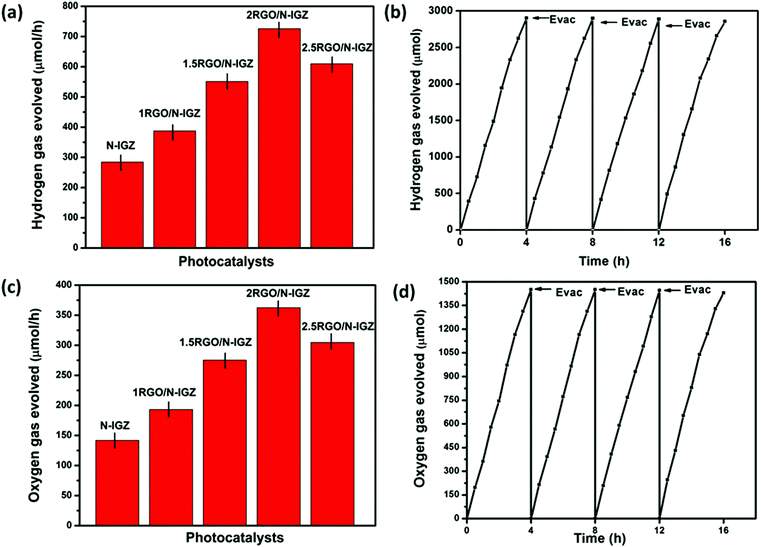
The photocatalytic activities for the production of H2 over N-IGZ and 2RGO-IGZ in an aqueous solution of methanol are shown in Fig. 8(a). No appreciable evolution of H2 was observed in the absence of either irradiation or photocatalysts. The optical absorption study confirmed that both N-IGZ and 2RGO-IGZ were active under visible-light irradiation. Moreover, the PEC measurements also revealed that both N-IGZ and 2RGO/N-IGZ are suitable for the water reduction reaction. In this work, the 2RGO/N-IGZ photocatalyst displayed the evolution of the highest amount of H2 gas, i.e. 726 μmol h−1, among all the other prepared photocatalysts under visible light. This result is quite interesting, because in our previous work In2Ga2ZnO7 loaded with 3 wt% graphene (3RGO/IGZ) yielded 435.4 μmol h−1 H2 under the same conditions.42 Moreover, neat N-IGZ nanoparticles displayed the evolution of 284.3 μmol h−1 H2 gas under visible light, which is more than with our previously reported IGZ photocatalysts (i.e. 110 μmol h−1).39 In this work, activity in the production of H2 increased markedly up to a loading of RGO of 2 wt% and then decreased at a loading of 2.5 wt%. The 1RGO/N-IGZ, 1.5RGO/N-IGZ and 2.5RGO/N-IGZ photocatalysts were able to evolve H2 gas at rates of 387.6 μmol h−1, 551 μmol h−1 and 609.8 μmol h−1, respectively. Fig. 8(b) shows the time course of the evolution of H2 over 2RGO/N-IGZ. The graph shows that the 2RGO/N-IGZ photocatalyst could retain its activity for up to 16 h and was able to evolve H2 gas at a rate of 726 μmol h−1. The apparent conversion efficiency of the 2RGO/N-IGZ photocatalyst is given as follows:In this present investigation, both nitrogen and an appropriate graphene content played a vital role in increasing the photocatalytic H2-producing ability of the IGZ mixed oxide. This is why the 2RGO/N-IGZ photocatalyst displayed the production of the highest amount of H2. Here, graphene extracted photoexcited electrons from the CB of the N-IGZ mixed oxide and channeled them through its sp2-hybridised carbon network, which resulted in a delay in the recombination of photoexcited electrons and holes.40 Hence, an appropriate loading of graphene greatly affected the H2-producing activity of the N-IGZ mixed oxide.
The PEC study also confirmed that all the prepared photocatalysts are thermodynamically suitable for the water oxidation reaction. The water oxidation reaction was carried out by taking 50 mL of 0.05 M AgNO3 solution and 0.05 g of a prepared photocatalyst. Fig. 8(c) illustrates the photocatalytic evolution of oxygen (O2) over the as-synthesised photocatalysts. From the graph, it was observed that the 2RGO/N-IGZ photocatalyst provided the highest result (362.4 μmol h−1) in the evolution of O2, whereas N-IGZ, 1RGO/N-IGZ, 1.5RGO/N-IGZ, and 2.5RGO/N-IGZ were able to evolve 141.9 μmol h−1, 193.2 μmol h−1, 275.3 μmol h−1 and 304.7 μmol h−1 of O2 gas, respectively, under visible-light irradiation. The evolution of O2 followed the same trend as that of activity in the evolution of H2. The time course in the study of the evolution of O2 over 2RGO/N-IGZ is shown in Fig. 8(d). From the graph of the evolution of O2, it can clearly be seen that the 2RGO/N-IGZ photocatalyst could retain its O2 gas-producing activity with a rate of 362.4 μmol h−1 for up to 16 h. The stoichiometric ratio for the evolution of H2 and O2 gas was found to be ∼2![[thin space (1/6-em)]](https://www.rsc.org/images/entities/char_2009.gif) :
:![[thin space (1/6-em)]](https://www.rsc.org/images/entities/char_2009.gif) 1. As was discussed earlier, photoexcited electrons from the CB of N-IGZ nanoparticles are easily transferred to the pi-conjugated network of graphene sheets and are channeled for availability in photochemical reactions.
1. As was discussed earlier, photoexcited electrons from the CB of N-IGZ nanoparticles are easily transferred to the pi-conjugated network of graphene sheets and are channeled for availability in photochemical reactions.
3.9 Mechanism of production of H2 over 2RGO/N-IGZ
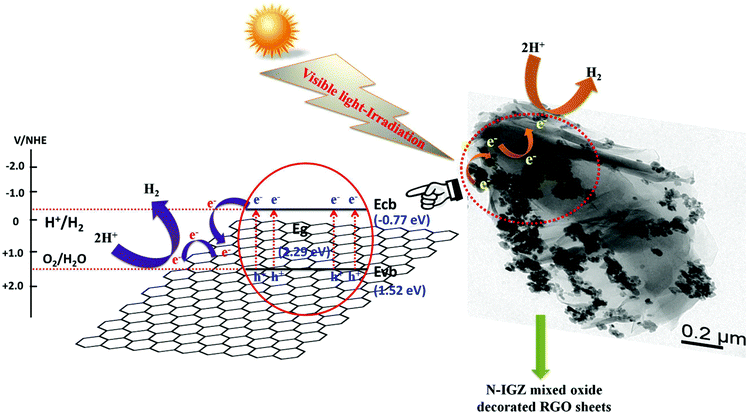
Taking into account all the results obtained from optical absorption properties, photoelectrochemical measurements, and PL and TRPL analysis, the proposed mechanism of the enhanced production of H2 is illustrated in Scheme 3.From the analysis of optical absorption, the Eg value of the prepared 2RGO/N-IGZ mixed oxide nanocomposite was found to be 2.29 eV, which confirmed its light absorption properties in the visible-light region. Furthermore, from photoelectrochemical measurements the positions of both the CB and VB edges were calculated to be −0.77 eV and 1.52 eV, respectively. This shows that the 2RGO/N-IGZ mixed oxide nanocomposite is suitable for the production of both H2 and O2 from water, as its CB edge is more negative than the reduction potential of H+ and its valence band edge potential is greater than the oxidation potential of water vs. Ag/AgCl at a pH of 6. The low PL intensity, longer average decay time, large BET surface area, and high photocurrent and photostability of 2RGO/N-IGZ in comparison with those of all the other prepared photocatalysts confirm that an appropriate amount of graphene led to the successful reduction of the recombination of photogenerated electron–hole pairs. This means that good intimate interfacial contact between N-IGZ nanoparticles and graphene led to the rapid transfer of photoexcited electrons from the CB of N-IGZ nanoparticles to the sp2-hybridised carbon network of graphene sheets, which were channeled on their surface, which was evidenced by its high generation of photocurrent in comparison with that of all the other prepared photocatalysts.
In brief, under visible-light illumination the introduction of an appropriate amount of graphene into N-IGZ mixed oxide nanoparticles possesses the synergetic effect of: (1) an enhanced light-harvesting capacity of N-IGZ nanoparticles owing to the effective incorporation of 2D layered graphene sheets; (2) intimate contact of N-IGZ nanoparticles with graphene, which facilitates better charge separation owing to the unique charge carrier properties of graphene; and (3) an increase in the BET surface area owing to the crystal growth-inhibiting effect of N-IGZ nanoparticles, which favours better separation of photoexcited electron–hole pairs. Moreover, graphene possesses outstanding photocorrosion inhibition efficiency and also a large amount of potential to extract photoexcited electrons into its pi-conjugated carbon network for better utilisation in the water reduction reaction to produce H2. Hence, in this case the water reduction reaction occurs at the graphene surface and results in the production of the highest amount of H2 in comparison with all the other prepared photocatalysts.
4. Conclusions
A new series of graphene-based N-IGZ mixed oxide nanocomposites have been fabricated by a novel one-pot in situ hydrothermal route and tested for increased evolution of H2 under visible-light irradiation. The appropriate loading amount of graphene in N-IGZ nanoparticles strongly affects their H2-producing ability. Among all the prepared materials, a loading of graphene of 2 wt% in N-IGZ nanoparticles demonstrates the ability to produce a considerable amount of H2 under visible-light irradiation, i.e. 726 μmol h−1. This result is quite impressive in comparison with our previous work on RGO/InGaZn and RGO/N-GZ mixed oxide nanocomposites. Furthermore, the higher H2-producting ability of the 2RGO/N-IGZ nanocomposite in comparison with that of neat N-IGZ nanoparticles can be explained on the basis of the results obtained from the low PL intensity, longer decay time (the values of <τ> for N-IGZ and 2RGO/N-IGZ are 2.11 and 7.11 ns, respectively) from the TRPL study, high photocurrent generation (42 times higher than that of N-IGZ), large surface area and co-catalytic behaviour of graphene. Graphene acts as a supporting matrix for firmly anchoring the N-IGZ mixed oxide nanoparticles and also possesses a large amount of potential for enhancing the transfer of photoexcited electrons and suppressing e−/h+ recombination. Finally, a nanocomposite consisting of graphene and nitrogen-containing In2Ga2ZnO7 is an emerging material in the fields of energy, environment and fuel cell applications.Acknowledgements
The authors are grateful to Prof. B. K. Mishra, Director, CSIR-IMMT for all support in publishing the work and are also very thankful to Dr Y. S. Chaudhary and K. K. Nanda for the TRPL analysis. One of the authors, Mr D. K. Padhi, is very thankful to CSIR-New Delhi, India for awarding him a SRF.References
- D. M. Schultz and T. P. Yoon, Science, 2014, 343, 1239176 CrossRef PubMed.
- A. Fujishima and K. Honda, Nature, 1972, 238, 37 CrossRef CAS PubMed.
- T. Ohno, Lu. Bai, T. Hisatomi, K. Maeda and K. Domen, J. Am. Chem. Soc., 2012, 134, 8254–8259 CrossRef CAS PubMed.
- W. K. Jo and T. S. Natarajan, ACS Appl. Mater. Interfaces, 2015, 7, 17138–17154 CAS.
- M. Higashi, K. Domen and R. Abe, J. Am. Chem. Soc., 2012, 134, 6968–6971 CrossRef CAS PubMed.
- Y. Wu and G. Ceder, J. Phys. Chem. C, 2013, 117, 24710–24715 CAS.
- M. Yashima, Y. Lee and K. Domen, Chem. Mater., 2007, 19, 588–593 CrossRef CAS.
- J. H. Bang, J. H. Richard and K. S. Suslick, Adv. Mater., 2008, 20, 2599–2603 CrossRef CAS.
- P. Benjwal and K. K. Kar, RSC Adv., 2015, 5, 98166–98176 RSC.
- J. H. Park, S. Kim and A. J. Bard, Nano Lett., 2006, 6, 24 CrossRef CAS PubMed.
- K. Maeda and K. Domen, J. Phys. Chem. C, 2007, 111(22), 7851–7861 CAS.
- A. Bhirud, S. Sathaye, R. Waichal, C. J. Park and B. Kale, J. Mater. Chem. A, 2015, 3, 17050–17063 CAS.
- B. Banerjee, V. Amoli, A. Maurya, A. K. Sinha and A. Bhaumik, Nanoscale, 2015, 7, 10504–10512 RSC.
- S. Zhang, C. Chang, Z. Huang, Y. Ma, W. Gao, J. Li and Y. Qu, ACS Catal., 2015, 5, 6481–6488 CrossRef CAS.
- R. Reichert, Z. Jusys and R. J. Behm, J. Phys. Chem. C, 2015, 119, 24750–24759 CAS.
- J. Xiong, Z. Li, J. Chen, S. Zhang, L. Wang and S. Dou, ACS Appl. Mater. Interfaces, 2014, 6, 15716–15725 CAS.
- K. I. Liu, C. Y. Su and T. P. Perng, RSC Adv., 2015, 5, 88367–88374 RSC.
- T. M. Suzuki, T. Nakamura, S. Saeki, Y. Matsuoka, H. Tanaka, K. Yano, T. Kajino and T. Morikawa, J. Mater. Chem., 2012, 22, 24584–24590 RSC.
- K. Maeda, K. Taramura, D. L. Lu, N. Saito, Y. Inoue and K. Domen, Angew. Chem., Int. Ed., 2006, 45, 7806 CrossRef CAS PubMed.
- J. Sato, N. Saito, Y. Yamada, K. Maeda, T. Takata, J. N. Kondo, M. Hara, H. Kobayashi, K. Domen and Y. Inoue, J. Am. Chem. Soc., 2005, 127, 4150 CrossRef CAS PubMed.
- K. R. Reyes-Gil, E. A. Reyes-García and D. Raftery, J. Phys. Chem. C, 2007, 111, 14579–14588 CAS.
- G. Hitoki, T. Takata, J. N. Kondo, M. Hara, H. Kobayashi and K. Domen, Chem. Commun., 2002, 16, 1698 RSC.
- S. Chen, J. Yang, C. Ding, R. Li, S. Jin, D. Wang, H. Han, F. Zhang and C. Li, J. Mater. Chem. A, 2013, 1, 5651–5659 CAS.
- J. Seo, T. Takata, M. Nakabayashi, T. Hisatomi, N. Shibata, T. Minegishi and K. Domen, J. Am. Chem. Soc., 2015, 137, 12780–12783 CrossRef CAS PubMed.
- J. Graciani, L. J. Alvarez, J. A. Rodriguez and J. F. Sanz, J. Phys. Chem. C, 2008, 112, 2624–2631 CAS.
- M. Batzill, E. H. Morales and U. Diebold, Phys. Rev. Lett., 2006, 96, 026103 CrossRef PubMed.
- N. Arai, N. Saito, H. Nishiyama, Y. Shimodaira, H. Kobayashi, Y. Inoue and K. Sato, J. Phys. Chem. C, 2008, 112, 5000–5005 CAS.
- S. Martha, K. H. Reddy, N. Biswal and K. M. Parida, Dalton Trans., 2012, 41, 14107–14116 RSC.
- S. Martha and K. M. Parida, Int. J. Hydrogen Energy, 2012, 37, 17936–17946 CrossRef CAS.
- K. M. Parida, S. Martha, D. P. Das and N. Biswal, J. Mater. Chem., 2010, 20, 7144–7149 RSC.
- S. Martha, K. H. Reddy, K. M. Parida and P. K. Satapathy, Int. J. Hydrogen Energy, 2012, 37, 115–124 CrossRef CAS.
- J. Sato, N. Saito, Y. Yamada, K. Maeda, T. Takata, J. N. Kondo, M. Hara, H. Kobayashi, K. Domen and Y. Inoue, J. Am. Chem. Soc., 2005, 127, 4150–4151 CrossRef CAS PubMed.
- K. Maeda, T. Takata, M. Hara, N. Saito, Y. Inoue, H. Kobayashi and K. Domen, J. Am. Chem. Soc., 2005, 127, 8286–8287 CrossRef CAS PubMed.
- K. Maeda, K. Teramura, T. Takata, M. Hara, N. Saito, K. Toda, Y. Inoue, H. Kobayashi and K. Domen, J. Phys. Chem. B, 2005, 109, 20504 CrossRef CAS PubMed.
- C. C. Hu, Y. L. Lee and H. Teng, J. Phys. Chem. C, 2011, 115, 2805 CAS.
- A. Mukherji, B. Seger, G. Q. Lu and L. Wang, ACS Nano, 2011, 5, 3483–3492 CrossRef CAS PubMed.
- A. K. Geim and K. S. Novoselov, Nat. Mater., 2007, 6, 183–191 CrossRef CAS PubMed.
- N. Zhang, M. Q. Yang, S. Liu, Y. Sun and Y. J. Xu, Chem. Rev., 2015, 115, 10307–10377 CrossRef CAS PubMed.
- G. K. Pradhan, D. K. Padhi and K. M. Parida, ACS Appl. Mater. Interfaces, 2013, 5, 9101–9110 CAS.
- D. K. Padhi and K. Parida, J. Mater. Chem. A, 2014, 2, 10300–10312 CAS.
- D. K. Padhi, G. K. Pradhan, K. M. Parida and S. K. Singh, Chem. Eng. J., 2014, 255, 78–88 CrossRef CAS.
- S. Martha, D. K. Padhi and K. M. Parida, ChemSusChem, 2014, 7, 585–597 CrossRef CAS PubMed.
- D. K. Padhi, K. M. Parida and S. K. Singh, J. Phys. Chem. C, 2015, 119, 6634–6646 CAS.
- W. S. Hummers and R. E. Offeman, J. Am. Chem. Soc., 1958, 80, 1339–1339 CrossRef CAS.
- X. Liu, L. Pan, T. Lv, T. Lu, G. Zhu, Z. Sun and C. Sun, Catal. Sci. Technol., 2011, 1, 1189–1193 CAS.
- Y. L. Chen, Z. A. Hu, Y. Q. Chang, H. W. Wang, Z. Y. Zhang, Y. Y. Yang and H. Y. Wu, J. Phys. Chem. C, 2011, 115, 2563–2571 CAS.
- Y. Zhang, Z. R. Tang, X. Fu and Y. J. Xu, ACS Nano, 2010, 4, 7303–7314 CrossRef CAS PubMed.
- Y. Hou, F. Zuo, A. Dagg and P. Feng, Nano Lett., 2012, 12, 6464–6473 CrossRef CAS PubMed.
- M. S. A. S. Shah, K. Zhang, A. R. Park, K. S. Kim, N. G. Park, J. H. Parkab and P. J. Yoo, Nanoscale, 2013, 5, 5093–5101 RSC.
- K. K. Nanda, S. Swain, B. Satpati, L. Besra and Y. S. Chaudhary, RSC Adv., 2014, 4, 10928–10934 RSC.
Footnote |
| † Electronic supplementary information (ESI) available. See DOI: 10.1039/c6qi00335d |
| This journal is © the Partner Organisations 2016 |

