Detection of nitroaromatic explosives using π-electron rich luminescent polymeric nanocomposites†
Priyanka Dutta,
Sudesna Chakravarty and
Neelotpal Sen Sarma*
Advanced Materials Laboratory, Physical Sciences Division, Institute of Advanced Study in Science and Technology, Guwahati-781035, India. E-mail: neelot@iasst.gov.in
First published on 22nd December 2015
Abstract
Sensitive detection of trace amounts of explosives is significantly imperative in the present scientific world due to security concerns and environmental pollution problems. In this endeavour, carbon and silver nanoparticle impregnated graft polymers of poly(vinylalcohol) and polythiophene are synthesized via a single step free radical polymerization reaction for sensing nitroaromatic compounds via fluorescence measurements. The key role of the conducting nanoparticles is to enhance the π-electron density of the luminescent polymer. These electron rich nanocomposites are successfully utilized for highly selective and ultrasensitive detection of electron deficient nitroaromatic explosives based on a fluorescence quenching method. Quenching efficiencies of the carbon and silver nanocomposites for highly electron deficient picric acid (PA) and 2,4,6-trinitrotoluene (TNT) are found to be 99% and 95% respectively. Mechanistic studies have been further explored in detail and it is observed that in most of the analytes including picric acid, a combination of excited state Forster Resonance Energy Transfer (FRET) and Photoinduced Electron Transfer (PET) leads to quenching of fluorescence. On the other hand, in analytes such as 2,4,6-trinitrotoluene, 1,4-dinitrobenzene and nitrobenzene excited state PET is the only reason behind fluorescence quenching. The detection limits of the carbon and silver nanocomposites are found to be in the nM level. Easy synthesis and scalable production of these materials in bulk quantities ensures their widespread future application in defence and industrial sectors for real time explosive detection.
Introduction
Development of highly sensitive sensory materials for the detection of trace amounts of explosives is one of the most imperative research domains in the present scientific context. Chemical sensors with high sensitivity and selectivity for the detection of principal explosive ingredients such as 1,3,5-trinitroperhydro-1,3,5-triazine (RDX), 2,4,6-trinitrotoluene (TNT) and 2,4,6-trinirophenol (picric acid) have found enormous applications in public security and environmental pollution problems.1,2 Furthermore, nitroaromatic compounds (NACs) are essential energetic materials used for the preparation of landmines.3,4 Nitroaromatic explosives left in the environment for years can deteriorate the environment by contaminating soil and water at toxic levels thus causing hazardous effects on humans and ecosystems.5,6 Among the highly dangerous nitroaromatic explosives are picric acid (PA) and TNT. Besides being a dangerous explosive, PA is highly toxic for human health and can cause kidney and liver damage, respiratory disorders and high dosage can even cause hemorrhagic nephritis and hepatitis.7 It is a strong skin and eye irritant and direct contact may even lead to corneal injury. Contaminated soil and groundwater can directly expose us to TNT and PA leading to adverse health effects. TNT is a human carcinogen, a strong skin and eye irritant, and can cause liver, blood, immune system and reproductive damage.8 As a result, researchers all across the globe are trying to develop highly efficient chemical sensors for the selective detection of nitroaromatic explosives.Different analytical techniques are available worldwide for the trace detection of explosive nitroaromatic compounds.9,10 Among the various techniques used for this purpose, fluorescence based chemosensors offers very high sensitivity, short response time and easy operation both in solid and liquid phase.11,12 Zhang et al. in 2011, reported the use of pyrene functionalized fluorescent molecule for the detection of NACs.13 Some of the most common fluorescence based sensing mechanisms are Photoinduced Electron Transfer (PET),14 Forster Resonance Energy Transfer (FRET),15 Ratiometric detection16 and Aggregation Induced Emission (AIE).17 Carbon nanotubes and dendrimers have also been reported as fluorescent based sensors for NACs.18,19 Different molecular interactions leading to fluorescence quenching are excited state resonance energy transfer, molecular rearrangements, ground state complex formation, excited state reactions etc. But, in most cases fluorescence quenching is achieved through short range electron transfer donor-acceptor mechanisms.20,21 Here, chemosensors are mainly electron rich species which act as electron donors, while the NACs behave as electron acceptors due to the presence of electron withdrawing nitro groups. Electron transfer occurs from the sensor (fluorophore) to the analyte upon photoexcitation which further leads to fluorescence quenching. Yang et al. in 2013, used poly(acrylic acid) films in designing a novel chemosensing device.22 Luminescent electron rich metal organic frameworks (MOFs) are also reported for nitroaromatic explosive sensing based on electron transfer donor–acceptor mechanism.23,24 FRET is another useful tool for the sensitive detection of nitroaromatic compounds.25 FRET is a radiationless excited state transfer of energy from the donor to the acceptor through long distance dipole–dipole interactions. FRET occurs when there is an efficient overlap between the emission band of the donor and the absorption band of the acceptor. Xia et al. in 2011, designed a FRET system based on Au nanorod and quantum dots for the turn on detection of TNT.26
Conjugated polymers are widely used as chemosensors because of their high stability and high ability to donate electrons.27,28 Moreover, the easy synthetic procedures, high sensitivity and much better mechanical properties of the conducting polymers make them immensely useful in device fabrication for explosive detection. Highly conjugated systems such as polythiophenes and polyaniline are also used in explosive sensing devices. Xu et al. in 2011, designed conjugated polymeric sensory systems for the selective and sensitive detection of TNT and PA in aqueous medium.29 Addition of nanoparticles to the polymer matrix increases their electron density which is even proved by the huge increase in electrical conducting properties.30,31 This leads to enhancement of electron donating capacity in such polymeric systems which further leads to enhanced fluorescence quenching.32,33 Such electron rich polymeric nanocomposites can be effectively used as efficient sensory systems for nitroaromatic explosives.
In this work, we have developed a series of electron rich polymeric nanocomposites for sensing nitroaromatic explosives such as TNT, PA etc. by photoluminescence methods. Poly(vinylalcohol)-g-polythiophene (PVA-g-PTh) composite and their nanocomposites were prepared by incorporating carbon and silver nanoparticles in it. Addition of conducting nanoparticles induces charge transfer from the nanoparticles to the polymer which makes the polymers electron rich species. The nanocomposites showed enhanced fluorescent behaviour after the loading of nanoparticles as compared to the undoped ones. The fluorescence of the polymers quenches to a large extent in presence of the electron deficient NACs. Detailed mechanistic study confirms the presence of a combined excited state electron transfer and energy transfer phenomenon.
Experimental
Materials
Poly(vinylalcohol) (PVA) (LOBA CHEMIE), thiophene (SPECTROCHEM), AIBN (SPECTROCHEM), DMSO (MERCK), carbon nanopowder (<50 nm, Sigma Aldrich), silver nanopowder (APS < 90 nm, SRL), 9,10-diphenylanthracene (Sigma Aldrich) were used without further purification. Picric acid (PA) was purchased from SIGMA and stored in 50% water for safety purpose. 3,5-Dinitrosalisylic acid (DNSA), 1,4-dinitrobenzene (DNB), nitrobenzene (NB), 2-nitrophenol (2-NP) and 4-nitrophenol (4-NP) were purchased from MERCK. 2,4,6-Trinitrotoluene (TNT) was provided by Forensic Laboratory, Guwahati, Assam and was then recrystallized with ethanol.Caution!
The nitroaromatic explosives must be carefully handled and must be used in small quantities. Picric acid is stored in 50% distilled water for storage purpose. The US OSHA (United States Occupational Safety and Health Administration) and US NIOSH (United States National Institute for Occupational Safety and Health) has set a permissible exposure limit of 0.1 mg m−3 picric acid for humans. The US EPA (United States Environmental protection Agency) has advised a permissible limit of 2 ppb TNT in drinking water.Methods
![[thin space (1/6-em)]](https://www.rsc.org/images/entities/char_2009.gif) :
:![[thin space (1/6-em)]](https://www.rsc.org/images/entities/char_2009.gif) 100 mixture of DMSO
100 mixture of DMSO![[thin space (1/6-em)]](https://www.rsc.org/images/entities/char_2009.gif) :
:![[thin space (1/6-em)]](https://www.rsc.org/images/entities/char_2009.gif) ethanol.
ethanol.10 μM (for Poly 1) and 1 μM (for Poly 2 and Poly 3) stock solution of the nitroaromatic compounds were initially prepared and then added in aliquots of 20, 40, 60…μl etc. to the cuvette containing 3 ml of the above prepared polymer solution. The PL quenching of the polymers on addition of aliquot of nitroaromatic compounds were then monitored.
 | (1) |
0.05% (w/w) of carbon nanopowder was dispersed in ethanol after proper sonication for about an hour. It was then added to the solution of PVA (2 g, DP = 1700–1800) in DMSO and stirred overnight. After that, thiophene (7 ml, 0.09 mol) along with AIBN (0.05 g) was added to the solution. Then the experiment was repeated in the above procedure to obtain 4.4 g of PVA-g-polythiophene/C nanocomposite gel which is designated as Poly 2.
The above procedure was adopted with 0.05% (w/w) silver nanopowder to obtain 4.5 g of PVA-g-polythiophene/Ag nanocomposite gel and is designated as Poly 3.
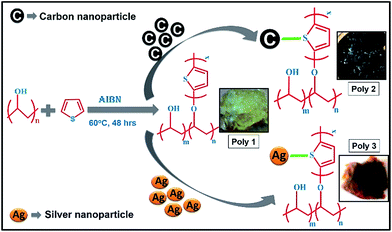
Schematic representation of the synthetic route of the polymers with their photographs is given in Scheme 1. The structures of the nitroaromatic explosive compounds used in this study are provided in the ESI in Chart 1.†
Results and discussions
FT-IR and 1H NMR studies
Fourier Transformed Infra-red (FT-IR) spectroscopy was performed for structural identification of the polymers. The FT-IR spectra is provided in ESI Fig. S1.† The FTIR spectrum of Poly 1 shows a broad peak at 3360 cm−1 due to the hydrogen bonded O–H band. The peak at 1331 cm−1 is due to C–O–C bending, while the peak at 1143 cm−1 is due to C–O stretching vibration. The peaks at 1630 and 1455 cm−1 are due to aromatic C![[double bond, length as m-dash]](https://www.rsc.org/images/entities/char_e001.gif) C stretch in the thiophene ring.1 The
C stretch in the thiophene ring.1 The ![[double bond, length as m-dash]](https://www.rsc.org/images/entities/char_e001.gif) C–H stretching vibration occurs at around 3005 cm−1, the peak for out-of-plane
C–H stretching vibration occurs at around 3005 cm−1, the peak for out-of-plane ![[double bond, length as m-dash]](https://www.rsc.org/images/entities/char_e001.gif) C–H bend is observed at 842 cm−1, while the peak for in plane
C–H bend is observed at 842 cm−1, while the peak for in plane ![[double bond, length as m-dash]](https://www.rsc.org/images/entities/char_e001.gif) C–H bending is observed at 1022 cm−1. The absorption band at 2921 cm−1 is assigned to –CH2 stretching of thiophene. The C–S stretching peak for thiophene occurs at about 954 cm−1. The FT-IR spectra of the Poly 2 and Poly 3 are almost similar to that of Poly 1. The only visible difference is that the peak at 954 cm−1 in Poly 1 due to the C–S stretch shifts to 936 cm−1 in Poly 2 and 935 cm−1 in Poly 3 indicating the possibility of some interactions between the nanoparticles and sulphur.
C–H bending is observed at 1022 cm−1. The absorption band at 2921 cm−1 is assigned to –CH2 stretching of thiophene. The C–S stretching peak for thiophene occurs at about 954 cm−1. The FT-IR spectra of the Poly 2 and Poly 3 are almost similar to that of Poly 1. The only visible difference is that the peak at 954 cm−1 in Poly 1 due to the C–S stretch shifts to 936 cm−1 in Poly 2 and 935 cm−1 in Poly 3 indicating the possibility of some interactions between the nanoparticles and sulphur.
The 1H NMR spectra (DMSO) of the parent polymer, Poly 1, at 400 MHz is provided in Fig. S2 in the ESI.† The 1H NMR (400 MHz, DMSO) spectra shows major peaks at 4.2–4.67 ppm (for –OH protons), 3.8 ppm (for –CH proton), 1.3–1.7 ppm (for the –CH2 protons in the main chain), 5.93 ppm and 5.6 ppm (for the two protons in the thiophene ring). The presence of only two peaks for the two protons attached to the thiophene ring confirms that grafting had taken place at the expected position.
PXRD and FESEM analysis
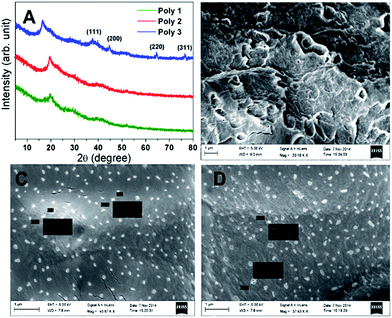
From the PXRD diffractograms (Fig. 1A) the presence of Ag nanoparticles in Poly 3 is confirmed. The 2 theta values at 37.9, 44.1, 64.3 and 76.9 correspond to (111), (200), (220) and (311) diffraction planes indicating the presence of Ag. The amorphous nature of carbon does not allow the formation of any new crystalline peak in Poly 2. Therefore, the PXRD diffractograms of the virgin polymer, Poly 1, and the carbon nanocomposite, Poly 2, are similar in appearance.The surface morphology of the polymers was studied with the help of scanning electron microscopy. FESEM images of the polymers had been provided in Fig. 1. The SEM images of the nanocomposites, Poly 2 and Poly 3 showed the presence of clusters of nanoparticles of size almost 150 nm. The surface morphology of the nanocomposites, Poly 2 and Poly 3 are almost similar. The SEM images clearly showed that the surface roughness of the nanocomposites decreases as compared to the virgin polymer, Poly 1. This is further verified with the help of AFM study. The percentage elemental composition of the polymers was determined with the help of EDX analysis and is provided in Fig. S3 in the ESI.† Repeated EDX measurements in different areas of the polymer gave similar results which confirms uniform elemental distribution throughout the polymer.
AFM study
The Surface microstructures of the polymers were studied intensely with the help of AFM study. The AFM images gave information about the surface roughness which is measured from the height of the peaks observed in the 3D images. From the 3D images it is observed that the heights of the pillars which describes the surface roughness decreases from about 500 nm in Poly 1 to 100–200 nm in case of the Poly 2 and Poly 3. This implies that the surface roughness of the polymer Poly 1 decreases to a large extent after the incorporation of nanoparticles in it. This is in agreement with the surface morphology study of the polymers from SEM. The 2D and 3D AFM images of the polymers are provided in Fig. S4 in the ESI.†Thermal properties: DSC and TGA thermograms
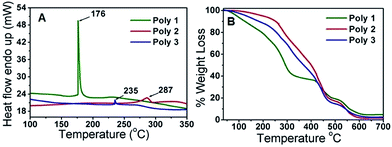
The DSC thermogram showed endothermic change taking place inside the polymers with increase in temperature. The melting points (Tm) are found to be 176 °C for Poly 1, 287 °C for Poly 2 and 235 °C for Poly 3 as given in Fig. 2A. The TGA spectra in Fig. 2B shows thermal stability up to about 150 °C with a weight loss of 13% for Poly 1, 2.2% for Poly 2 and 6.7% for Poly 3 and complete degradation occurs at around 600 °C. This clearly illustrates that thermal stability of these compounds increases heavily in the nanocomposites.UV-Vis and PL study
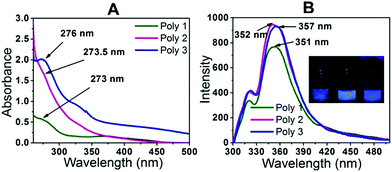
In the UV-Vis spectra as shown in Fig. 3A, maximum absorption is observed for Poly 1 at around 273 nm, Poly 2 at 273.5 nm and for Poly 3 at around 276 nm. The difference arises due to change in electronic properties of the polymers. Poly 2 being black in colour, absorbs most of the radiation and hence no proper absorption peak is observed in the UV spectrum. A slight hump is obtained at around 273.5 nm. In case of Poly 3, there may be charge transfer from the Ag nanoparticles to the polymer which enhances its electron density and hence there is a red shift in its λmax. The UV-Vis spectra of the dispersed carbon and silver nanoparticles in ethanol were also monitored and compared with their respective carbon and silver nanocomposites in Fig. S5 in the ESI.† From the figure it is observed that there is a blue shift in the λmax of the nanocomposites compared to the plain nanoparticle solutions. The PL spectra of the samples Poly 1, Poly 2 and Poly 3 in Fig. 3B at room temperature showed strong emission bands with λem at 351 nm, 352 nm and 357 nm respectively when excited at a wavelength of 270 nm. The incorporation of carbon and silver nanoparticles in the polymers further enhances their fluorescence intensities which increases in the order Poly 1 < Poly 2 < Poly 3. The PL quantum yield of the polymers were evaluated and found to be 15.64% for Poly 1, 23.3% for Poly 2 and 21.58% for Poly 3.Sensing of nitroaromatic compounds
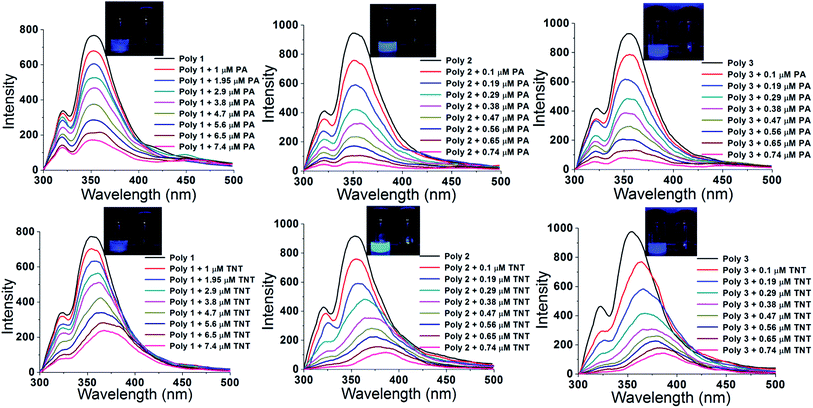
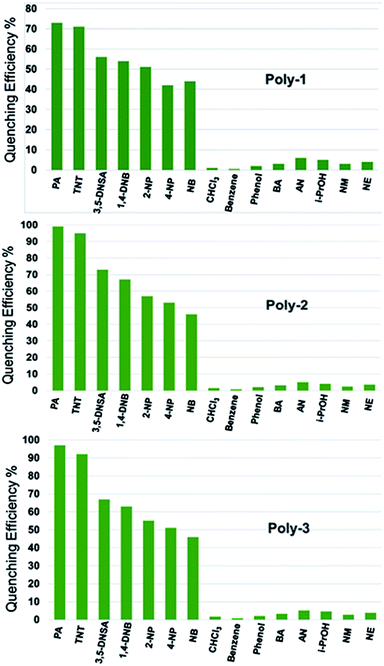
Graft polymers of PVA and thiophene are synthesized and then highly conducting carbon and silver nanoparticles were impregnated to enhance the electron density in the polymers for sensing electron deficient nitroaromatic explosives. The particle size of the nanoparticles were confirmed from DLS experiments (ESI, Fig. S6†). The electronegativity of sulphur in thiophene led to aggregation of the nanoparticles near the sulphur atom of the thiophene group. Silver has an electron configuration of [Kr] 4d10 5s1 because of which it can easily donate its 5s electron to attain Ag+ configuration. Again the electron configuration of carbon is [He] 2s2 2p2. Thus there occurs pi–pi interaction between the two unpaired electrons in the 2p orbitals of carbon and that in the 3p orbitals of sulphur. Thus the addition of carbon and silver nanoparticles increases the charge density of the polymer. Since there occurs Pi–Pi interaction between two electrons of carbon and sulphur, the charge transfer is stronger than that in the Ag nanocomposite (where Ag loses one electron to attain stable configuration). Thus the fluorescent intensity of the C nanocomposite (Poly 2) is slightly better than the Ag nanocomposite (Poly 3) as shown in Fig. 3B. The increase in surface charge is further established by the zeta potential value of the polymers. The incorporation of trace amount of electron deficient nitroaromatic compounds results in electron transfer from the electron rich polymer to the analytes forming a donor acceptor complex which results in fluorescence quenching. The ability of the synthesized polymers to sense NACs was tested by performing PL quenching titration experiments by gradual addition of 10 μM solutions (in case of Poly 1) and 1 μM solution (in case of Poly 2 and Poly 3) of different analytes to the polymer solutions prepared as discussed earlier. The change in the PL intensities of all the polymers upon titration with highly electron deficient PA and TNT are shown in Fig. 4 (results with other NACs are provided in the ESI, Fig. S7†). Moreover, the interference of some commonly used organic laboratory solvents such as DMSO, ethanol and acetone are found to be negligible in sensing of PA and TNT. The interference of species with electron withdrawing groups such as –CN (acrylonitrile), –COOH (benzoic acid), –CCl3 (chloroform) and –CR3+ (isopropanol) along with other nitroaromatic analytes in the PL sensing of TNT and PA for all the polymers were also checked and was found to be minimum (Fig. S8, ESI†).Selectivity experiments on each of the polymers showed that all of the NACs displayed significant quenching responses over the other non-nitroaromatic analytes. The inability of the non-nitro analytes to quench the fluorescence indicated that these polymers offer selectively high quenching efficiency towards nitroaromatic analytes compared to other analytes. The compounds used in this study are 2,4,6-trinitrotoluene (TNT), picric acid (PA), 1,4-dinitrobenzene (DNB), nitrobenzene (NB), 3,5-dinitrosalicylic acid (DNSA), 2-nitrophenol (2-NP), 4-nitrophenol (4-NP), benzoic acid (BA), acrylonitrile (AN), iso-propanol (i-PrOH), phenol, benzene, chloroform, nitromethane (NM) and nitroethane (NE). The highest quenching was obtained for the highly electron deficient PA and TNT. The quenching efficiency of the polymers with respect to all the nitroaromatic, nitroaliphatic and other analytes is given in Fig. 5. The PL quenching of the polymers in presence of nitroaliphatic compounds such as nitromethane and nitroethane was found to be 7% which is negligible compared to the nitroaromatic analytes. Thus, these polymers can be specifically used for the selective and efficient sensing of highly electron deficient nitroaromatic explosives such as PA and TNT.
There is an observed red shift in the PL of the polymers upon addition of TNT. This is due to the formation of Meisenheimer complex between the electron rich polymers and the electron deficient TNT.35 The three electron withdrawing NO2 groups in TNT makes the toluene ring highly electron deficient due to which TNT forms a Meisenheimer complex with the electron rich polymers. The formation of complex occurs by the loss of a proton from the TNT-methyl group to the sulphur atom of the thiophene ring of the polymer. This type of complex formation is absent in case of the other analytes because of which there is no red shift observed in the PL spectrum.
The rate of fluorescence quenching in presence of the selected nitroaromatic compounds are provided in the ESI, Fig. S9.† From the figure it is evident that the quenching rates are faster in case of the nanocomposites compared to Poly 1.
Stern–Volmer plots
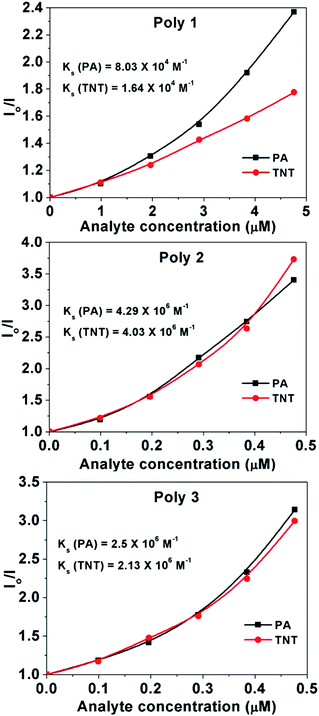
The Stern–Volmer (SV) plots of the polymers are almost linear at low concentration region while deviates from linearity, bending upwards at higher concentration.The Stern–Volmer equation is given by
| Io/I = 1 + Ksv[Q] | (2) |
Hence in order to calculate the accurate Stern–Volmer constant and to have an insight into the exact quenching mechanism we first calculate the steady state Stern Volmer constant21,24 by the equation
| Io/I = 1 + Ks[Q] | (3) |
From the plots, the value of the steady state SV constants, Ks, are calculated for the polymers in presence of PA and TNT and are provided in the respective plots Again, in case of static quenching, the PL lifetime of the sensor remains unchanged on addition of incremental amounts of analytes.
Time resolved fluorescence decay measurements of the polymers at different analyte concentration were carried out to differentiate between static and dynamic quenching. PA and TNT were considered as the model analyte for the time resolved fluorescence study. The time resolved PL spectra of the polymers in presence of increasing amounts of analyte upon excitation at 270 nm is given in Fig. S10 in the ESI.† The decrease in the fluorescence lifetime of the polymers on addition of increasing amount of analyte suggests the presence of dynamic quenching mechanism operating in this phenomenon.
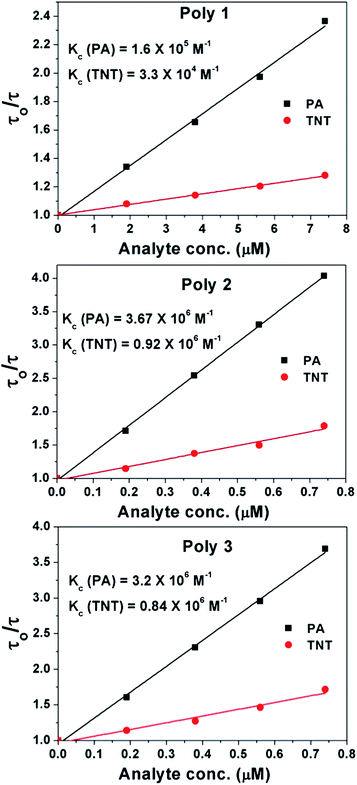
The excited state lifetimes of the polymers before and after addition of analytes were further explored. On the other hand, dynamic quenching allows an extra relaxation pathway for the molecules which results in decrease in their lifetime upon addition of analytes. The Stern–Volmer equation for collisional quenching21,24 is given by
| το/τ = 1 + Kc[Q] | (4) |
In the case of combined dynamic and static quenching, the fluorophores are quenched both by collisions and complex formation with the same quencher. In this case, the steady state Stern–Volmer equation is given by
| Io/I = (1 + Kc[Q]) (1 + Ks[Q]) | (5) |
| Io/I = 1 + Ks[Q] + Kc[Q] + KcKS[Q]2 | (6) |
At low analyte concentration, the term [Q]2 is very less prominent and hence eqn (5) will give a straight line. Conversely, at higher concentration, the plot deviates from linearity and the effect of the collisional constant Kc will be significant.
The Stern–Volmer constant (Ksv) can be obtained from the combination of Ks and Kc and are given in Table 1.
| Polymers | Lifetime (ns) | Ksv (PA) M−1 | Ksv (TNT) M−1 |
|---|---|---|---|
| Poly 1 | 0.95 | 2.4 × 10⁵ | 0.49 × 10⁵ |
| Poly 2 | 1.39 | 7.96 × 10⁶ | 4.95 × 10⁶ |
| Poly 3 | 1.23 | 5.7 × 10⁶ | 2.97 × 10⁶ |
This binding is stronger in Poly 2 and Poly 3 compared to Poly 1 as confirmed from Ksv values. It is also evident that in case of PA there is higher amount of dynamic quenching taking place compared to TNT as seen from the Kc values. This is due to presence of strong excited state Forster resonance energy transfer (FRET) along with electron transfer in case of PA and the absence of FRET in case of TNT which is explained in details in the mechanism section. The Ksv values of the nanocomposites, Poly 2 and Poly 3, are found to be much higher compared to other reported fluorescent chemosensors for PA and TNT.36–38
Mechanism
The sensing mechanism operating in the fluorescence quenching phenomenon is found to be a combination of Photoinduced Electron Transfer (PET) and Forster Resonance Energy Transfer (FRET) in case of PA, 2-NP, 4-NP and 3,5-DNSA. Again, in case of TNT, NB and 1,4-NB the proposed phenomenon is only electron transfer mechanism. Incorporation of nanoparticles in the polymer matrix introduces electrostatic interaction between the nanoparticles and the polymer which, in turn, increases the surface charge of the polymers (as confirmed from zeta potential values). The electron rich polymers and the electron deficient nitroaromatic compounds together forms an excited state donor–acceptor complex. Schematic representation of the donor acceptor mechanism and the electron transfer from LUMO of the polymer to the LUMO of PA is given in Scheme 2A and B.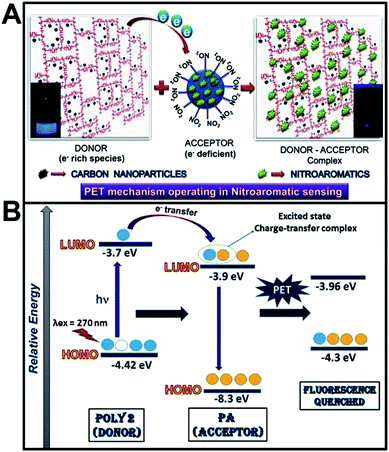 | ||
| Scheme 2 (A) Schematic representation of PET mechanism in NAC sensing, (B) electron transfer from LUMO of polymer to LUMO of analyte. | ||
Electron deficient analytes such as NACs quenches the photoluminescence of the polymer if the LUMO of the analytes (π* type orbitals) reside between the valence band (VB) and the conduction band (CB) of the luminescent polymers. Upon excitation, the electron in the HOMO of the polymer (fluorophore) absorbs a photon and jumps to the LUMO of the polymer. In absence of analyte, this electron comes back to the ground state with emission of radiation which is observed as strong fluorescence. In presence of analyte, there occurs effective excited state electron transfer from the LUMO of the polymer to the LUMO of the NACs which then comes back to the ground state via a non-radiative emission that is observed as quenching of fluorescence. Hence with increase in the number of electron deficient –NO2 groups, electron transfer from the polymer to the analyte becomes thermodynamically more feasible. Evidence of electron transfer mechanism in NAC sensing is further provided from cyclic voltammetry measurements (ESI, Fig. S11†). The HOMO and LUMO levels of the polymers were calculated from the CV plots39 and that for PA and other analytes were taken from literature.40 There is a remarkable shift in the oxidation and reduction potentials of the polymers after addition of PA.
The thermodynamic feasibility of the quenching mechanism can be better explained by the ΔG values obtained from the Rehm–Weller equation. The ΔG values, zeta potential and band gap of the polymers in absence and in presence of PA are provided in Table 2.
| Polymers | ΔGOPA (kcal mol−1) | Band gap polymer (eV) | Band gap polymer + PA (eV) | ZP polymer (mV) | ZP polymer + PA (mV) |
|---|---|---|---|---|---|
| POLY 1 | −35.56 | 1.74 | 1.50 | −4.32 | 0.015 |
| POLY 2 | −42.93 | 0.65 | 0.34 | −24.7 | −1.76 |
| POLY 3 | −40.15 | 0.78 | 0.29 | −22.2 | −1.52 |
From Table 2, it is evident that the band gap decreases considerably in the nanocomposites compared to the undoped polymer. Again, the ΔG values are found to be more negative in case of the nanocomposites, which makes the electron transfer thermodynamically more feasible in their case. The zeta potential values of Poly 1, Poly 2 and Poly 3 are −4.32 mV, −24.7 mV and −22.2 mV respectively. Upon addition of 200 μl of PA, the zeta potential values of Poly 1, Poly 2 and Poly 3 changes to 0.015 mV, −1.76 mV and −1.52 mV respectively (ESI, Fig. S12†). This further confirms the operation of electron transfer mechanism from the polymers to the analytes.
In addition to PET, the presence of FRET is another reason behind the efficient quenching in most of the nitroaromatic compounds. FRET exists when there is an effective overlap between the absorption spectra of the electron deficient acceptor and the emission band of the electron rich donor. In case of most of the analytes such as picric acid, 3,5-DNSA, 2-NP and 4-NP, there is an effective overlap between the PL spectra of the polymers and the UV spectra of the analyte. Fig. 8A shows the efficient spectral overlap between the emission band of Poly 2 and the absorption band of PA. The spectral overlap of the absorption band of all other nitroaromatic compounds with the emission band of Poly 2 is given in Fig. 8B. The overlap area is highest in case of PA which is 63.86, followed by 43.1 in 3,5-DNSA, 28.2 in 2-NP and 21.6 in 4-NP. The overlap area is found to be minimum i.e. 7.03 in 1,4-DNB, 2.2 in TNT and 1.79 in NB which reduces the probability for the existence of long range excited state energy transfer (FRET) from the polymer to the analyte. This can be further explained by the huge difference in the lifetime values of the polymers on addition of picric acid, which is due to the combination of electron transfer and excited state energy transfer taking place in this case. On the other hand, there is a minimum change in the lifetime values of the polymers upon addition of TNT. This is due to the absence of excited state energy transfer as evident from the TRPL spectra.
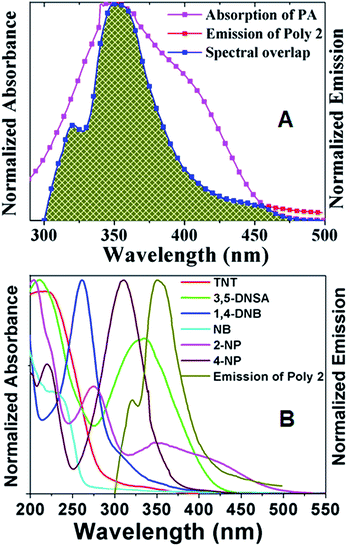 | ||
| Fig. 8 Spectral Overlap of PL spectra of Poly 2 with absorption spectra of (A) PA, and (B) TNT and other nitroaromatic compounds. | ||
Limit of detection (LOD)
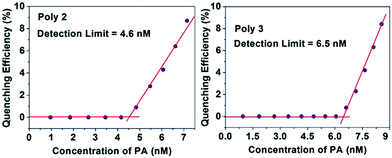
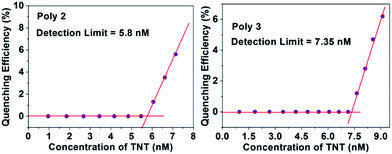
The LOD of all the polymers in presence of PA and TNT was calculated by using an already established method21,41 and the plots for PA with the nanocomposites are provided in Fig. 9. For this experiment, a 1 μM (for Poly 1) and 0.1 μM (for Poly 2 and Poly 3) solution of PA was gradually added to the dispersed polymers. Initially, the fluorescence intensity of the polymers did not change, but with further addition of PA, quenching was observed. The limit of detection was calculated from the intercepts of the two linear fits.The LOD of Poly 2 and Poly 3 are remarkably low and are found to be in the ppb range for both PA and TNT. The detection limit for PA of the nanocomposites Poly 2 (4.6 nM) and Poly 3 (6.5 nM) are comparatively much better than Poly 1 (0.12 μM). Similarly, the limit of detection for TNT was calculated and are found to be 0.15 μM, 5.8 nM and 7.35 nM for Poly 1, Poly 2 and Poly 3 respectively. The plots for LOD of TNT for Poly 2 and Poly 3 is provided in Fig. 10. The LOD of Poly 2 and Poly 3 for TNT falls below the permissible exposure limit of TNT in drinking water (2 ppb i.e. ≈ 9 nM) as set by US EPA. This further counts for the potential usefulness of these polymers for real time detection of nitroaromatic explosives which are also highly toxic environmental pollutants.
A comparative analysis of our work with some other PA and TNT sensors reported earlier is carried out and the comparative data are provided in Table S1 in the ESI.†
Precision of results
The reproducibility of the system was deduced from three consecutive PL quenching readings of the polymers with 5 μM PA for Poly 1 and 0.5 μM PA for both Poly 2 and Poly 3. The t-test results showed that the curves are not significantly different from each other. The results are provided in the ESI,† Table S2 and it shows the precision of our results and reproducibility of the system.Conclusion
In this work, we demonstrate the one pot synthesis of PVA-g-polythiophene and its carbon and silver nanocomposites for the ultrasensitive detection of nitroaromatic explosives. The excellent sensing properties of the electron rich nanocomposites towards NACs is established by fluorescence quenching phenomenon. The nonlinear SV plots indicates the coexistence of both static as well as dynamic quenching mechanisms. Detection limit of the carbon and silver nanocomposites for both TNT and PA are found to be in nM range and are much lower than most of the earlier reported works. Detection limit of TNT for the nanocomposites falls below the permissible exposure limit of TNT in drinking water. Simple synthetic route, scalable production in high quantities, good thermal properties and high sensitivity ensures their easy device fabrication for real time explosive detection in defence sector and industries. Detection of these dangerous explosives and highly toxic environment pollutants is of utmost importance for the safety of human health and the environment. This new series of electron rich fluorescent polymeric nanocomposites for the selective detection of NACs may consecutively enable the development of improved electron rich sensors in future for nitroaromatic explosive sensing.Acknowledgements
The authors would like to thank Department of Information Technology (DeitY), Government of India for the project No. 1(2)/2011-M&C. PD would like to thank Department of Science & Technology, Ministry of Science & Technology Govt. of India (DST) and IASST, Guwahati for fellowship. Authors would like to thank Dr Bappaditya Gole, Dr Nirab Chandra Adhikary, Dr Devasish Chowdhury, Bedanta Gogoi, Upama Baruah, Aziz Khan and Kaushik Das for their help in this work.References
- S. W. Thomas, G. D. Joly and T. M. Swager, Chem. Rev., 2007, 107, 1339–1386 CrossRef CAS.
- S. Hrapovic, E. Majid, Y. Liu, K. Male and J. H. T. Luong, Anal. Chem., 2006, 78, 5504–5512 CrossRef CAS PubMed.
- A. W. Czarnik, Nature, 1998, 394, 417–418 CrossRef CAS.
- L. C. Shriver-Lake, B. L. Donner and F. S. Ligler, Environ. Sci. Technol., 1997, 31, 837–841 CrossRef CAS.
- J. D. Rodgers and N. J. Bunce, Water Res., 2001, 35, 2101–2111 CrossRef CAS PubMed.
- R. Garg, D. Grasso and G. Hoag, Hazard. Waste Hazard. Mater., 1991, 8, 319–340 CrossRef CAS.
- P. C. Ashbrook and T. A. Houts, ACS Division of Chemical Health and Safety, 2003, 10, 27 Search PubMed.
- Toxicological Profile for 2,4,6-trinitrotoluene, Agency for Toxic Substances and Disease Registry, US Department of Health and Human Services, Atlanta, GA, 1995 Search PubMed.
- E. S. Forzani, D. L. Lu, M. J. Leright, A. D. Aguilar, F. Tsow, R. A. Iglesias, Q. Zhang, J. Lu, J. H. Li and N. J. Tao, J. Am. Chem. Soc., 2009, 131, 1390–1391 CrossRef CAS PubMed.
- J. M. Sylvia, J. A. Janni, J. D. Klein and K. M. Spencer, Anal. Chem., 2000, 72, 5834–5840 CrossRef CAS PubMed.
- B. Gole, S. Shanmugaraju, A. K. Bar and P. S. Mukherjee, Chem. Commun., 2011, 47, 10046–10048 RSC.
- M. S. Meaney and V. L. McGuffin, Anal. Bioanal. Chem., 2008, 391, 2557–2576 CrossRef CAS PubMed.
- S. Zhang, F. Lu, L. Gao, L. Ding and Y. Fang, Langmuir, 2007, 23, 1584–1590 CrossRef CAS PubMed.
- B. Roy, A. K. Bar, B. Gole and P. S. Mukherjee, J. Org. Chem., 2013, 78, 1306–1310 CrossRef CAS.
- T. L. Andrew and T. M. Swager, J. Am. Chem. Soc., 2007, 129, 7254–7255 CrossRef CAS.
- Y. Xu, B. Li, W. Li, J. Zhao, S. Sun and Y. Pang, Chem. Commun., 2013, 49, 4764–4766 RSC.
- J. Ke, X. Li, Y. Shi, Q. Zhao and X. Jiang, Nanoscale, 2012, 4, 4996–5001 RSC.
- M. E. Kose, B. A. Harruff, Y. Lin, L. M. Veca, F. S. Lu and Y. P. Sun, J. Phys. Chem. B, 2006, 110, 14032–14034 CrossRef CAS.
- S. Richardson, H. S. Barcena, G. A. Turnbull, P. L. Burn and I. D. W. Samuel, Appl. Phys. Lett., 2009, 95, 063305 CrossRef.
- H. Nie, Y. Zhao, M. Zhang, Y. Ma, M. Baumgartenb and K. Mullen, Chem. Commun., 2011, 47, 1234–1236 RSC.
- B. Gole, A. K. Bar and P. S. Mukherjee, Chem.–Eur. J., 2014, 20, 2276–2291 CrossRef CAS PubMed.
- X. D. Yang, B. W. Shen, Y. N. Jiang, Z. X. Zhao, C. X. Wang, C. Ma, B. Yang and Q. Lin, J. Mater. Chem. A, 2013, 1, 1201–1206 CAS.
- Y. Cui, Y. Yue, G. Qian and B. Chen, Chem. Rev., 2012, 112, 1126–1162 CrossRef CAS PubMed.
- B. Gole, W. Song, M. Lackinger and P. S. Mukherjee, Chem.–Eur. J., 2014, 20, 13662–13680 CrossRef CAS PubMed.
- S. S. Nagarkar, B. Joarder, A. K. Chaudhari, S. Mukherjee and S. K. Ghosh, Angew. Chem., 2013, 125, 2953–2957 CrossRef.
- Y. Xia, L. Song and C. Zhu, Anal. Chem., 2011, 83, 1401–1407 CrossRef CAS PubMed.
- P. Dutta, B. Kalita, B. Gogoi and N. S. Sarma, J. Phys. Chem. C, 2015, 119, 17260–17270 CAS.
- K. K. Kartha, S. S. Babu, S. Srinivasan and A. Ajayaghosh, J. Am. Chem. Soc., 2012, 134, 4834–4841 CrossRef CAS PubMed.
- B. W. Xu, X. F. Wu, H. B. Li, H. Tong and L. X. Wang, Macromolecules, 2011, 44, 5089–5092 CrossRef CAS.
- P. Dutta, N. N. Dass, D. Chowdhury and N. S. Sarma, Chem. Eng. J., 2013, 225, 202–209 CrossRef CAS.
- P. Dutta, N. N. Dass and N. S. Sarma, React. Funct. Polym., 2015, 90, 25–35 CrossRef CAS.
- Y. Ma, H. Li, S. Peng and L. Wang, Anal. Chem., 2012, 84, 8415–8421 CrossRef CAS PubMed.
- Y. Long, H. Chen, H. Wang, Z. Peng, Y. Yang, G. Zhang, N. Li, F. Liu and J. Pei, Anal. Chim. Acta, 2012, 744, 82–91 CrossRef CAS PubMed.
- O. Adegoke and T. Nyokong, J. Lumin., 2013, 134, 448–455 CrossRef CAS.
- S. Hughes, S. S. R. Dasary, S. Begum, N. Williams and H. Yu, Sensing and Bio-Sensing Research, 2015, 5, 37–41 CrossRef PubMed.
- S. Shanmugaraju, D. Samanta, B. Gole and P. S. Mukherjee, Dalton Trans., 2011, 40, 12333–12341 RSC.
- H. Sohn, R. M. Calhoun, M. J. Sailor and W. C. Trogler, Angew. Chem., Int. Ed., 2001, 40, 2104–2105 CrossRef CAS.
- N. Venkatramaiah, S. Kumar and S. Patil, Chem. Commun., 2012, 48, 5007–5009 RSC.
- A. Kalita, N. V. V. Subbarao and P. K. Iyer, J. Phys. Chem. C, 2015, 119, 12772–12779 CAS.
- S. Hussain, A. H. Malik, M. A. Afroz and P. K. Iyer, Chem. Commun., 2015, 51, 7207–7210 RSC.
- P. Dutta, D. Saikia, N. Adhikary and N. S. Sarma, ACS Appl. Mater. Interfaces, 2015, 7, 24778–24790 CAS.
Footnote |
| † Electronic supplementary information (ESI) available: FT-IR, 1H-NMR and EDX spectra, thermal properties, quenching rate and PL studies, SV plots, Solvent interference, CV and zeta potential plots, t-test and comparative data are provided in this section. See DOI: 10.1039/c5ra20347c |
| This journal is © The Royal Society of Chemistry 2016 |

