DOI:
10.1039/C5RA21407F
(Paper)
RSC Adv., 2016,
6, 11735-11741
Enhanced adsorption of Ni(II) using ATP/PPy/SDS composite
Received
15th October 2015
, Accepted 19th January 2016
First published on 22nd January 2016
Abstract
In this work, sodium dodecyl sulfate was applied to modify ATP/PPy composite to form ATP/PPy/SDS composite due to its large size. Transmission electron microscopy (TEM) and scanning electron microscopy (SEM) demonstrated that the composite has a “core–shell–shell” structure. The aim of this research is to evaluate the sorption characteristic of ATP/PPy/SDS for removing Ni(II) from aqueous solution. The preparation conditions were optimized by orthogonal array experiments, and external factors were investigated. Isotherm data fitted well to the Langmuir isotherm model, the maximum adsorption capacity reached 186.22 mg g−1. The adsorption kinetics was best described by a pseudo-second-order rate model, indicating that chemical sorption might be the limiting-rate step. Desorption was performed using a 0.5 M NaOH solution, and the adsorbent still maintained a high adsorption capacity even for 5 cycles of desorption-adsorption. Furthermore, Ni(II) is easily extracted by ATP/PPy/SDS composite in contrast to Cr(VI).
1. Introduction
It is well known that heavy metal pollution of water is harmful to human health and the environment. Among these metals, nickel pollution has attracted more and more attention due to its allergic reaction, carcinogenic, and toxic effects.1 Too much intake of Ni(II) can lead to severe damage to lungs and kidney. The major pollution source of nickel derives from industrial production such as mining, smelting, electroplating, batteries manufacturing and metal finishing.2–4 Considering the harmful of Ni(II), it is urgent to extract it from wastewater. Hence, various methods were utilized to remove Ni(II) from wastewater such as chemical precipitation,5 ion exchange,6 liquid–liquid extraction, reverse osmosis and adsorption. Among these methods, adsorption is an efficient and economical process, of course, an excellent adsorbent play an important role during adsorption treatment.
Polyrrole (PPy), as one of the conducting polymers, has been widely applied in various fields owing to its good electrical, electrochemical properties, and ease of preparation at low cost.7 Some studies have found that PPy synthesized in solutions with different size of dopants can exhibits different ion-exchange behavior.8–10 With small dopants, e.g. Cl−, ClO4−, NO3−, PPy exhibits anion-exchanger behavior due to the high mobility of these ions in the polymer matrix. While with large dopants, e.g. polyvinylsulfonate (PVS−), polystyrenesulfonate (PSS−), cation-exchange was found to take place on PPy due to the immobility of these ions in the polymer matrix.11 As a result of its feature, PPy has attracted more interests and is used as adsorbent to remove heavy metal ions from aqueous solution. However, PPy is lacking in long-term stability and mechanical properties,12 to overcome these disadvantages, preparation of composites is a good choice. Attapulgite (ATP), a kind of commonly used adsorbent, has excellent chemical stability and good mechanical performance,13–15 indicating a complement to PPy's defect.
In this study, with dodecyl sulfonate anion (C12H25SO3−) as a large size dopant and surfactant, ATP/PPy/SDS composite was synthesize to extract Ni(II) from aqueous water. Various effects including internal facts (synthesis conditions) and outer facts (pH, contact time, et al.) were investigated in details. Additionally, adsorption equilibrium, kinetics and regeneration of the adsorption process were evaluated. Moreover, in order to compare with our previous work,16 we studied the competitive adsorption of Cr(VI) and Ni(II) ions from aqueous water using ATP/PPy/SDS composite.
2. Experiment
2.1 Materials
Pyrrole was purchased from Shanghai Zhongqin Chemical Reagent Co. Ltd. and was distilled prior to use. ATP was supplied by Jiangsu Jiuchuan Nano-Technology Co. Ltd. Ammonium persulfate ((NH4)2S2O8), as oxidant for polymerization of pyrrole were purchased from Tianjin chemical Co. Ltd. Stock solution of Ni(II) was prepared by dissolving exact quantities of analytical grade of Ni(NO3)2·6H2O in distilled water. All other reagents used were of analytical grade.
2.2 Preparation of composite
The ATP/PPy/SDS composite was synthesized via in situ polymerization. To a 250 mL flask, 1.75 g C12H25SO3Na was added to 100 mL deionized water. Then 0.15 g ATP and 0.75 g (NH4)2S2O8 was added into the solution and stirred until (NH4)2S2O8 dissolved. Freshly distilled pyrrole (1 mL) was dropwise added into the mixture and black precipitation appeared. After reacted for 4 h the ATP/PPy/SDS composite was collected, rinsed with distilled water until the filtrate was colorless, and dried at temperature about 60 °C.
2.3 Adsorption experiments
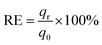
A certain concentrations ranging from 40 to 200 mg L−1 of Ni(II) (100 mL) and adsorbent (ATP/PPy/SDS composite, 0.05–0.7 g) were added into a beaker. After stirring for a given time (5–90 min), the suspension liquid was filtered. A spectrophotometer was used to determine the Ni(II) concentrations in the filtrate. The removal efficiency of Ni(II) (%) and the adsorption capacity qt (mg g−1) were calculated by eqn (1) and (2).| |
 | (1) |
| |
 | (2) |
where c0 is the initial concentration (mg L−1) and ct is the final concentration (mg L−1). V was the solution volume (mL) and m was the mass of adsorbent (g).
2.4 Regeneration experiments
The regeneration of ATP/PPy/SDS composite for reuse was investigated by sorption–desorption experiment. The desorption experiment was carried out by stirring Ni(II) loaded adsorbent with various solvents for 4 h. The spent adsorbent was then filtered and dried at 60 °C in order to reuse for the next adsorption experiment. After regeneration, the adsorbent was utilized to remove Ni(II) from Ni(II) solution (140 mg L−1) again. Consecutive sorption–desorption cycles were repeated five times to establish the reusability of the adsorbent.
2.5 Instrument of characterization
The molecular structure of the composite was studied by FT-IR spectra done on a Spectrum 100 spectrometer (Perkin Elmer, USA) using the KBr pellets. The morphology of composite was observed by a JSM-670 scanning electron microscope (SEM) (Electronics optical Ltd., Japan). Transmission electron microscopy (TEM) was taken by a JEM-1200EX transmission electron microscopy operated at 200 kV (FEI, USA). A Spectrophotometer (Shanghai Scientific Instrument Corporation, 7230G) was employed for analysis of Ni(II).
3. Results and discussion
3.1 Orthogonal array experimental design
In order to optimize the production conditions of ATP/PPy/SDS composite, orthogonal array experiment was designed based on the following four variables: quality of ATP, quality of SDS, quality of APS and reaction temperature.17 An orthogonal array of four factors and three levels are utilized to assign considered factors and levels as shown in Table 1.
Table 1 Levels and factors affecting adsorption capacity
| Level |
Factors |
| Quality of ATP (g) |
Quality of APS (g) |
Quality of SDS (g) |
Reaction temperature (K) |
| 1 |
0.05 |
0.25 |
1.75 |
295 |
| 2 |
0.1 |
0.5 |
2 |
298 |
| 3 |
0.15 |
0.75 |
2.25 |
300 |
Nine trials were performed according to the orthogonal array experiment to complete the optimal process. Experiment data were analyzed using the range analysis to reflect the optimal reaction conditions. The results were exhibited in Table 2. According to the value of range, we conclude that the maximum influencing factor is the quality of ATP. The optimal conditions were found to be: ATP of 0.15 g, APS of 0.75 g, SDS of 1.75 g and temperature 298 K. Finally, under the optimal conditions the adsorption experiment was repeated, and the adsorption capacity can reach up to 83.49 mg g−1, verified the reliability of the data.
Table 2 Orthogonal experimental design and range analysis
| Trial no. |
Factors |
Results |
Standard error |
| ATP |
APS |
SDS |
T |
qe1 |
qe2 |
qe3 |

|
δ |
| 1 |
0.05 |
0.25 |
1.75 |
295 |
65.23 |
68.79 |
66.29 |
66.77 |
1.4925 |
| 2 |
0.05 |
0.5 |
2 |
298 |
67.85 |
69.07 |
71.64 |
69.52 |
1.5796 |
| 3 |
0.05 |
0.75 |
2.25 |
300 |
70.41 |
71.20 |
73.79 |
71.80 |
1.4436 |
| 4 |
0.1 |
0.25 |
2 |
300 |
77.16 |
76.05 |
74.28 |
75.83 |
1.1860 |
| 5 |
0.1 |
0.5 |
2.25 |
295 |
71.32 |
70.28 |
71.88 |
71.16 |
0.6629 |
| 6 |
0.1 |
0.75 |
1.75 |
298 |
82.24 |
84.61 |
82.90 |
83.25 |
0.9987 |
| 7 |
0.15 |
0.25 |
2.25 |
298 |
69.97 |
72.13 |
71.38 |
71.16 |
0.8954 |
| 8 |
0.15 |
0.5 |
1.75 |
300 |
81.44 |
82.57 |
82.86 |
82.29 |
0.6126 |
| 9 |
0.15 |
0.75 |
2 |
295 |
79.84 |
77.89 |
79.24 |
78.99 |
0.8155 |
| k1 |
69.363 |
71.253 |
77.437 |
72.307 |
|
|
|
|
|
| k2 |
76.747 |
74.323 |
74.780 |
76.640 |
|
|
|
|
|
| k3 |
77.480 |
78.013 |
71.373 |
74.643 |
|
|
|
|
|
| R |
8.117 |
6.760 |
6.064 |
4.333 |
|
|
|
|
|
3.2 Structure characterization of ATP/PPy/SDS composite
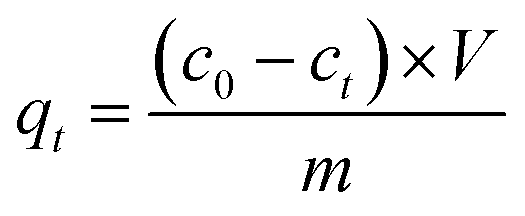
The morphology of ATP and ATP/PPy/SDS composite characterized with SEM and TEM is displayed in Fig. 1. As can be observed there was a significant difference between ATP and ATP/PPy/SDS composite. ATP exhibits rods shape and smooth surface, while, the composite has rough surface with small particles due to the existence of PPy and SDS. The TEM image of composite (Fig. 1c) further proved that ATP crystal rods were well wrapped with PPy and SDS, which validate that the ternary ATP/PPy/SDS composite has a core–shell–shell hierarchical nanostructure.
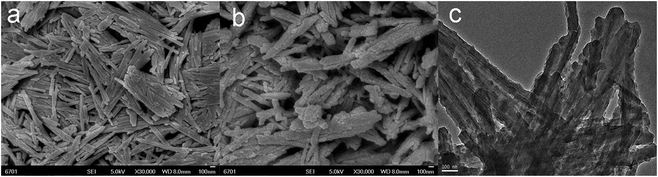 |
| | Fig. 1 SEM images of (a) ATP, (b) ATP/PPy/SDS, (c) TEM image of ATP/PPy/SDS. | |
FTIR examinations on ATP, ATP/PPy, SDS and ATP/PPy/SDS were performed. It can be seen from Fig. 2a that the main adsorption peaks of ATP at 3550 cm−1 and 3420 cm−1 correspond to –OH stretching vibration causing by mineral layer and surface adsorbed water, and the peak at 1660 cm−1 corresponds to –OH stretching vibration of H2O. In addition, the peak at 1030 cm−1 is attributed to Si–O–Si stretching vibration.18 In the spectrum of PPy (Fig. 2b) the peak at 3430 cm−1 is assigned to the N–H stretching vibrations.10 The peak at 1630 cm−1 is attributed to the conjugate molecular structure of PPy and the free charge carrier present in the polymer.19 The band at 1130 cm−1 corresponds to C–N stretching vibration. The spectrum for SDS exhibits two peaks at 2920 and 2847 cm−1, assigning to C–H asymmetric and symmetric stretching vibration, other peaks are characterized as follows: –CH2 shear vibration peak at 1471 cm−1, S![[double bond, length as m-dash]](https://www.rsc.org/images/entities/char_e001.gif) O stretching vibration peak at 1180 cm−1, and sulfonate asymmetric adsorption peak at 1070 cm−1. Meanwhile, the spectrum of ATP/PPy/SDS is similar to SDS with the intensity of peaks decrease, and peaks of SO stretching vibration and sulfonate asymmetric adsorption are shifted to 1177 and 1040 cm−1, in addition, it is noticed that a weak peak at 1535 cm−1 reflecting ring stretching mode of pyrrole ring in PPy spectrum becomes strong and shifts to 1550 cm−1. These reveal that ATP is successfully coated by PPy and SDS and there may be interactions between PPy and SDS in the composite.
O stretching vibration peak at 1180 cm−1, and sulfonate asymmetric adsorption peak at 1070 cm−1. Meanwhile, the spectrum of ATP/PPy/SDS is similar to SDS with the intensity of peaks decrease, and peaks of SO stretching vibration and sulfonate asymmetric adsorption are shifted to 1177 and 1040 cm−1, in addition, it is noticed that a weak peak at 1535 cm−1 reflecting ring stretching mode of pyrrole ring in PPy spectrum becomes strong and shifts to 1550 cm−1. These reveal that ATP is successfully coated by PPy and SDS and there may be interactions between PPy and SDS in the composite.
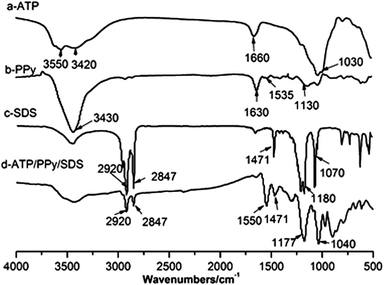 |
| | Fig. 2 FTIR spectrum of (a) ATP, (b) PPy, (c) SDS, (d) ATP/PPy/SDS. | |
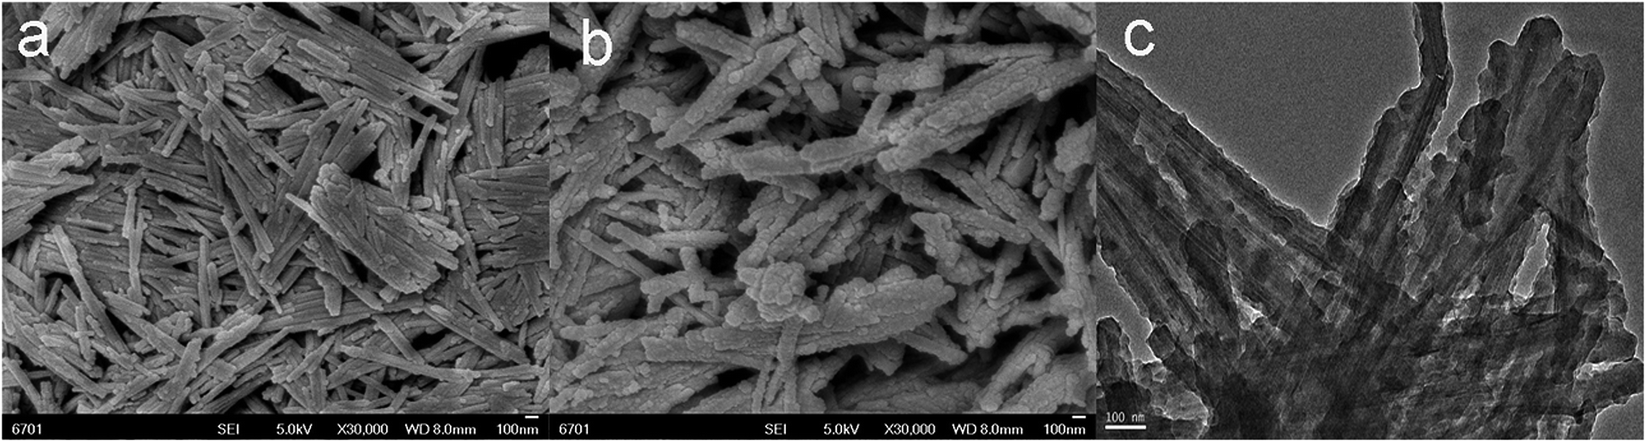
3.3 Effect of contact time
Fig. 3 presents the effect of contact time on the removal of Ni(II) by ATP/PPy/SDS composite. For these cases, the initial Ni(II) concentration of 100 mg L−1 and adsorbent dose of 0.1 g were used. It can be observed that the adsorption capacity increased with the time increasing and attained maximum value (83.49 mg g−1) after 45 minutes. Then few changes of adsorption capacity were observed, implying the equilibrium was established. The result showed that equilibrium time for removing Ni(II) is lower than that of some reported papers.3,4,20
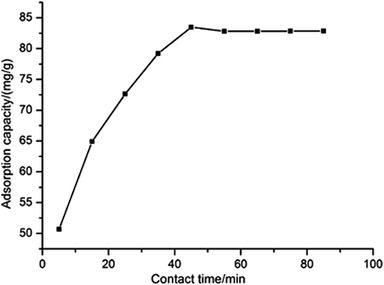 |
| | Fig. 3 The effect of contact time on the adsorption capacity. | |
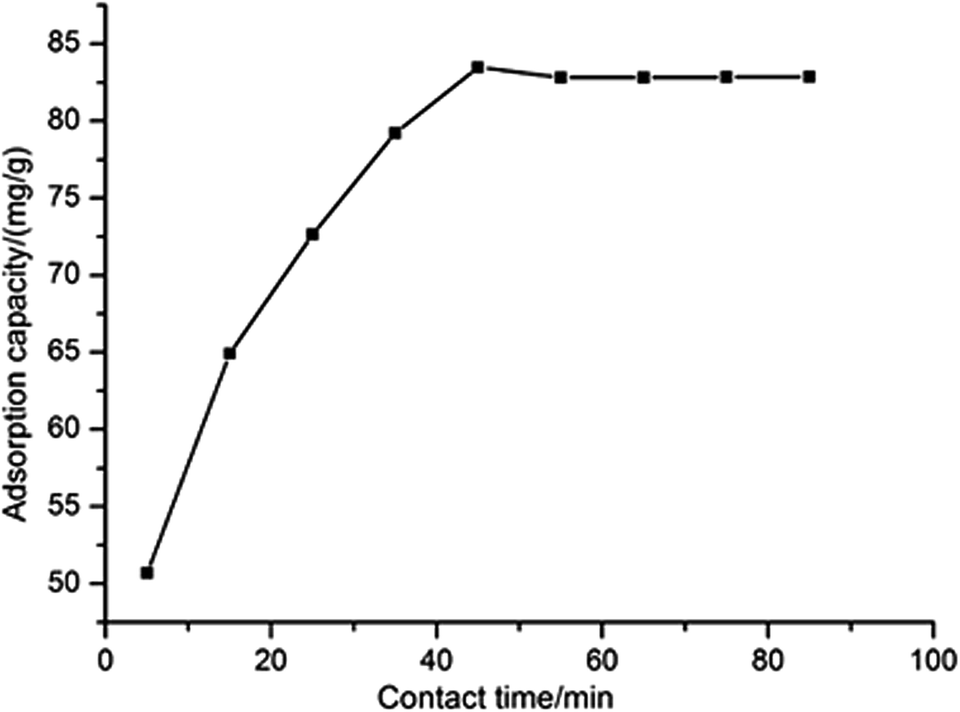
3.4 Effect of adsorbent dose
The effect of adsorbent dose on the removal of Ni(II) was studied with the initial Ni(II) concentration of 100 mg L−1, contact time of 45 min and 298 K. It can be depicted from Fig. 4 that the removal efficiency increased and the adsorption capacity decreased with the dose increasing. Considering two factors (adsorption capacity and removal efficiency) adsorbent dosage of 0.1 g was suitable for further study because of its high adsorption capacity and removal efficiency.
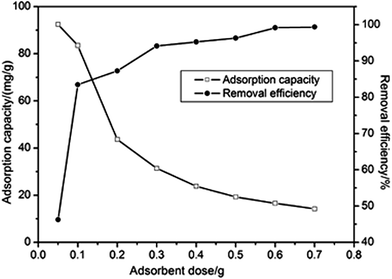 |
| | Fig. 4 The effect of adsorbent dose on the adsorption capacity. | |
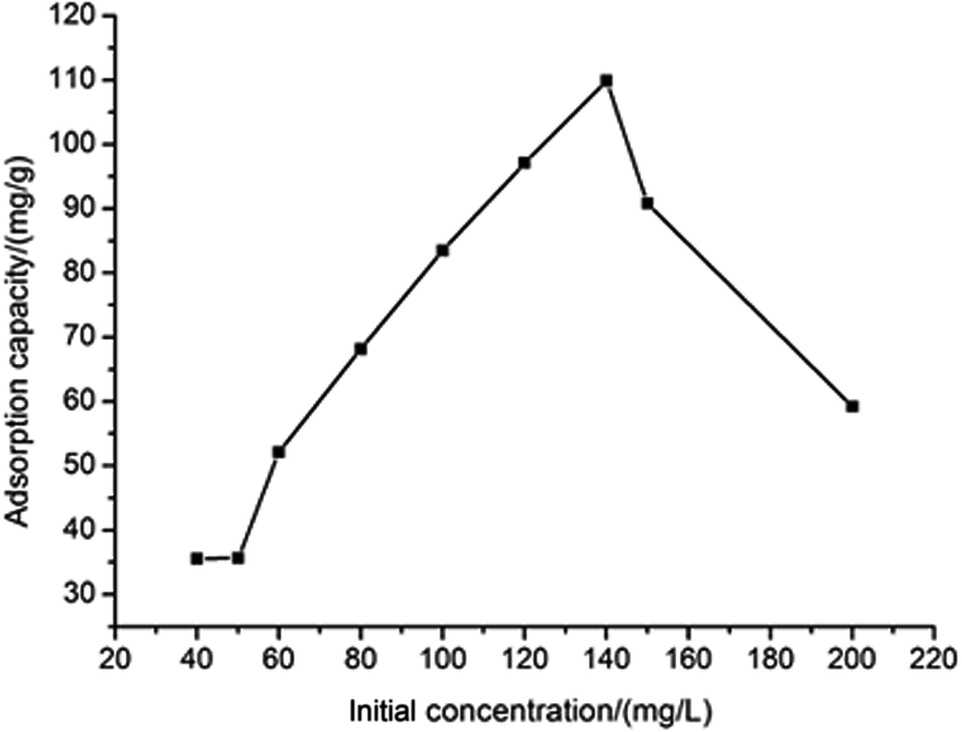
3.5 Effect of initial concentration of Ni(II)
To find out the effect of initial concentration, the adsorption of Ni(II) (40–200 mg L−1) from aqueous solution was investigated. As shown in Fig. 5, the adsorption capacity of Ni(II) increased with an increase of initial Ni(II) concentration. When the initial concentration of Ni(II) was 140 mg L−1, the adsorption capacity reached up to 109.89 mg g−1 and after that, the adsorption capacity began to decline. This is due to a relative high surface area and the accessible adsorption sites at the beginning, which made adsorption capacity increased, however, when the concentration of Ni(II) was further improved, the ration of initial number of moles Ni(II) to the available adsorption surface area was higher and as a result the adsorption capacity was less.21
 |
| | Fig. 5 The effect of initial concentration of Ni(II) on the adsorption capacity. | |
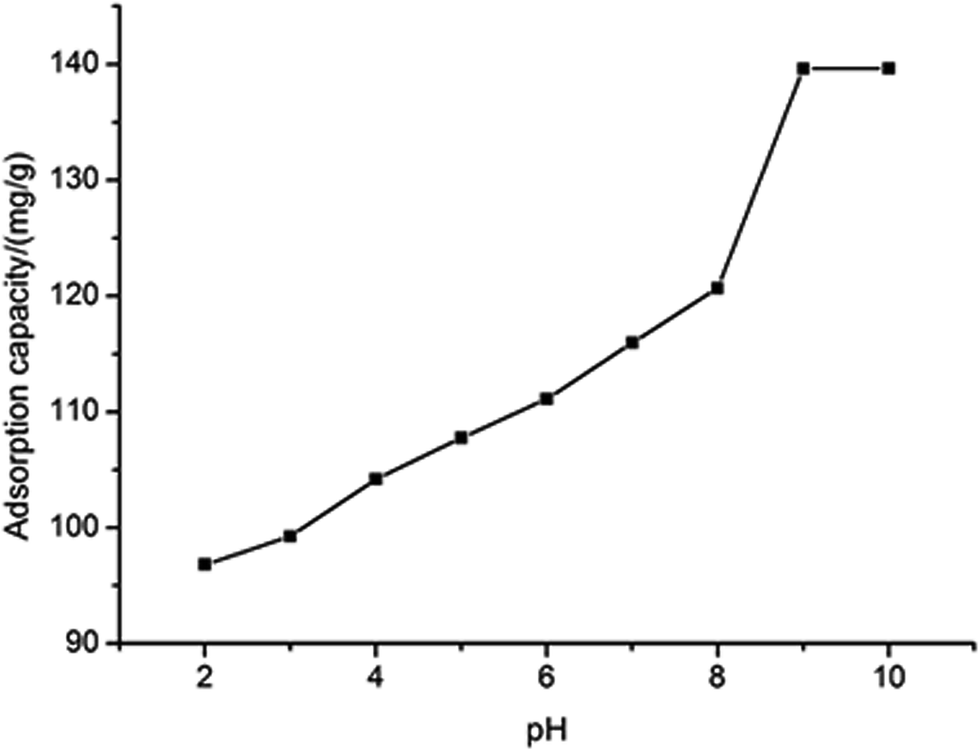
3.6 Effect of pH
Generally the pH is an important parameter affecting the adsorption process at solute/solid interface. It is well known that Ni(II) presents in the species of Ni2+, Ni(OH)+, Ni(OH)02, Ni(OH)3− and Ni(OH)42− in the solution at different pH values.22–24 In order to find out the optimum pH for removing Ni(II), the effect of pH on adsorption was examined at 298 K, 45 min contact time, 0.1 g dose and 140 mg L−1 initial concentration. Fig. 6 shows the results that the adsorption capacity increases with the increase of pH. However, owing to chemical precipitation of the metal in the form of hydroxide at pH > 8, the adsorption capacity of pH above 8 was not used. On the other hand, at pH < 8 the predominant species is Ni2+, the maximum adsorption capacity is 120.68 mg g−1.
 |
| | Fig. 6 The effect of pH on the adsorption capacity. | |
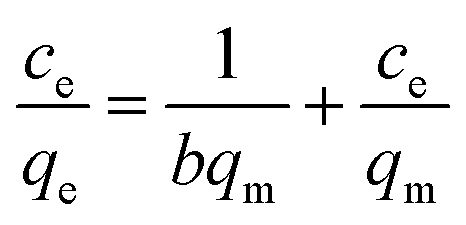
3.7 Adsorption thermodynamics
To evaluate adsorption properties of a material, equilibrium data is also critical. Hence, at four different temperatures (296, 306, 316 and 326 K) adsorption experiments were performed to obtain the equilibrium date of the adsorption process. Two well known isotherm model (Langmuir and Freundlich) were applied to plot the isotherms. The linearized Langmuir and Freundlich models are mathematically expressed as eqn (3) and (4).| |
 | (3) |
| |
 | (4) |
where qm is the maximum adsorption capacity (mg g−1); ce is equilibrium concentration of solution (mg L−1); b is the free energy of adsorption (L mg−1); kF and n are the Freundlich isotherm parameters related to the adsorption capacity (mg g−1) and the adsorption intensity, respectively. The calculated values of Langmuir and Freundlich constants are listed in Table 3.
Table 3 Langmuir and Freundlich constants for Ni(II) adsorption
| Isotherm |
Constants |
Temperature (K) |
| 296 |
306 |
316 |
326 |
| Langmuir |
R2 |
0.9981 |
0.9953 |
0.9976 |
0.9906 |
| qm (mg g−1) |
175.13 |
183.15 |
184.84 |
186.22 |
| b (L mg−1) |
0.0551 |
0.0559 |
0.0629 |
0.0683 |
| Freundlich |
R2 |
0.9912 |
0.9797 |
0.9789 |
0.9671 |
| n |
1.6763 |
1.6254 |
1.6398 |
1.6352 |
| kF (mg g−1) |
15.089 |
15.232 |
16.692 |
17.62 |
According to the values of the correlation coefficient (R2), Langmuir model fits experimental data better than Freundlich model. The maximum adsorption capacity (qm) can reach 186.22 mg g−1, higher than some reported papers,3,25,26 and with an increase of temperature qm is also increased, indicating the endothermic nature of the adsorption process. The conclusion is that the maximum adsorption takes place in a monolayer of the adsorbate molecules on the adsorbent surface and that all adsorption sites have equivalent energy and negligible interaction between adsorbed molecules.27
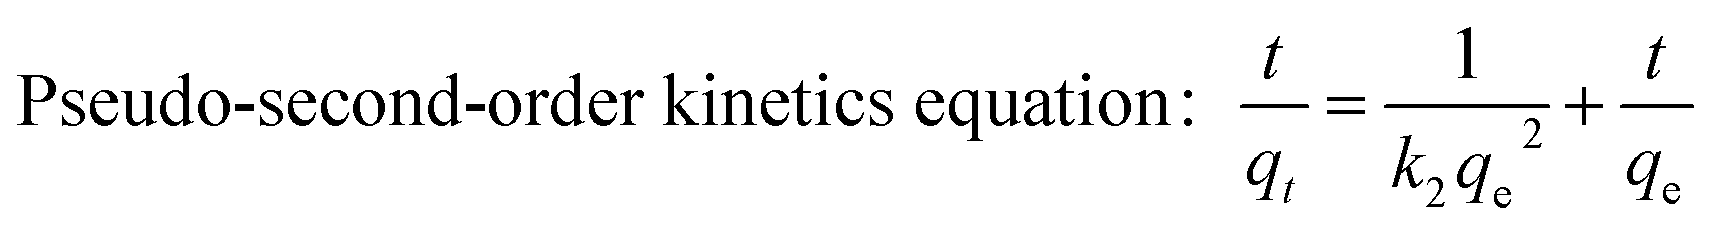
3.8 Kinetics of adsorption
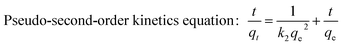
Adsorption kinetics is an important property defining the sorption efficiency. Because kinetic modeling not only shows estimation of adsorption rates but also leads to how to express suitable rates that are characteristic of possible reaction mechanism.27 The proposed models can be classified in two groups namely the adsorption reaction and diffusion models.28 Hence, adsorption kinetics of Ni(II) onto ATP/PPy/SDS were carried out at different initial concentration ranging from 40 mg L−1 to 100 mg L−1. Various kinetics models, namely pseudo-first-order model, pseudo-second-order model and intra-particle diffusion model, have been used to simulate the adsorption process. These kinetic equations can be linearly expressed as follows:| |
Pseudo-first-order kinetics equation: ln(qe − qt) = ln![[thin space (1/6-em)]](https://www.rsc.org/images/entities/char_2009.gif) qe − k1t qe − k1t
| (5) |
| |
 | (6) |
| | |
Intra-particle diffusion equation: qt = kpt0.5
| (7) |
where qe and qt are the adsorption capacity (mg g−1) of the adsorbent at equilibrium and at time t (min), respectively, k1 (min−1) is the pseudo-first-order rate constant, k2 (g mg−1 min−1) is the pseudo-second-order rate constants and kp (mg g−1 min−0.5) is the intra-particle diffusion rate constant. The linearized results are shown in Table 4. On the basis of the values of the correlation coefficients (R2), the pseudo-second-order model (R2 ∼ 0.99) can better describe the Ni(II) adsorption compared to other models. This suggests that the rate-limiting step of the adsorption process might be chemical sorption involving valence forces through sharing or exchange of electrons between adsorbent and adsorbate.
Table 4 Parameters for kinetic models of Ni(II) adsorption onto ATP/PPy/SDS
| c0 (mg L−1) |
Pseudo-first-order kinetics |
Pseudo-second-order kinetics |
Intra-particle diffusion model |
| k1/min−1 |
R2 |
k2 × 10−3 (g mg−1 min−1) |
R2 |
kp (mg (g s)−1) |
R2 |
| 40 |
0.10633 |
0.95416 |
3.949 |
0.99874 |
2.4956 |
0.83915 |
| 70 |
0.05632 |
0.95512 |
1.034 |
0.99792 |
5.8772 |
0.89053 |
| 100 |
0.12703 |
0.95651 |
2.844 |
0.99862 |
4.4818 |
0.81303 |
3.9 Regeneration studies
It is well known that the regeneration of the adsorbent is a very crucial factor determining its potential application. The sorption–desorption experiments were performed as mentioned above. At first 109.89 mg g−1 Ni(II) was loaded onto adsorbents. Then for desorption, the Ni(II) loaded adsorbents were respectively contacted with distilled water, NaOH (0.5 M), HCl (0.5 M) and EDTA (0.05 M) for 4 h. The regeneration efficiency of the adsorbent was calculated by eqn (8):20| |
 | (8) |
where q0 is the adsorption capacities of the adsorbents before regeneration, and qr is after regeneration. The results of repeating five cycles were depicted in Table 5.
Table 5 Regeneration of ATP/PPy/SDS for Ni(II)
| Type of solution |
No. of cycles and regeneration efficiency (%) |
| 1 |
2 |
3 |
4 |
5 |
| H2O |
91.32 |
89.48 |
80.07 |
70.32 |
52.32 |
| NaOH |
92.42 |
90.51 |
86.02 |
81.62 |
79.48 |
| HCl |
88.56 |
83.82 |
66.23 |
51.72 |
40.23 |
| EDTA |
99.90 |
87.31 |
83.56 |
74.88 |
69.72 |
It can be observed that the adsorption capacity of adsorbent is decreased after five cycles of the sorption–desorption process. Compared with other solvents, NaOH solution might easily extract Ni(II) from ATP/PPy/SDS composite, thus, the adsorption capacity of adsorbent can be better remained and highest regeneration efficiency achieved. On the other hand, high pH is favorable for the deprotonation of sorbent surface,29 as a result, after treated with NaOH solution, the negatively charged sites of adsorbent surface were increased, which enhances attractive forces between the sorbent surface and Ni(II), and results in a slow decrease in the adsorption capacity.30
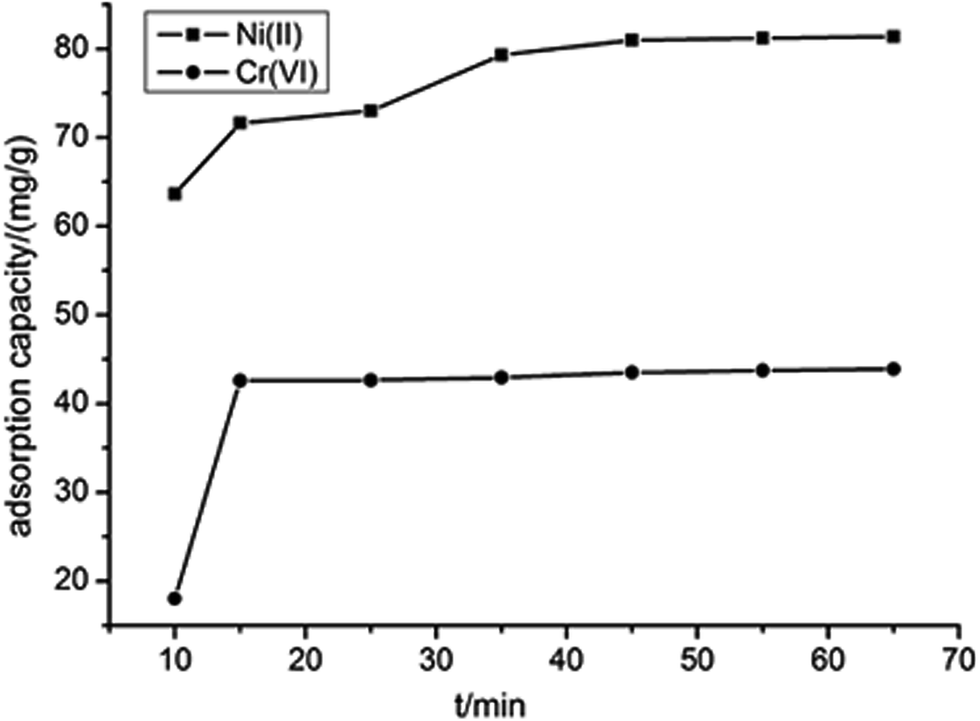
3.10 Competitive adsorption of ATP/PPy/SDS
To evaluate whether metal cations have priority to be removed by ATP/PPy/SDS, we performed a simple experiment in the Cr(VI)/Ni(II) binary systems. The competitive adsorption was carried out in a reaction mixture of 0.1 g of adsorbent and 100 mL solution containing Cr(VI) and Ni(II) at metal concentration of 100 mg L−1. The effect of contact time on the removal of Cr(VI) and Ni(II) was shown in Fig. 7. It can be observed that Ni(II) was always favorably adsorbed on ATP/PPy/SDS relative to Cr(VI) during adsorption time. To attain equilibrium conditions the removal of Cr(VI) needed 15 min, while the removal of Ni(II) needed 45 min. It is possible that the adsorption sites of ATP/PPy/SDS composite were easily occupied by Ni(II) instead of Cr(VI). In other words, Ni(II) can be favorably adsorbed in the binary system due to the introduction of SDS compared with our reported literature.16
 |
| | Fig. 7 The competitive of ATP/PPy/SDS for Ni(II) and Cr(VI). | |
4. Conclusions
In this work, considering the large size of dodecyl sulfonate anion, we employed it as a dopant to fabricate the ATP/PPy/SDS composite, and investigated its ability of extracting Ni(II) from aqueous solution. The optimum conditions of adsorption were found to be: contact time of 45 min, an adsorbent dose of 0.1 g, pH < 8 and Ni(II) initial concentration of 140 mg L−1, and the maximum adsorption capacity is 120.68 mg g−1. Equilibrium data were well described by the Langmuir isotherm, and the kinetic data showed good agreement with pseudo-second-order equation. The regeneration study indicated that the higher regeneration efficiency is still remained after five cycles of the sorption–desorption using 0.5 M NaOH. Furthermore, we found that Ni(II) can be better removed by ATP/PPy/SDS composite in contrast to Cr(VI). Thus, these results suggest that ATP/PPy/SDS composite was a highly effective adsorbent for extracting Ni(II) from aqueous solution.
Acknowledgements
This work was supported by the National Natural Science Foundation of China (No. 51503092).
References
- H. Dumrul, A. N. Kursunlu, O. Kocyigit, E. Guler and S. Ertul, Desalination, 2011, 271, 92–99 CrossRef CAS.
- K. Totlani, R. Mehta and S. A. Mandavgane, Chem. Eng. J., 2011, 181–182, 376–386 Search PubMed.
- A. Roy and J. Bhattacharya, Sep. Purif. Technol., 2013, 115, 172–179 CrossRef CAS.
- Y. Sun, Q. Yue, B. Gao, Y. Gao, X. Xu, Q. Li and Y. Wang, J. Taiwan Inst. Chem. Eng., 2014, 45, 681–688 CrossRef CAS.
- K. Parmar, H. T. Chaturvedi, M. W. Akhtar, S. Chakravarty, S. K. Das, A. Pramanik, M. Ghosh, A. K. Panda, N. Bandyopadhya and S. Bhattacharjee, Mater. Charact., 2009, 60, 863–868 CrossRef CAS.
- I. C. Ostroski, M. A. S. D. Barros, E. A. Silva, J. H. Dantas, P. A. Arroyo and O. C. M. Lima, J. Hazard. Mater., 2009, 161, 1404–1412 CrossRef CAS PubMed.
- H. Yuvaraj, K. T. Lim, H. W. Min, E. J. Park and Y. T. Jeong, Eur. Polym. J., 2008, 44, 637–644 CrossRef CAS.
- B. Saoudi, N. Jammul, M. L. Abel, M. M. Chehimi and G. Dodin, Synth. Met., 1997, 87, 97–103 CrossRef CAS.
- X. Zhang, R. Bai and Y. W. Tong, Sep. Purif. Technol., 2006, 52, 161–169 CrossRef CAS.
- M. Karthikeyan, K. K. Satheeshkumar and K. P. Elango, J. Hazard. Mater., 2009, 167, 300–305 CrossRef CAS PubMed.
- C. Weidlich, K. M. Mangold and K. Jüttner, Electrochim. Acta, 2001, 47, 741–745 CrossRef CAS.
- A. C. Rastogi, S. B. Desu and R. K. Sharma, Electrochim. Acta, 2008, 53, 7690–7695 CrossRef.
- J. Wang, X. Han, H. Ma, Y. Ji and L. Bi, Chem. Eng. J., 2011, 173, 171–177 CrossRef CAS.
- X. Zou, J. Pan, H. Ou, W. Xue, G. Wei, C. Li, Y. Yan and Y. Duan, Chem. Eng. J., 2011, 167, 112–121 CrossRef CAS.
- P. Liu and T. Wang, J. Hazard. Mater., 2007, 149, 75–79 CrossRef CAS PubMed.
- Y. Chen, H. Xu, S. Wang and L. Kang, RSC Adv., 2014, 4, 17805–17811 RSC.
- X. Wu and D. Y. C. Leung, Appl. Energy, 2011, 88, 3615–3624 CrossRef CAS.
- C. Li, New Carbon Mater., 1999, 14, 19–25 CAS.
- M. Karthikeyan, K. K. S. Kumar and K. P. Elango, Desalination, 2011, 267, 49–56 CrossRef CAS.
- E. Repo, J. K. Warchol, T. A. Kurniawan and M. E. T. Sillanp, Chem. Eng. J., 2010, 161, 73–82 CrossRef CAS.
- M. Omraei, H. Esfandian, R. Katal and M. Ghorbani, Desalination, 2011, 271, 248–256 CrossRef CAS.
- C. Chen and X. Wang, Ind. Eng. Chem. Res., 2006, 45, 9144–9149 CrossRef CAS.
- H. Javadian, P. Vahedian and M. Toosi, Appl. Surf. Sci., 2013, 284, 13–22 CrossRef CAS.
- S. T. Yang, J. X. Li, D. D. Shao, J. Hu and X. K. Wang, J. Hazard. Mater., 2009, 166, 109–116 CrossRef CAS PubMed.
- Y. Ren, N. Yan, Q. Wen, Z. Fan, T. Wei, M. Zhang and J. Ma, Chem. Eng. J., 2011, 175, 1–7 CrossRef CAS.
- J. Fei, C. Li, T. Bo, J. Xu, L. Gang and L. Peng, Chem. Eng. J., 2012, 209, 325–333 CrossRef.
- A. Heidari, H. Younesi, Z. Mehraban and H. Heikkinen, Int. J. Biol. Macromol., 2013, 61, 251–263 CrossRef CAS PubMed.
- Z. Cheng, X. Liu, H. Mei and M. Wei, J. Hazard. Mater., 2010, 182, 408–415 CrossRef CAS PubMed.
- S. B. Johnson, G. V. Franks, P. J. Scales, D. V. Boger and T. W. Healy, Int. J. Miner. Process., 2000, 58, 267–304 CrossRef CAS.
- A. Roy and J. Bhattacharya, Sep. Purif. Technol., 2013, 115, 172–179 CrossRef CAS.
|
| This journal is © The Royal Society of Chemistry 2016 |
Click here to see how this site uses Cookies. View our privacy policy here.