Nitrogen and sulfur co-doped graphene aerogels as an efficient metal-free catalyst for oxygen reduction reaction in an alkaline solution
Mei Wu,
Zhiyu Dou,
Jingjing Chang and
Lili Cui*
Department of Chemistry and Chemical Engineering, Changchun University of Science and Technology, Changchun 130022, China. E-mail: cuilili1127@gmail.com
First published on 15th February 2016
Abstract
Nitrogen and sulfur dual-doped three dimensional (3D) graphene aerogels (N–S-GAs) are firstly prepared through pyrolyzing poly[5-amino-1,3,4-thiadiazole-2-thiol] coated graphene aerogels (PATT-GAs) as a metal-free oxygen reduction reaction (ORR) catalyst. 3D structures of N–S-GAs have been reserved after high temperature pyrolyzing, and N and S atoms are successfully doped into graphene frameworks. The catalytic performance of the fabricated N–S-GAs towards the ORR is assessed by electrochemical test techniques. The effects of pyrolyzing temperature on catalytic activity are also studied. The binding states of N and S atoms have a great influence on the electrocatalytic activity for the ORR. The N–S-GAs gained after pyrolysis at 900 °C (N–S-GAs 900) demonstrate higher electrocatalytic activity and diffusion-limiting current density, better stability and methanol tolerance. The excellent performance for the ORR on N–S-GAs is attributed to the interconnected porous network, conductive multiplexed pathways of N–S-GAs, greater electrocatalytically active site exposure and the synergistic effect originating from the doped N and S in the graphene sheets.
1. Introduction
Fuel cells (FCs) have been paid intensive attention attributed to their low operating temperature, eco-friendly nature, high energy density and long life.1–3 However, the sluggish kinetics of the cathodic ORR is one of the most important factors in hindering the performance of FCs.4 So far, platinum (Pt)-based catalysts are widely applied as effective catalysts due to their relatively lower overpotential and higher current density.5–7 Nevertheless, Pt-based catalysts still encounter several problems, such as high price, intolerance to poisonous substances, and instability. These disadvantages have tremendously hindered fuel cells' widespread commercialization. Therefore, extensive research work has been dedicated to seeking for substitutes, including precious metal-free and metal-free catalysts.8–10 In this regard, metal-free heteroatom-doped carbon materials are considered to be the most promising alternatives corresponding to their high catalytic activity, stability, and low cost.11–14 Their enhanced ORR activities attributed to the heteroatoms which can induce asymmetric atom charge and spin densities. Furthermore, the asymmetric atom charge and spin densities are beneficial for ORR.Graphene has emerged as the subject of intense research due to its ultrahigh surface area, excellent conductivity and robust mechanical properties. Chemical doping with foreign atoms are also an effective method to tailor electronic properties, manipulate surface chemistry, and modify the elemental composition of host materials. Very recently, the co-doped or multi-doped graphene catalysts such as N/S,15,16 N/P,17,18 N/B,19 B/P,20 N/I,21,22 N/F,23 N/S/P24 exhibit superior ORR performance than sole heteroatom doped graphene materials owing to the synergetic effect between the different heteroatoms. This also indicates that dual or multi heteroatoms doping is a definitely feasible strategy to enhance ORR performance. More importantly, how to increase the surface areas and create pores which contribute to active sites exposure and mass transport of ORR-relevant species, has become the most heated research topics.
Three-dimensional graphene aerogels (3DGAs) have been attracting much attention, since they display continuously interconnected porous structures, high specific surface area, high electrical conductivity and quite low density.25 GAs possess high electric conductivity and high specific surface areas, which facilitate charge transport fast across the graphene sheets junctions and supply more active sites for catalytic reaction. Moreover, the interconnected porous networks of GAs are helpful for fast mass transfer of the redox species. Hence, 3DGAs-based materials have been paid much attention to due to its better ORR performance.26–30
Herein, N and S co-doped graphene aerogels are synthesized as improved ORR catalyst (N–S-GAs). N–S-GAs are prepared through hydrothermal synthesis and high temperature pyrolysis, a two-step process as illustrated in Scheme 1. The monolithic material of N–S-GAs after high temperature pyrolysis suggests the porous interconnected networks have not been destroyed by thermal shock and rapidly releasing gases. Moreover, the influence of pyrolyzing temperature on the electrocatalytic activity for ORR is discussed.
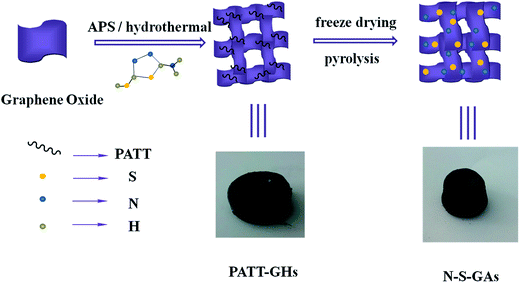 | ||
| Scheme 1 Schematic diagram of the N–S-GAs preparation route and pictures of PATT-GHs and N–S-GAs, respectively. | ||
2. Experimental section
2.1 Materials
Natural flake graphite powder was bought from Beijing Chemical Company (China). Ammonium persulfate (APS) was provided by Tianjin Guangfu Technology Development Co. Ltd (China). 5-Amino-1,3,4-thiadiazole-2-thiol (C2H3N3S2) was purchased from Sigma-Aldrich. 20 wt% Pt on Vulcan XC-72 (Pt/C catalyst) was gained from Alfa Aesar. All other reagents were used directly.2.2 Synthesis of N–S-GAs
The graphite oxide was prepared by a modified Hummers method.31 N–S-GAs were carried out as following procedure: 80 mg C2H3N3S2 and moderate APS were added to 20 mL of 2 mg mL−1 graphene oxide (GO) solution. The mixtures were dispersed by ultrasonic dispersion for 30 min and then sealed. Subsequently, this ternary mixture was hydrothermally assembled at 180 °C in a Teflon lined stainless-steel autoclave for 20 h to assemble 3D poly[5-amino-1,3,4-thiadiazole-2-thiol] (PATT) coated graphene hydrogels (PATT-GHs). The PATT-GHs were washed by distilled water for several times in order to wash the excessive APS and the produced acid. The as-prepared hydrogels were directly dehydrated via a freeze-drying process for 48 h to gain PATT modified graphene aerogels (PATT-GAs). Following, PATT-GAs were put into a tubular furnace and pyrolyzed in the presence of Ar gas for 2 h to form N and S dual-doped graphene aerogels (N–S-GAs). The catalyst pyrolyzed at different temperatures was denoted as N–S-GAs X, where X represented pyrolysis temperature.2.3 Structural characterization
The samples morphology was observed by scanning electron microscopy (SEM, JEOL JSM-6701F electron microscope operating at 5 kV) and transmission electron microscopy (TEM, JEOL-2010 transmission electron microscope operating at 200 kV). Nitrogen adsorption and desorption isotherms were measured on a Micromeritics ASAP-2020 sorption analyser at 77 K. Raman spectra analysis was operated on a LabRAM HR Evolution Raman spectrometer at 785 nm. X-ray photoelectron spectroscopy (XPS) analysis was collected by an ESCLAB 250 spectrometer with a monochromatized Al Kα X-ray source.2.4 Electrochemical measurements
The electrochemical characterizations were carried out on CHI 660E using a three-electrode electrochemical cell. A modified GCE, a platinum wire and a saturated calomel reference electrode (SCE) were used as working, counter and reference electrode, respectively. The working electrodes modification, and electrochemical tests method and operating conditions were carried out as the procedures reported previously by our group.32,33 The catalyst loading on the GCE was about 425 μg cm−2. 0.5% wt Nafion solution was used as a binder to prevent the catalyst film to peel off. The modification of GC electrode and electrochemical characterizations were operated at room temperature.3. Results and discussion
3.1 Characterizations of N–S-GAs
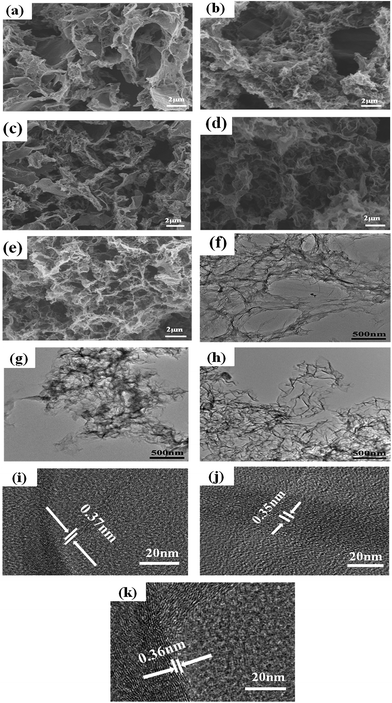
The morphology of the catalyst samples is investigated by SEM and TEM. As displayed in Fig. 1(a–e), all catalysts exhibit an interconnected porous 3D network with random orientation, crumpled sheets. The thickness of skeleton film becomes gradual thin with increase temperature treatment. This indicates that N–S-GAs still retain a 3D interconnected porous structure after high temperature pyrolysis. The GAs present a wrinkle laminar structure like silk veil waves (Fig. 1(f)). To PATT-GAs, a thin PATT layer is obviously discerned on the surface of graphene sheet composed of GAs, as shown in Fig. 1(g). However, the polymer layer disappears after pyrolyzing at 900 °C (Fig. 1(h)), and the gained N–S-GAs 900 display more wrinkled structure and abundant pores compared to GAs, which can provide more active sites and favor reactant transport.34 The cross-sectional views of the prepared GAs, PATT-GAs and N–S-GAs 900 reveal only a few layers of graphene sheets exhibited in Fig. 1(i–k). Adjacent interlayer distances in the N–S-GAs are in the range of 0.35 to 0.37 nm, near to the d-spacing of the (002) crystal plane of graphite (0.335 nm) with slight distortion.35The Brunauer–Emmett–Teller (BET) surface area and Barrett–Joyner–Halenda (BJH) pore size distribution of the N–S-GAs samples are characterized by nitrogen adsorption–desorption isotherms, as displayed in Fig. 2(a). The N2 absorption curves of all N–S-GAs samples exhibit a IV hysteresis loop, which indicates the presence of mesopores.36 The hysteresis loop appeared at lower (0.4–0.8) and higher (0.8–1.0) relative pressure, indicate the existence of mesopores and macropores, respectively.37 The pore size distribution obtained (Fig. 2(b)) by BJH method shows a narrow distribution of mesopores centered at ca. 2.70 nm and a broad distribution of larger pores at about 60–150 nm, respectively. The BET surface area, BJH pore sizes, and pore volumes of N–S-GAs samples are summarized in Table 1. Shown in Table 1, the BET surface area and pore volume of N–S-GAs samples grow with the increase pyrolysis temperature, however, average pore diameters decrease.38 The increase in BET surface area and pore volumes may be owing to that the amount of carbon residue derived from pyrolysis of PATT becoming less at high temperature, which may block the pore of N–S-GAs and result in the decrease of BET surface area and pore volume. In addition, the π–π interactions among graphene sheets may grow stronger due to the higher graphitization degree of graphene at higher pyrolyzing temperature. We suppose the enhancement of π–π interactions between graphene sheets of N–S-GAs may result in a shorter distance among graphene sheets, which might lead to pore size decrease. The higher surface area and pore volume are beneficial for active sites exposure and mass transport for ORR.
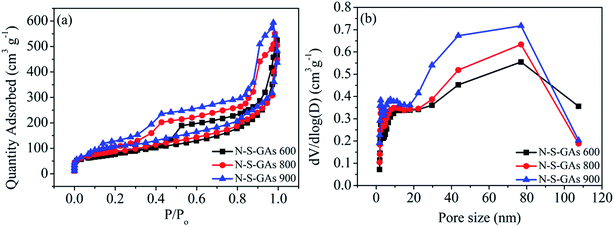 | ||
| Fig. 2 (a) Nitrogen adsorption–desorption isotherms of N–S-GAs 600, N–S-GAs 800 and N–S-GAs 900. (b) Pore size distributions gained by the Barrett–Joyner–Halenda method. | ||
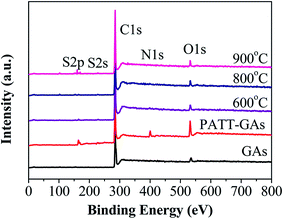
N and S signals are seen on PATT-GAs, N–S-GAs 600, N–S-GAs 800 and N–S-GAs 900 in XPS spectra in Fig. 3, demonstrating that both N and S are successfully doped into the graphene sheets of GAs after high temperatures treatment. However, the pristine GAs just show C, O signals.
N and S bonding configurations in dual-doped N–S-GAs are analyzed through the high resolution N1s and S2p peaks exhibited in Fig. 4 and 5, respectively. As shown in Fig. 4(a–c), all N–S-GAs show N1s signals, and the N content in samples decrease from 1.82% to 0.48% with increase pyrolysis temperature. The N1s spectra in N–S-GAs can be deconvoluted three peaks located at 398.45 ± 0.20 eV, 399.80 ± 0.16 eV, 401.10 ± 0.35 eV, which are pyridinic-N, pyrrolic-N and graphitic-N, respectively (Fig. 4(a–c)). Moreover, the bonding configuration concentration of different N is quantified and changed with pyrolyzing temperature. As shown in Fig. 4(d), graphitic-N is the dominant species, whereas the loading of pyridinic-N and pyrrolic-N become lower with increase pyrolysis temperature. The current view obtained through combining theoretical calculations and experiments suggests that oxygen reduction can be facilitated on graphitic-, pyridinic- and pyrrolic-N species. Any kind of N functionalities can induce asymmetric atom charge and spin density, which can boost ORR.39 But the selectivity and catalytic activity for ORR are highly dependent on N bonding configurations. It has been demonstrated that graphitic N can improve the limiting-current density, and pyridinic N can improve the onset potential, while pyrrolic N has little effect for ORR.34 Furthermore, it has been reported that more graphitic N than pyridinic N is regarded to be in favor of ORR.40,41 Therefore, the more graphitic N in N–S-GAs may improve the ORR activity.
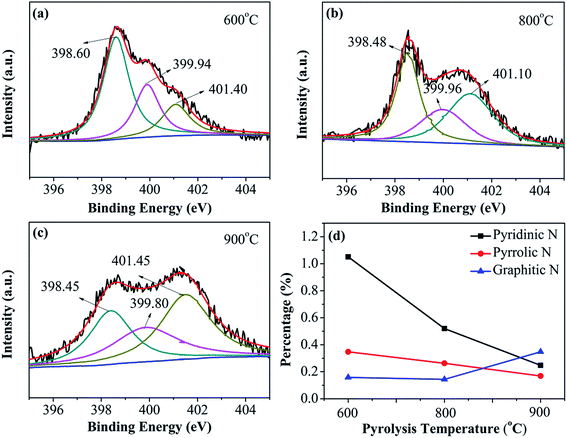 | ||
| Fig. 4 XPS spectra of N1s of (a) N–S-GAs 600, (b) N–S-GAs 800, (c) N–S-GAs 900. (d) The content of different N functionalities with different pyrolyzed temperatures, respectively. | ||
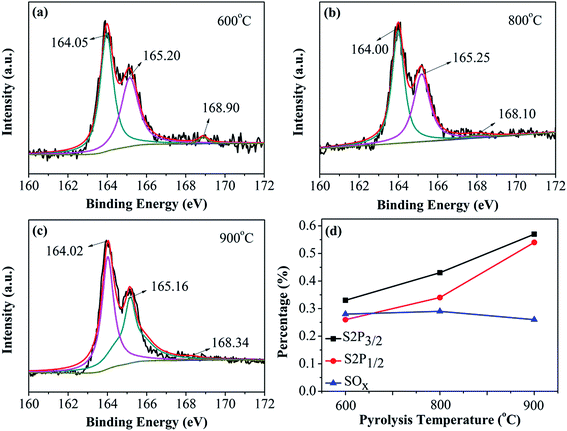 | ||
| Fig. 5 XPS spectra of S2p for (a) N–S-GAs 600, (b) N–S-GAs 800, (c) N–S-GAs 900. (d) The content of different S functionalities with different pyrolyzed temperatures, respectively. | ||
Peak deconvolution of the high-resolution S2p XPS spectra of N–S-GAs shown in Fig. 5(a–c), indicates two type of chemical state of S. The S in the catalyst exists in two chemical states: thiophene-S and oxidized-S. Thiophene-S shows two peaks at 164.00 ± 0.02 eV and 165.15 ± 0.09 eV for S2p3/2 and S2p1/2, respectively, due to their spin–orbit coupling.42 The peak positions at 168.10 ± 0.80 eV are attributed to the existence of oxidized S, which is supposed to be inactive for ORR.43,44 The XPS results indicate that the S atoms are doped into the edge and defect of graphene sheets formed thiophene-S and SOx. Displayed in Fig. 5(d), the loadings of thiophene-S increases with the increasing pyrolysis temperature, but the content of SOx decreases, signifying SOx species with lower thermal stability. The thiophene-S is believed to play a significant effect on enhancing catalytic activity.45,46 It has been acknowledged in the studies that the S atom in S-doped carbon materials can also disturb the atom charge and spin densities, which reduce oxygen molecule adsorption barrier. In addition, the charge and spin densities in S and N co-doped graphene are extensively increased through density functional theory (DFT) calculations, which is more beneficial for ORR.45 As shown in Fig. 5(d), the overall content of sulfur in N–S-GAs is observed to increase from 0.58% to 1.12% with increasing the pyrolysis temperature. The XPS results indicate more graphitic-N and thiophene-S can form at high pyrolysis temperature, which are considered as high-effective catalytic sites for ORR.
The Raman spectrum has been widely used to determine the defects and structural disorder of carbon materials. Depicted in Fig. 6(a), all Raman spectroscopy of GAs, PATT-GAs, N–S-GAs 600, N–S-GAs 800, and N–S-GAs 900 display two typical peaks located at 1332 and 1592 cm−1, which originate from lattice distortion in sp2-hybridized carbon and associate with sp2-hybridized carbon, respectively.47,48 ID/IG ratio is universally applied to evaluate the density of defects in carbon materials.49 It can be seen from Fig. 6(b) that all N–S-GAs exhibit higher ID/IG ratio than undoped GAs, indicating the doping of N and S leads to a large number of defects and impurities in the carbon lattice. The ID/IG ratio also increases with increasing temperature attributed to generation of more defects caused by hydroxyl and epoxy groups decomposition leading to the in-plane C![[double bond, length as m-dash]](https://www.rsc.org/images/entities/char_e001.gif) C cracking.50
C cracking.50
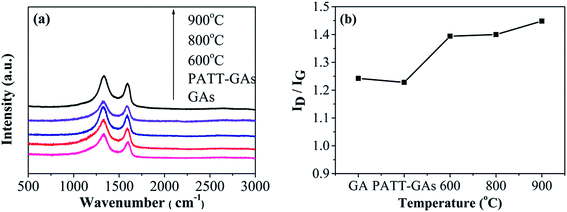 | ||
| Fig. 6 (a) Raman spectra of GAs, PATT-GAs, N–S-GAs 600, N–S-GAs 800 and N–S-GAs 900. (b) The ID/IG ratio plotted against the pyrolyzing temperature. | ||
3.2 Catalysis of N–S-GAs toward oxygen reduction
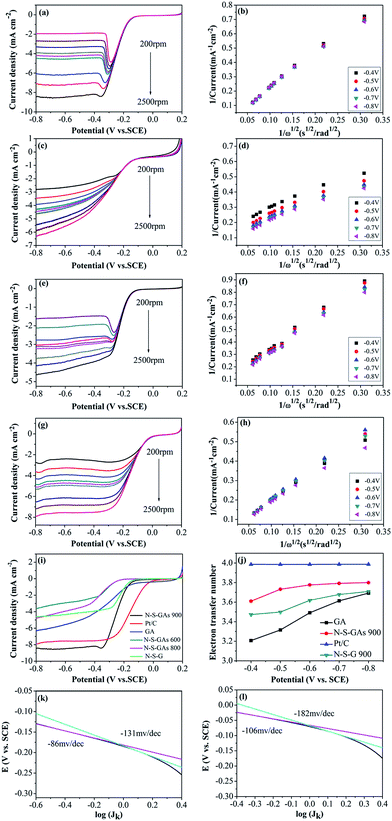
The electrocatalytic activity and kinetics of the ORR on samples (N–S-GAs 900, GAs, N–S-G 900 and Pt/C) are firstly investigated by rotating disk electrode (RDE) measurement operated at different rotation speeds. As shown in Fig. 7(a), (c), (e) and (g), the diffusion-limiting current increases with increase the rotation speed (from 200 to 2500 rpm), which can be explained by shortened diffusion distance at high rotation speeds.51 The electrons transfer number (n) can be calculate based on the slope of Koutecky–Levich (K–L, J−1 vs. ω−1/2) plots from RDE voltammetry using the following eqn (1):
 | (1) |
The corresponding K–L plots (J−1 versus ω−1/2) with the potential range from −0.4 V to −0.8 V vs. SCE show good linear relation with approximately constant slopes, indicating that the first-order reaction kinetics for ORR on the N–S-GAs 900 with respect to the concentration of dissolved O2, and suggesting a similar electron transfer number for ORR in the selected potential range (exhibited in Fig. 7(b), (d), (f) and (h)). Fig. 7(i) displays the RDE voltammograms for GAs, N–S-GAs 600, N–S-GAs N–S-GAs 800, N–S-GAs 900, N–S-G 900 and Pt/C at the rotation rate of 2500 rpm. The onset and half-wave potential, and diffusion-limiting current density for ORR on different catalysts are summarized in Table 2. As exhibited in Fig. 7(i), the onset potential and diffusion-limiting current density of N–S-GAs 900 are more positive and larger than other N–S-GAs and N–S-G 900 samples. The electrocatalytic properties of N–S-GAs 900 catalyst compared to other nitrogen and sulfur dual or single doped graphene or graphene aerogels previously reported in literatures are shown in Table 3. Based on the results reported, N–S-GAs 900 exhibit comparable or better ORR activity than other catalysts prepared previously.
| Materials | Eonset (V) | E1/2 (V) | JL (mA cm−2) |
|---|---|---|---|
| N–S-GAs 900 | −0.12 | −0.24 | 8.30 |
| N–S-GAs 800 | −0.21 | −0.32 | 4.62 |
| N–S-GAs 600 | −0.22 | −0.29 | 3.62 |
| GAs | −0.16 | −0.30 | 5.99 |
| N–S-G 900 | −0.15 | −0.22 | 4.30 |
| Pt/C | −0.01 | −0.14 | 8.00 |
| Materials | Eonset (V) | E1/2 (V) | JL (mA cm−2) | Electrolyte solution | Reference electrode | Reference |
|---|---|---|---|---|---|---|
| N–S-GAs 900 | −0.12 | −0.24 | 6.20 | 0.1 M KOH | Hg/Hg2Cl2 | In this work |
| CPGA-600 | −0.05 | −0.25 | 4.90 | 0.1 M KOH | Hg/Hg2Cl2 | 52 |
| CA-TCA-900 | −0.18 | −0.24 | 1.70 | 0.1 M KOH | Ag/AgCl | 53 |
| PAC/5S | −0.14 | −0.24 | 4.50 | 0.1 M KOH | Ag/AgCl | 54 |
| NS-G | −0.15 | −0.30 | 2.10 | 0.1 M KOH | Ag/AgCl | 55 |
| NSG700 | −0.15 | −0.25 | 4.00 | 0.1 M KOH | Hg/Hg2Cl2 | 56 |
| SN-S-OMC-4 | −0.08 | −0.15 | 5.60 | 0.1 M NaOH | Ag/AgCl | 57 |
In principle, properties of catalyst catalytic active sites, surface area, conductivity and mass transport in catalyst layer are major parameters influencing the ORR behavior. Firstly, the larger amount of effective activity sites could facilitate oxygen reduction. The number of active sites in the N–S-GAs for ORR is closely dependent on the quantity and configuration of heteroatom functionalities. Based on the XPS and nitrogen adsorption–desorption isotherms results of samples, N–S-GAs 900 have the highest graphitic nitrogen, thiophene sulfur contents and specific surface area than others, resulting in a more efficiently active sites exposure for ORR. Secondly, the electron transfer rate in the electrode process could be improved by higher conductivity of catalyst. Thus, N–S-GAs catalyst pyrolyzed at 900 °C have higher electrical conductivity than those gained at 600 °C or 800 °C heat treatment, which is attributed to higher degree reduction of GO at higher temperature. Lastly, mass transfer in catalyst layer is another important factor effecting on the ORR performance. N–S-GAs 900 possess higher pore volume, which are favorable for oxygen and electrolyte diffusion. Based on above-mentioned view, as shown in Fig. 7(i), N–S-GAs 900 display the better catalytic activity regarding onset potential and diffusion-limiting current density than other N–S-GAs X, GAs and N–S-G 900 catalysts, because N–S-GAs 900 catalyst with porous 3D interconnected networks and higher conductivity favor efficient mass transfer, high electron transfer rate, and more active sites exposure. In addition, the synergistic effect originated from the two doped heteroatom in graphene sheets may boost ORR. Therefore, the kinetic process for ORR on N–S-GAs 900 is more facile.58
The electron transfer number (n) of N–S-GAs 900 calculated from the slopes of the K–L plots varies from 3.6 to 3.8 shown in Fig. 7(j), suggesting that ORR process is nearly a one-step 4e− reduction process in the studied potential range.55 However, the electron transfer number for GAs is about 3, indicating a mixing process relating both 2e− and 4e− reduction process. Moreover, the electron transfer number of 2D N–S-G 900 is about 3.5.
The mass-corrected Tafel plots (E vs. log![[thin space (1/6-em)]](https://www.rsc.org/images/entities/char_2009.gif) JK) for the ORR on the N–S-GAs 900 and Pt/C are shown in Fig. 7(k) and (l). JK (eqn (2)) derived from the linear plots of LSVs at 1600 rpm (Fig. 7(a) and (g)).
JK) for the ORR on the N–S-GAs 900 and Pt/C are shown in Fig. 7(k) and (l). JK (eqn (2)) derived from the linear plots of LSVs at 1600 rpm (Fig. 7(a) and (g)).
| JK = (JD × J)/(J − JD) | (2) |
The catalysts exhibit two discrete Tafel slopes at two potential regions, suggesting that different ORR mechanisms. The Tafel slopes for N–S-GAs 900 and Pt/C are −86, −106 mV dec−1 at low overpotentials, and reach to −131, −182 mV dec−1 at high overpotentials, respectively. At low overpotentials, the rate-determining step is the first electron on oxygen reduction. At the high overpotential region, the oxygen reduction rate is related to the oxygen diffusion.59 From a mechanistic point of view, the similar Tafel slope on N–S-GAs 900 and Pt/C catalysts indicates the similar ORR mechanisms. Furthermore, the smaller Tafel slop of N–S-GAs 900 than Pt/C in two regions indicates that N–S-GAs 900 show better ORR activity in comparison with Pt/C.60
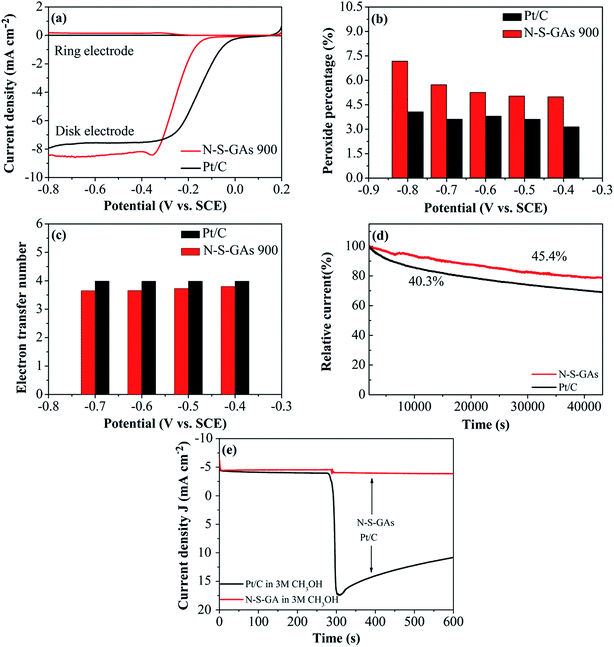
Consistent results are also gained by RRDE measurements shown in Fig. 8(a). The super catalytic activity for ORR on N–S-GAs is further confirmed by the electron transfer number (eqn (3)) and percentage of H2O2 species (eqn (4)) involved in ORR as following:61
| n = 4ID/(ID + IR/N) | (3) |
| HO2−% = 200(IR/N) × (ID + IR/N) | (4) |
In which N is the collection efficiency (N = 0.37), ID and IR are the current at disk and ring electrode, respectively. From the RRDE voltammograms exhibited in Fig. 8(a), the percentage of HO2− generated and the electron transfer number at different potentials on N–S-GAs 900 and Pt/C can be gained by calculating based on eqn (3) and (4). Showed in Fig. 8(b), on both N–S-GAs 900 and Pt/C, HO2− is no obviously detected, and the HO2− yield percentage is below 7.5%, which verify the oxygen reduction is a direct a 4-electron process. The number of the electron transfer for N–S-GAs 900 is in the range of 3.65 to 3.79 at the studied potential range (Fig. 8(c)). Based on above-mentioned result, it is found that the RRDE test result agrees well with the result gained from the RDE test.
The durability is a significant issue in FCs technology, so the stability of N–S-GAs 900 and Pt/C for ORR is assessed by chronoamperometric measurement at −0.2 V and −0.34 V vs. SCE, respectively, in O2-saturated 0.1 M KOH solution. As exhibited in Fig. 8(d), after 12 h continuous operation, Pt/C catalyst exhibit a rapid decrease of 59.7% compared to its initial current. However, the N–S-GAs 900 display a slow degradation of 54.6% of its original current, which indicate that N–S-GAs 900 catalyst exhibit enhanced stability.
The tolerance to methanol crossover of catalyst is another of importance in FCs. As displayed in Fig. 8(e), the Pt/C catalyst shows a current sharp decrease upon addition of 3 M methanol into electrolyte solution. For comparison, there is no noticeable change of the current on the N–S-GAs 900 under the same circumstance, demonstrating better tolerance of methanol than Pt/C catalyst. This result indicates that N–S-GAs 900 selectively reduces O2 even under the presence of methanol.62
Compared to N–S-G 900, N–S-GAs 900 exhibit better electroactivity for ORR owing to interconnected porous networks of N–S-GAs 900 with high special area, porous structure and high conductivity, which are favourable for active sites exposure, rapid reagent diffusion and high electron transfer rate. N–S-GAs 900 also demonstrate better electroactivity than GAs and N-GAs,63 which is because that N–S-GAs 900 provide more active sites by heteroatoms co-doping and the synergistic effect originated from doped N and S in graphene sheets. Consequently, heteroatoms co-doped GAs may be a better candidate for application in electrochemical catalysis.
4. Conclusions
In summary, a novel nitrogen and sulfur co-doped GAs catalyst (N–S-GAs) as a metal-free catalyst for ORR are prepared by a simple method, which possess outstanding performance for ORR in an alkaline medium. The porous interconnected networks of N–S-GAs have not been destroyed after high temperature pyrolyzing. The number of effective catalytic active site, the special surface area and pore volume increase with increasing pyrolyzing temperature. Moreover, the catalyst which has the more surface area and pore volume, can boost the ORR. Thus, the ORR on the N–S-GAs 900 catalyst follows a four-electron transfer pathway, with lower H2O2 yield. The proposed N–S-GAs 900 for ORR show higher limiting-diffusion current, better durability, and better resistance to methanol than Pt/C catalyst. The enhanced ORR performance on N–S-GAs 900 has a close relationship with efficient mass transfer, high electron transfer rate, and more active sites exposure and synergistic effect originated from doped N and S. Also, the synthetic approach is simple, which could be extensively applied to synthesize a series of heteroatoms co-doped graphene aerogel with broad applications in electronics, fuel cells, supercapacitors and lithium ion batteries.Acknowledgements
The work has been supported by the Natural Science Foundation of China (No. 21273024) and Natural Science Foundation of Jilin Province, China (the development plan of science and technology No. 201201120).References
- C. Coutanceau, R. K. Koffi, J. M. Leger, K. Marestin, R. Mercier, C. Nayoze and P. Capron, J. Power Sources, 2006, 160, 334–339 CrossRef CAS.
- A. S. Gago, D. Morales-Acosta, L. G. Arriaga and N. Alonso-Vante, J. Power Sources, 2011, 196, 1324–1328 CrossRef CAS.
- L. Zhang, J. J. Zhang, D. P. Wilkinson and H. J. Wang, J. Power Sources, 2006, 156, 171–182 CrossRef CAS.
- B. C. H. Steele and A. Heinzel, Nature, 2001, 414, 345–352 CrossRef CAS PubMed.
- M. Winter and R. J. Brodd, Chem. Rev., 2004, 104, 4245–4269 CrossRef CAS PubMed.
- A. Rabis, P. Rodriguez and T. J. Schmidt, ACS Catal., 2012, 2, 864–890 CrossRef CAS.
- D. S. Su and G. Q. Sun, Angew. Chem., Int. Ed., 2011, 50, 11570–11572 CrossRef CAS PubMed.
- S. V. Mentus, Electrochim. Acta, 2004, 50, 27–32 CrossRef CAS.
- Y. Gorlin and T. F. Jaramillo, J. Am. Chem. Soc., 2010, 132, 13612–13614 CrossRef CAS PubMed.
- Y. Y. Liang, Y. G. Li, H. L. Wang, J. G. Zhou, J. Wang, T. Regier and H. J. Dai, Nat. Mater., 2011, 10, 780–786 CrossRef CAS PubMed.
- J. Liang, Y. Zheng, J. Chen, J. Liu, D. Hulicova-Jurcakova, M. Jaroniec and S. Z. Qiao, Angew. Chem., Int. Ed., 2012, 51, 3892–3896 CrossRef CAS PubMed.
- K. P. Gong, F. Du, Z. H. Xia, M. Durstock and L. M. Dai, Science, 2009, 323, 760–764 CrossRef CAS PubMed.
- D. S. Geng, Y. Chen, Y. G. Chen, Y. L. Li, R. Y. Li, X. L. Sun, S. Y. Ye and S. Knights, Energy Environ. Sci., 2011, 4, 760–764 CAS.
- L. J. Yang, S. J. Jiang, Y. Zhao, L. Zhu, S. Chen, X. Z. Wang, Q. Wu, J. Ma, Y. W. Ma and Z. Hu, Angew. Chem., Int. Ed., 2011, 50, 7132–7135 CrossRef CAS PubMed.
- K. G. Qu, Y. Zheng, S. Dai and S. Z. Qiao, Nano Energy, 2016, 19, 373–381 CrossRef CAS.
- H. H. Zhang, X. Q. Liu, G. L. He, X. X. Zhang, S. J. Bao and W. H. Hu, J. Power Sources, 2015, 279, 252–258 CrossRef CAS.
- Z. Q. Jiang, X. S. Zhao, X. N. Tian, L. J. Luo, J. H. Fang, H. Q. Gao and Z. J. Jiang, ACS Appl. Mater. Interfaces, 2015, 7, 19398–19407 CAS.
- R. Li, Z. D. Wei and X. L. Gou, ACS Catal., 2015, 5, 4133–4142 CrossRef CAS.
- Z. Q. Jiang, X. S. Zhao, X. N. Tian, L. J. Luo, J. H. Fang, H. Q. Gao and Z. J. Jiang, ACS Appl. Mater. Interfaces, 2015, 7, 19398–19407 CAS.
- G. Jo, J. Sanetuntikul and S. Shanmugam, RSC Adv., 2015, 5, 53637–53643 RSC.
- Y. F. Zhan, J. L. Huang, Z. P. Lin, X. Yu, D. R. Zeng, X. X. Zhang, F. Y. Xie, W. H. Zhang, J. C. Chen and H. Meng, Carbon, 2015, 95, 930–939 CrossRef CAS.
- M. Hassan, E. Haque, A. I. Minett and V. G. Gomes, ChemSusChem, 2015, 8, 4040–4048 CrossRef CAS PubMed.
- X. C. Qiao, S. J. Liao, G. H. Wang, R. P. Zheng, H. Y. Song and X. H. Li, Carbon, 2016, 99, 272–279 CrossRef CAS.
- F. Razmjooei, K. P. Singh, M. Y. Song and J. S. Yu, Carbon, 2014, 78, 257–267 CrossRef CAS.
- M. A. Worsley, P. J. Pauzauskie, T. Y. Olson, J. Biener, J. H. Satcher and T. F. Baumann, J. Am. Chem. Soc., 2010, 132, 14067–14069 CrossRef CAS PubMed.
- H. Hu, Z. B. Zhao, W. B. Wan, Y. Gogotsi and J. S. Qiu, Adν. Mater., 2013, 25, 2219–2223 CrossRef CAS PubMed.
- Z. Han, Z. B. Tang, P. Li, G. Z. Yang, Q. B. Zhang and J. H. Yang, Nanoscale, 2013, 5, 5462–5467 RSC.
- H. Huang, P. W. Chen, X. T. Zhang, Y. Lu and W. C. Zhan, Small, 2013, 9, 1397–1404 CrossRef CAS PubMed.
- V. Chabot, D. Higgins, A. Yu, X. C. Xiao, Z. W. Chen and J. J. Zhang, Energy Environ. Sci., 2014, 7, 1564–1596 CAS.
- H. D. Pham, V. H. Pham, T. V. Cuong, T. Duong, N. Phan, J. S. Chung, E. W. Shin and S. W. Kim, Chem. Commun., 2011, 47, 9672–9674 RSC.
- G. X. Wang, X. P. Shen, B. Wang, J. Yao and J. Park, Carbon, 2009, 47, 1359–1364 CrossRef CAS.
- L. Lin, M. Li, L. Q. Jiang, Y. F. Li, D. J. Liu, X. Q. He and L. L. Cui, J. Power Sources, 2014, 268, 269–278 CrossRef CAS.
- Y. F. Li, M. Li, L. Q. Jiang, L. Lin, L. L. Cui and X. Q. He, Phys. Chem. Chem. Phys., 2014, 16, 23196–23205 RSC.
- L. F. Lai, J. R. Potts, D. Zhan, L. Wang, C. K. Poh, C. Tang, H. Gong, Z. X. Shen, J. Y. Linand and R. S. Ruoff, Energy Environ. Sci., 2012, 5, 7936–7942 CAS.
- J. A. Turnbull, M. S. Stagg and W. T. Eeles, Carbon, 1966, 3, 387–392 CrossRef CAS.
- H. Wang, J. Mater. Chem. A, 2014, 2, 4739–4750 CAS.
- H. Wang, J. Mater. Chem. A, 2013, 1, 11778–11789 CAS.
- M. Saleh, V. Chandra, K. C. Kemp and K. S. Kim, Nanotechnology, 2013, 24, 255702 CrossRef PubMed.
- D. Deng, X. Pan, L. Yu, Y. Cui, Y. Jiang, J. Qi, W. X. Li, Q. Fu, X. Ma, Q. Xue, G. Sun and X. Bao, Chem. Mater., 2011, 23, 1188–1193 CrossRef CAS.
- B. Zheng, J. Wang, F. B. Wang and X. H. Xia, Electrochem. Commun., 2013, 28, 24–26 CrossRef CAS.
- H. Niwa, K. Horiba, Y. Harada, M. Oshima, T. Ikeda, K. Terakura, J. I. Ozaki and S. Miyata, J. Power Sources, 2009, 187, 93–97 CrossRef CAS.
- F. Buckel, F. Effenberger, C. Yan, A. Golzhauser and M. Grunze, Adv. Mater., 2000, 12, 901–905 CrossRef CAS.
- Z. Yang, Z. Yao, G. F. Li, G. Y. Fang, H. G. Nie and Z. Liu, ACS Nano, 2012, 6, 205–211 CrossRef CAS PubMed.
- C. H. Choi, S. H. Park and S. I. Woo, Green Chem., 2011, 13, 406–412 RSC.
- J. Liang, Y. Jiao, M. Jaroniec and S. Z. Qiao, Angew. Chem., Int. Ed., 2012, 51, 11496–11500 CrossRef CAS PubMed.
- Z. Liu, H. G. Nie, Z. Yang, J. Zhang, Z. P. Jin and Y. Q. Lu, Nanoscale, 2013, 5, 3283–3288 RSC.
- Y. Wang, D. C. Alsmeyer and R. L. McCreery, Chem. Mater., 1990, 2, 557–563 CrossRef CAS.
- K. Ghosh, M. Kumar, T. Maruyama and Y. Ando, Carbon, 2009, 47, 1565–1575 CrossRef CAS.
- F. Tuinstra and J. L. Koenig, J. Chem. Phys., 1969, 53, 1126–1130 CrossRef.
- Z. Y. Lin, G. H. Waller, Y. Liu, M. L. Liu and C. P. Wong, Carbon, 2013, 53, 130–136 CrossRef CAS.
- W. Yang, T. P. Fellinger and M. Antonietti, J. Am. Chem. Soc., 2011, 133, 206–209 CrossRef CAS PubMed.
- H. Wei, M. W. Xu, S. J. Bao, F. Yanga and H. Chaia, RSC Adv., 2014, 4, 16979–16984 RSC.
- S. A. Wohlgemuth, R. J. White, M. G. Willinger, M. M. Titirici and M. Antonietti, Green Chem., 2012, 14, 1515–1523 RSC.
- C. H. You, S. J. Liao, H. L. Li, S. Y. Hou, H. L. Peng, X. Y. Zeng, F. F. Liu, R. P. Zheng, Z. Y. Fu and Y. W. Li, Carbon, 2014, 69, 294–301 CrossRef CAS.
- W. Ai, Z. M. Luo, J. Jiang, J. H. Zhu, Z. Z. Du, Z. X. Fan, L. H. Xie, H. Zhang, W. Huang and T. Yu, Adv. Mater., 2014, 26, 6186–6192 CrossRef CAS PubMed.
- X. Wang, J. Wang, D. L. Wang, S. Dou, Z. L. Ma, J. H. Wu, L. Tao, A. L. Shen, C. B. Ouyang, Q. H. Liu and S. Y. Wang, Chem. Commun., 2014, 50, 4839–4842 RSC.
- J. X. Xu, Y. Zhao, C. Shen and L. H. Guan, ACS Appl. Mater. Interfaces, 2013, 5, 12594–12601 CAS.
- Z. J. Jiang, Z. Q. Jiang and W. H. Chen, J. Power Sources, 2014, 251, 55–65 CrossRef CAS.
- F. H. B. Lima, M. L. Calegaro and E. A. Ticianelli, J. Electroanal. Chem., 2006, 590, 152–160 CrossRef CAS.
- J. Liu, X. J. Sun, P. Song, Y. W. Zhang, W. Xing and W. L. Xu, Adv. Mater., 2013, 25, 6879–6883 CrossRef CAS PubMed.
- Y. Liu, Y. Y. Wu, G. J. Lv, T. Pu, X. Q. He and L. L. Cui, Electrochim. Acta, 2013, 112, 269–278 CrossRef CAS.
- T. Hagio, M. Nakamizo and K. Kobayashi, Carbon, 1989, 27, 259–263 CrossRef CAS.
- Z. S. Wu, S. B. Yang, Y. Sun, K. Parvez, X. L. Feng and K. Mullen, J. Am. Chem., 2012, 134, 9082–9085 CrossRef CAS PubMed.
| This journal is © The Royal Society of Chemistry 2016 |

