The fabrication of plasmonic nanoparticle-containing multilayer films via a bio-inspired polydopamine coating†
M. Yilmazab,
G. Bakircia,
H. Erdogana,
U. Tamerc and
G. Demirel*a
aBio-inspired Materials Research Laboratory (BIMREL), Department of Chemistry, Gazi University, 06500 Ankara, Turkey. E-mail: nanobiotechnology@gmail.com
bDepartment of Bioengineering, Faculty of Engineering and Architecture, Sinop University, 57000, Sinop, Turkey
cDepartment of Analytical Chemistry, Faculty of Pharmacy, Gazi University, 06330 Ankara, Turkey
First published on 25th January 2016
Abstract
Herein, we introduce a simple approach for the fabrication of plasmonic nanoparticle-containing multilayer films using a bio-inspired polydopamine coating. This fabrication methodology represents a promising new development in the future application of plasmonic films in sensing and catalysis applications.
In the last two decades, the layer-by-layer (LbL) assembly technique has been regarded as a versatile, easy, and inexpensive bottom-up nanofabrication technique for the preparation of ultrathin multilayer films.1 Several studies have been performed to incorporate metallic nanoparticles into LbL thin films for different applications.2 Nanoparticle-containing LbL thin films serve as an ideal nanostructure assembly for creating individual and collective surface plasmon resonances (SPRs) from intralayer or interlayer interparticle interactions.3 The SPRs can be tuned by varying the size, shape and spacing of nanoparticles as well as their external environment.4,5 Unfortunately, the LbL method, usually driven by electrostatic interactions between two components, entails the alternating deposition of oppositely charged thin films of polyelectrolytes on substrates.6 To create nanoparticle-containing LbL films using this technique, the nanoparticles must either have surface charges or be modified using appropriate agents. In most cases, surface modification of nanoparticles is a complicated and time-consuming process, which limits their use in LbL films. Moreover, strong columbic interactions between oppositely charged nanoparticles and polyelectrolytes may also lead to uncontrolled aggregation of nanoparticles, which restricts the use of LbL films in applications such as surface-enhanced Raman spectroscopy (SERS) platforms or heterogeneous catalysis. Therefore, the fabrication of nanoparticle-containing LbL films in a well-controlled manner remains a significant challenge.
Since the seminal work by Messersmith and co-workers,7 the use of polydopamine (PDOP) coatings has attracted increasing interest due to its unique properties. Polydopamine can be deposited on almost all types of inorganic and organic substrates with easily controllable thickness, robust stability, and excellent biocompatibility. Due to the functional groups of PDOP, including catechol, amine and imine, metallic nanoparticles may be easily formed in situ in a controlled manner without the use of any additional reductants or metallic seed particles.8,9 In this study, we propose, for the first time, the application of polydopamine-mediated in situ nanoparticle growth in LbL films to overcome the aforementioned limitations. The fabricated plasmonic nanoparticle-containing multilayer films were utilized for both SERS and heterogeneous catalysis applications.
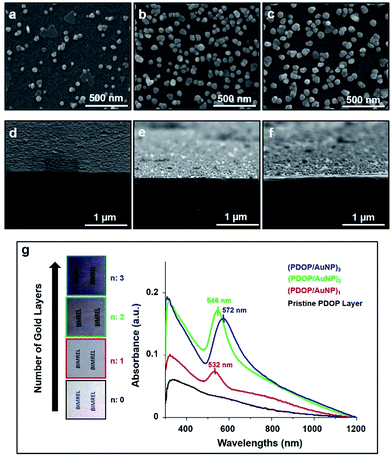
Gold nanoparticle-containing (AuNP) multilayer films were fabricated on a glass substrate via oxidative polymerization of dopamine, which enabled both the formation of polymeric thin films and in situ deposition of AuNPs on a large surface area. For each layer, the deposition time was held constant at 3 h for PDOP film formation and 12 h for the in situ growth of AuNPs. Recently, we demonstrated that a 3 h deposition time for PDOP, which formed an approximately 10 nm-thick layer, was optimal for the reduction and stabilization of metallic nanoparticles.9 Top-view and cross-sectional SEM images of the fabricated AuNP-containing films are presented in Fig. 1. As shown in Fig. 1, the density and average size of the deposited AuNP were found to dramatically change with the number of layers. As expected for the first film layer (PDOP/AuNP)1, a lower nanoparticle density and average nanoparticle size were observed compared with the other layers. The size distribution of AuNPs on this surface ranged from 20 nm to 90 nm (Fig. S1a, ESI†), with an average size of 56.3 nm. Furthermore, we observed that most of the deposited AuNPs (∼80%) were highly separated from each other by an average interparticle distance of approximately 170 nm. However, the rest of the AuNPs (∼20%) produced nanoclusters of two or more nanoparticles within the same layer; these clusters served as sources for collective SPR. When the number of layers increased in the fabricated films, the size of the AuNPs increased, and average particle size ranged from 30 nm to 110 nm for the (PDOP/AuNP)2 film and from 40 nm to 120 nm for the (PDOP/AuNP)3 film (Fig. S1b and S1c, ESI†). The observed morphological differences with layer number are clearly indicative of variations in the AuNP deposition mechanism. For the (PDOP/AuNP)2 and (PDOP/AuNP)3 films, dopamine was first polymerized to form a PDOP film that conformed to and covered the AuNP-deposited PDOP film. These PDOP-coated AuNPs then most likely served as growth centers for subsequent nanoparticle deposition steps, leading to the formation of larger nanoparticles on the surfaces.
For further comparison, AuNP-containing multilayer films were also fabricated using ∼20 nm citrate-stabilized AuNPs (cit-AuNPs) instead of in situ deposition of AuNPs onto PDOP layers. Here, functional groups of PDOP, such as catechol, amine, and imine, serve as anchors for cit-AuNPs. All of these fabricated films exhibited strong adsorption of cit-AuNPs to PDOP films due to favorable coulombic interactions (Fig. S2, ESI†). It was highly reasonable to expect strong ionic interactions between the negatively charged cit-AuNPs and the positively charged PDOP layers. Within a short time (3 h), continuous interacting networks of AuNPs, with occasional larger aggregates, were formed across the surface. It was found that the manipulation of the experimental conditions (i.e., decreasing the cit-AuNP concentration and anchoring time) did not lead to significant changes in the final morphology of the resulting films.
UV-vis absorption spectra of the (PDOP/AuNP)n multilayer films are shown in Fig. 1g. For all of these fabricated films, strong absorption peak maxima were found in the range of 532–572 nm. The (PDOP/AuNP)1 film showed a sharper peak compared to the other films. Interestingly, we did not observe an additional peak or a shoulder, which would have indicated the existence of nanoclusters with two or more nanoparticles within the same layer. This finding was consistent with the unfavorable collective SPR as a result of the low surface coverage and high interparticle distance, as observed by SEM (Fig. 1a–d).3 The emergence of multilayer films lead to obvious red-shifting and broadening, along with increased absorbances in the UV-vis spectra. The peak maxima were observed at 546 nm and 572 nm for (PDOP/AuNP)2 and (PDOP/AuNP)3, respectively. The AuNP-containing multilayer films with a proper interparticle distance produced remarkable collective SPR characteristics due to interlayer resonance phenomenon. In this study, we kept the thickness of each PDOP layer constant at approximately 10 nm, which was much smaller than the average nanoparticles size required to maintain collective SPRs between adjacent layers. In addition, the UV-vis absorption spectra of the (PDOP/cit-AuNP)n thin films exhibited similar red-shift and broadening trends (Fig. S3, ESI†).
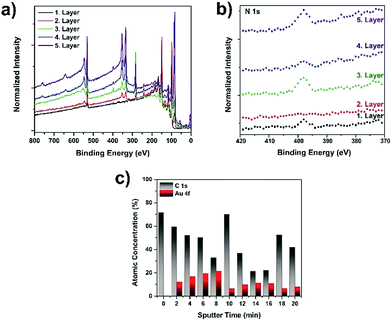
Because of the importance of understanding plasmonic nanoparticle-containing multilayer film formation, we employed X-ray photoelectron spectroscopy (XPS) to demonstrate the multilayer structure of the films. The XPS spectra of the (PDOP/AuNP)n films are shown in Fig. 2a. The binding energies of C 1s, N 1s, and O 1s peaks were 283, 398, and 531 eV, respectively, corresponding to characteristic regions of a PDOP film. Following the in situ growth of AuNPs on PDOP film (PDOP/AuNP)1, the samples demonstrated strong Au 4d3 peaks at 353 eV and Au 4d5 peaks at 334 eV in addition to characteristic PDOP peaks, indicating the deposition of nanoparticles on the PDOP surfaces. Similar XPS spectra were also obtained for the (PDOP/AuNP)2 and (PDOP/AuNP)3 multilayer films. Fig. 2b also shows the changes in the regional N 1s spectra upon the consecutive deposition of AuNP and PDOP layers. The results clearly show that the N 1s peak intensity decreased with the deposition of AuNPs and then increased after PDOP coating. Although these results yielded information regarding the formation of successive multilayers, it remained difficult to distinguish PDOP and AuNP layers in a multiplayer film. Therefore, we also performed XPS depth profile analysis to further characterize the multilayer formation of (PDOP/AuNP)n. By employing argon ion sputtering to slowly remove layers between analysis cycles without damaging the underlying layers, depth-profiling XPS enabled high-resolution chemical analysis of multilayer films. Fig. 2c illustrates the changes in percent atomic concentration of C and Au as a function of the argon sputtering time for a sample having PDOP/AuNPs/PDOP/AuNPs/PDOP layers. The main characteristic of each PDOP layer was the presence of carbon. In the early stages of sputtering, a relatively high C content was observed because the upper surface was completely covered with a thin layer of PDOP. After 2 min of sputtering, the gold profile began to appear and then gradually increased until the underlying PDOP layer was reached. A prolonged sputtering time resulted in consecutive fluctuations between C and gold, indicating the successive fabrication of multilayer films.
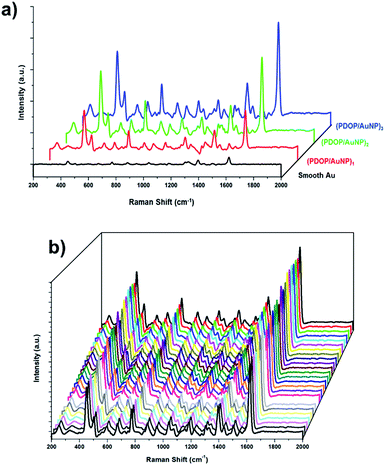
Subsequently, we investigated AuNP-containing multilayer films using SERS experiments. According to theoretical and experimental studies, it was reasonable to expect high local electromagnetic field enhancement from closely packed plasmonic nanoparticles if the interparticle distance was less than the nanoparticle diameter.10–12 García-Vidal and Pendry showed that the average enhancement increased from 103 for “isolated” particles to a maximum of 106 when the neighboring particles were in almost direct contact.12 These types of nanostructures, with well-controlled interparticle distances, could be used as ideal SERS substrates for molecular sensing. In this respect, the SERS activity of the fabricated samples was evaluated using methylene blue (MB) as the Raman reporter molecule. MB SERS spectra collected from multilayer films with different numbers of layers are presented in Fig. 3. For comparison, the spectrum obtained from the smooth surface of a 32 nm-thick Au film is also shown in the same figure. All collected spectra were well-defined and had acceptable signal-to-noise ratios, consistent with our earlier reports for MB.9,10 The most prominent peaks in the spectra of MB were as follows: the ring stretch (γ(C–C)) at 1621 cm−1; symmetric and asymmetric C–N stretches (γsym(C–N) and γasym(C–N)) at 1394 and 1434 cm−1, respectively; and the C–N–C skeletal deformation mode (δ(C–N–C)) at 450 cm−1.
Although most of the deposited AuNPs in the (PDOP/AuNP)1 film were too distant from each other to create electromagnetic enhancement for SERS, a strong SERS signal was still detected (Fig. 3a), possibly due to the formation of nanoclusters as well as the organic semiconductor nature of PDOP. Nanoclusters, in spite of their rare occurrence within the majority of isolated nanoparticles, produced collective SPR and correspondingly led to an electromagnetic enhancement of the Raman scattering. We recently reported the contribution of the PDOP layer to increasing SERS signal intensities by improving photon scattering and promoting electron transfer processes due to its organic semiconductor nature.9 In this respect, we found that SERS intensities reached their maxima with 3 h of PDOP polymerization. Prolonging polymerization time from 3 h to 6 h led to a dramatic decrease in the intensity of the Raman signal. For the multilayer (PDOP/AuNP)2 and (PDOP/AuNP)3 films, additional SERS enhancement was observed compared to the single-layer film ((PDOP/AuNP)1). In those cases, the collective SPR between nanoparticles within adjacent layers was mainly responsible for the generation of hot spots with extremely high electric field enhancement. Furthermore, we calculated the SERS enhancement factors (EF) to quantify and compare the SERS performances of our samples by applying the following eqn (1) and using the MB Raman peak intensity at ∼1621 cm−1:
| EF = (Nbulk × I(PDOP/AuNP)n)/(N(PDOP/AuNP)n × Ibulk) | (1) |
For comparison, we also performed similar Raman measurements to determine the SERS efficiency of (PDOP/AuNP)n multilayer films and compare with the (PDOP/cit-AuNP)n films (Fig. S4, ESI†). In contrast to the (PDOP/AuNP)n films, the employment of colloidal nanoparticles within multilayer films resulted in a lower SERS signal enhancement. This result may be attributed to the uncontrolled aggregation of colloidal nanoparticles onto PDOP layers, which is a common problem that restricts the employment of nanoparticles as an ideal SERS substrate.5,13 The SERS signal intensities of (PDOP/cit-AuNPs)n films were approximately 3.2, 6.4, and 16 times lower than that of (PDOP/AuNP)n films for layer numbers (n) 1, 2, and 3, respectively. For practical SERS applications, this observation clearly demonstrates the importance of controlling the nanoparticle distribution and interparticle distance without the emergence of aggregation. The reproducibility of SERS signals is a major consideration when demonstrating that a system is an ideal SERS substrate. To illustrate the reproducibility of our SERS platform, we collected SERS spectra from 30 randomly selected spots on the (PDOP/AuNP)3 films under identical experimental conditions (Fig. 3b). Clearly, for all measurements, highly reproducible Raman spectra were obtained. We also calculated the relative standard deviation (RSD) for the relevant spectra to characterize and quantify the reproducibility. The RSD values for the intensity changes of the prominent Raman peaks are presented in Table 1. All RSD values were less than 0.16, which clearly demonstrates the acceptable reproducibility across the entire area of the (PDOP/AuNP)3 films.
| Peak position (cm−1) | 1621 | 1394 | 1185 | 773 | 450 |
| RSD value | 0.06 | 0.06 | 0.16 | 0.07 | 0.09 |
Furthermore, we evaluated the catalytic activity of (PDOP/AuNP)n multilayer films in the reduction of 4-nitrophenol (4-NP) to 4-aminophenol (4-AP). Although the catalytic conversion of 4-NP to 4-AP is thermodynamically favorable in the presence of aqueous NaBH4, the kinetic barrier, which arises from the large potential difference between donor BH4- and acceptor 4-NP molecules, hinders the feasibility of this reaction.14 In the presence of metal nanoparticles, electron relay from donor to acceptor molecules was easily actualized. UV-vis spectra for the catalytic reduction of 4-NP using (PDOP/AuNP)n multilayer films are shown in Fig. S5.† The obvious color change as a result of catalytic conversion could be detected even by the naked-eye (Fig. 5a, ESI†). We found that the peak height at 381 nm gradually decreased, and a new peak appeared at 304 nm, indicating the formation of 4-AP. In addition to these, for all of the fabricated films, complete conversion was achieved within 60 min. In the case of (PDOP/AuNP)1, a lower catalytic activity was observed compared to films with a higher layer number (Fig. 5b, ESI†). This low catalytic activity can be attributed to the lower nanoparticle surface coverage. As the number of layers increased, the density of nanoparticles increased; thus, the catalytic conversion ability also increased. Due to their higher nanoparticle coverage, complete catalytic conversion was detected within shorter reaction times (∼10 min) for (PDOP/AuNP)2 and (PDOP/AuNP)3 (Fig. 5c and d, ESI†).
In summary, we have demonstrated a simple and easy method for the fabrication of plasmonic nanoparticle-containing multilayer films through the use of bio-inspired PDOP coatings. The proposed method not only allows for control over nanoparticle size and density but also serves as a promising approach for SERS and catalysis applications.
Acknowledgements
This project was supported by the Scientific and Technological Research Council of Turkey (TUBITAK) Grant Number 114Z296. G. D. acknowledges support from the Turkish Academy of Sciences Distinguished Young Scientist Award (TUBA-GEBIP).Notes and references
- K. Ariga, J. P. Hill and Q. Ji, Phys. Chem. Chem. Phys., 2007, 9, 2319–2340 RSC.
- (a) G. Schneider, G. Decher, N. Nerambourg, R. Praho, M. H. Werts and M. Blanchard-Desce, Nano Lett., 2006, 6, 530–536 CrossRef CAS PubMed; (b) S. Tian, J. Liu, T. Zhu and W. Knoll, Chem. Mater., 2004, 16, 4103–4108 CrossRef CAS; (c) N. A. Kotov, I. Dekany and J. H. Fendler, J. Phys. Chem., 1995, 99, 13065–13069 CrossRef CAS; (d) Z. Liang, K. L. Dzienis, J. Xu and Q. Wang, Adv. Funct. Mater., 2006, 16, 542–548 CrossRef CAS; (e) M. Chen, I. Y. Phang, M. R. Lee, J. K. W. Yang and X. Y. Ling, Langmuir, 2013, 29, 7061–7069 CrossRef CAS PubMed; (f) O. E. Rivera-Betancourt, E. S. Sheppard, D. C. Krause and R. A. Dluhy, Analyst, 2014, 139, 4287–4295 RSC.
- C. Jiang, S. Markutsya and V. V. Tsukruk, Langmuir, 2004, 20, 882–890 CrossRef CAS PubMed.
- K. L. Kelly, E. Coronado, L. L. Zhao and G. C. Schatz, J. Phys. Chem. B, 2003, 107, 668–677 CrossRef CAS.
- J. F. Li, Y. F. Huang, Y. Ding, Z. L. Yang, S. B. Li, X. S. Zhou, F. R. Fan, W. Zhang, Z. Y. Zhou and B. Ren, Nature, 2010, 464, 392–395 CrossRef CAS PubMed.
- J. Zhang, L. Bai, K. Zhang, Z. Cui, G. Zhang and B. Yang, J. Mater. Chem., 2003, 13, 514–517 RSC.
- H. Lee, S. M. Dellatore, W. M. Miller and P. B. Messersmith, Science, 2007, 318, 426–430 CrossRef CAS PubMed.
- Y. Liu, K. Ai and L. Lu, Chem. Rev., 2014, 114, 5057–5115 CrossRef CAS PubMed.
- M. S. Akin, M. Yilmaz, E. Babur, B. Ozdemir, H. Erdogan, U. Tamer and G. Demirel, J. Mater. Chem. B, 2014, 2, 4894–4900 RSC.
- M. Yilmaz, E. Senlik, E. Biskin, M. S. Yavuz, U. Tamer and G. Demirel, Phys. Chem. Chem. Phys., 2014, 16, 5563–5570 RSC.
- X. Hu, W. Cheng, T. Wang, Y. Wang, E. Wang and S. Dong, J. Phys. Chem. B, 2005, 109, 19385–19389 CrossRef CAS PubMed.
- F. J. García-Vidal and J. Pendry, Phys. Rev. Lett., 1996, 77, 1163 CrossRef PubMed.
- M. P. Cecchini, V. A. Turek, J. Paget, A. A. Kornyshev and J. B. Edel, Nat. Mater., 2013, 12, 165–171 CrossRef CAS PubMed.
- A. Gangula, R. Podila, M. Ramakrishna, L. Karanam, C. Janardhana and A. M. Rao, Langmuir, 2011, 27, 15628–15724 CrossRef PubMed.
Footnote |
| † Electronic supplementary information (ESI) available: Experimental details, additional SEM images, UV-vis and Raman spectra of fabricated platforms. See DOI: 10.1039/c5ra22416k |
| This journal is © The Royal Society of Chemistry 2016 |


