Synthesis of nontoxic Co:CuInS2@ZnS nanocrystals with both fluorescence and room temperature ferromagnetism
Jin Shen,
Chunlei Wang*,
Shuhong Xu and
Yiping Cui
Advanced Photonics Center, School of Electronic Science and Engineering, Southeast University, Nanjing, 210096, P. R. China. E-mail: wangchl@seu.edu.cn
First published on 9th February 2016
Abstract
Room temperature ferromagnetism is the precondition of the application of diluted magnetic semiconductors. At present, diluted magnetic nanocrystals (NCs) with room temperature ferromagnetism usually contain toxic elements, such as Cd. In this work, we report nontoxic Co:CuInS2 diluted magnetic NCs, which exhibit room temperature ferromagnetism. After growth of a ZnS shell outside Co:CuInS2 NCs, bright fluorescence can be observed, making as-prepared Co:CuInS2@ZnS NCs with both fluorescence and room temperature ferromagnetism. Besides ZnS shell encapsulation, the preparation of fluorescent–ferromagnetic bi-functional Co:CuInS2@ZnS NCs also relates to the doping amount of Co. Excess Co dopant would quench the fluorescence of the NCs whereas insufficient Co dopant could not offset the diamagnetism of the CuInS2@ZnS NCs. Only under appropriate Co doping do Co:CuInS2@ZnS NCs have both fluorescence and room temperature ferromagnetism.
Introduction
Diluted magnetic semiconductors are combinations of semiconductors and magnetic ions.1,2 They possess a number of unusual optical and electronic properties due to the existence of magnetic ions, such as spin injection,3 the control of magnetism by means of electric fields,4,5 electric currents,6 tunneling anisotropic magnetoresistance in a planar junction7 and in the coulomb blockade regime.8 Diluted magnetic semiconductors have attracted broad attention in applications of the charge and spin in transportation, storage, and processing of information in a single spintronic device. Since most spintronic devices can only be used at room temperature, it is important to prepare diluted magnetic semiconductors with room temperature ferromagnetism.9–20Diluted magnetic NCs, which can be seen as decreasing down the size of diluted magnetic semiconductors to the nanosize scale, can dramatically improve the performance of diluted magnetic semiconductors due to the confinement of electrons in a small region. Nowadays, only a few diluted magnetic NCs can realize room temperature ferromagnetism. Moreover, most of these works used toxic Cd-containing NCs.21–23 In this paper, nontoxic CuInS2 NCs24–26 were used as host materials for a Co dopant. As-prepared Co:CuInS2@ZnS NCs show both fluorescence and room temperature ferromagnetism. The synthesis conditions for realizing fluorescent and ferromagnetic bi-functional properties are discussed.
Experimental section
Materials
Indium(III) acetate (In(OAc)3, 99.99%) was purchased from Alfa Aesar. 1-Dodecanethiol (DDT, 97%) was purchased from Aladdin. Copper(I) iodide (CuI 99.2%) and Co(II) acetate (Co(OAc)2·4H2O 99.2%) were purchased from Sinopharm Chemical Reagent Co., Ltd, China. Zinc acetate (Zn(OAc)2 98%) was purchased from KeLong Chemical Factory, China.Synthesis of Co:CuInS2 NC seeds
Co:CuInS2 NC seeds were prepared according to a slightly modified previously reported method.27–30 In brief, 0.0584 g (0.2 mmol) of In(OAc)3, 0.038 g (0.02 mmol) of CuI, and 0.0025 g (0.01 mmol) of Co(OAc)2·4H2O were mixed with 12 mL of 1-dodecanethiol (molar ratio of Cu![[thin space (1/6-em)]](https://www.rsc.org/images/entities/char_2009.gif) :
:![[thin space (1/6-em)]](https://www.rsc.org/images/entities/char_2009.gif) In
In![[thin space (1/6-em)]](https://www.rsc.org/images/entities/char_2009.gif) :
:![[thin space (1/6-em)]](https://www.rsc.org/images/entities/char_2009.gif) Co = 20
Co = 20![[thin space (1/6-em)]](https://www.rsc.org/images/entities/char_2009.gif) :
:![[thin space (1/6-em)]](https://www.rsc.org/images/entities/char_2009.gif) 20
20![[thin space (1/6-em)]](https://www.rsc.org/images/entities/char_2009.gif) :
:![[thin space (1/6-em)]](https://www.rsc.org/images/entities/char_2009.gif) 1). Then, the mixed solution was added into a three necked flask. Later, it was degassed with nitrogen gas for 30 min. Finally, the reaction solution was heated to 200 °C with nitrogen gas for 2 h. During this process, the reaction mixture changed from turbid to limpid, and the color changed from light purple to dark red (molar ratio of Cu
1). Then, the mixed solution was added into a three necked flask. Later, it was degassed with nitrogen gas for 30 min. Finally, the reaction solution was heated to 200 °C with nitrogen gas for 2 h. During this process, the reaction mixture changed from turbid to limpid, and the color changed from light purple to dark red (molar ratio of Cu![[thin space (1/6-em)]](https://www.rsc.org/images/entities/char_2009.gif) :
:![[thin space (1/6-em)]](https://www.rsc.org/images/entities/char_2009.gif) In
In![[thin space (1/6-em)]](https://www.rsc.org/images/entities/char_2009.gif) :
:![[thin space (1/6-em)]](https://www.rsc.org/images/entities/char_2009.gif) Co = 20
Co = 20![[thin space (1/6-em)]](https://www.rsc.org/images/entities/char_2009.gif) :
:![[thin space (1/6-em)]](https://www.rsc.org/images/entities/char_2009.gif) 20
20![[thin space (1/6-em)]](https://www.rsc.org/images/entities/char_2009.gif) :
:![[thin space (1/6-em)]](https://www.rsc.org/images/entities/char_2009.gif) 1).
1).
Synthesis of Co:CuInS2@ZnS NCs
Co:CuInS2 NC seeds were synthesized using the method mentioned above. Without any purification, 0.183 g (1.0 mmol) of Zn(OAc)2 was added into the reaction mixture at room temperature. Then the reaction mixture was heated to 230 °C with nitrogen gas for 2 h. In this process, the Co:CuInS2 NC seeds were wrapped inside ZnS. Methanol and acetone were mixed with the above solution to make the NCs precipitate. Finally, Co:CuInS2@ZnS NCs were dissolved in cyclohexane for further experiments (molar ratio of Zn![[thin space (1/6-em)]](https://www.rsc.org/images/entities/char_2009.gif) :
:![[thin space (1/6-em)]](https://www.rsc.org/images/entities/char_2009.gif) Cu
Cu![[thin space (1/6-em)]](https://www.rsc.org/images/entities/char_2009.gif) :
:![[thin space (1/6-em)]](https://www.rsc.org/images/entities/char_2009.gif) In
In![[thin space (1/6-em)]](https://www.rsc.org/images/entities/char_2009.gif) :
:![[thin space (1/6-em)]](https://www.rsc.org/images/entities/char_2009.gif) Co = 100
Co = 100![[thin space (1/6-em)]](https://www.rsc.org/images/entities/char_2009.gif) :
:![[thin space (1/6-em)]](https://www.rsc.org/images/entities/char_2009.gif) 20
20![[thin space (1/6-em)]](https://www.rsc.org/images/entities/char_2009.gif) :
:![[thin space (1/6-em)]](https://www.rsc.org/images/entities/char_2009.gif) 20
20![[thin space (1/6-em)]](https://www.rsc.org/images/entities/char_2009.gif) :
:![[thin space (1/6-em)]](https://www.rsc.org/images/entities/char_2009.gif) 1).
1).
Characterization
UV-vis absorption spectra (UV) were recorded with a Shimadzu3600 UV-vis near-infrared spectrophotometer. Fluorescence experiments were performed with a Shimadzu RF-5301 PC spectrofluorimeter. The excitation wavelength was 350 nm. All optical measurements were performed at room temperature under ambient conditions. Transmission electron microscopy (TEM) measurements were recorded using a Tecnai F20 electron microscope with an acceleration voltage of 200 kV. X-ray photoelectron spectroscopy (XPS) was investigated by using a PHI550 spectrometer with Mg Kα excitation (1253.6 eV). The binding energy calibration was based on SiO2 at 103.0 eV. X-ray powder diffraction (XRD) investigations were carried out using a D/max-2500/PC diffractometer with Cu Kα radiation (λ = 0.15418 nm). Inductively coupled plasma atomic emission spectrometry (ICP-AES) results were recorded using an Optima 2000 DV inductively coupled plasma atomic emission spectrometer. The magnetization versus applied field (M–H) hysteresis loops were measured using a vibrating sample magnetometer (VSM) (Lake Shore).Results and discussion
Scheme 1 shows the synthesis process of the Co:CuInS2@ZnS NCs. It mainly contained two steps: synthesis of Co:CuInS2 NCs and the growth of a ZnS shell. In the first step, Co:CuInS2 NCs were synthesized by heating In(OAc)3, Co(OAc)2, CuI and DDT mixture at the temperature of 200 °C. In this process, DDT acted as a sulfur precursor and particle surface capping agent. In the second step, Zn(OAc)2 was added into Co:CuInS2 NCs and followed by heating at 230 °C to form a ZnS shell.Synthesis of luminescent Co:CuInS2@ZnS NCs
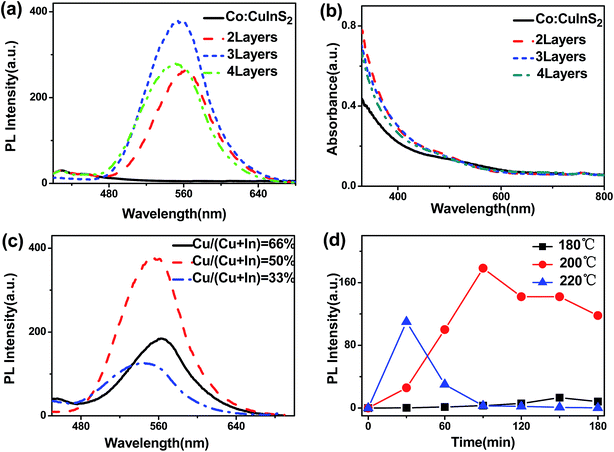
Fig. 1a shows the PL spectra of Co:CuInS2 NCs and Co:CuInS2@ZnS NCs with different ZnS layers. As can be seen, Co:CuInS2 NCs have no obvious emission peak. After ZnS shell growth, bright fluorescence can be observed. According to the PL spectra and absorption spectra, it can be deduced that the observed fluorescence originates from the CuInS2 NCs. The maximal PL intensity of the NCs appears with 3 layers of ZnS. More or less ZnS shells lead to decreasing PL intensity. The possible reason is the reduced CuInS2 surface defects at the optimal ZnS shell thickness. If there is no ZnS shell, the large CuInS2 surface defects lead to quenched emission. If the ZnS shell is too thick (more than 3 layers), the increased core–shell lattice stress promotes the generation of more defects. Similar conclusions have been reported in other type-I core/shell systems with ZnS shells.31Fig. 1c shows PL spectra of Co:CuInS2@ZnS NCs (ZnS shell is 3 layers) with different Cu/In feed ratios. The total feed amount of Cu + In remains constant, while the decreased Cu feed ratio leads to a slight emission blue shift (from 545 nm to 555 nm). This is caused by the composition-dependent band gap for ternary QDs.32 The maximal PL intensity appears at a Cu feed ratio of 50%, which was selected as the default Cu feed ratio.
Fig. 1d shows PL spectra of CuInS2 NCs under different growth times and temperatures (Cu feed ratio of 50%). Since Co:CuInS2 NCs have no fluorescence, Co was not doped inside the NCs for investigation of the best growth conditions of CuInS2 NCs. Three temperatures, including 180 °C, 200 °C and 220 °C, were used for CuInS2 growth. It can be found that the PL intensity reached a maximum under the conditions of 90 min growth at 200 °C.
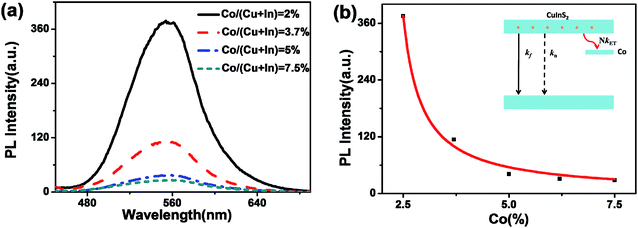
Fig. 2a and b show PL spectra and the relationship between the PL peak intensity of Co:CuInS2@ZnS NCs with different Co doping concentrations. With an increased Co doping amount, the fluorescence of the CuInS2 NCs gradually decreased. The energy level diagram of the Co:CuInS2 NCs is shown in Fig. 2b.21 Thus, the emission quantum yields (QY) of the CuInS2 NCs can by expressed by:
| QY = kf/(kf + kn + NkET) | (1) |
Structure and chemical composition of Co:CuInS2@ZnS NCs
TEM images for the Co:CuInS2 NCs seeds and Co:CuInS2@ZnS NCs in Fig. 3 show quasi-spherical morphology. The average diameter of the Co:CuInS2 NCs seeds increases from 1.8 nm to 2.7 nm upon ZnS coating, which supports formation of an outer ZnS shell. The thickness of ZnS is about 0.9 nm.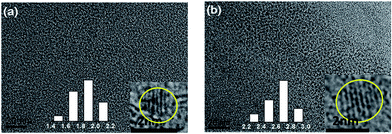 | ||
| Fig. 3 TEM, HRTEM (inset) and size distribution images of samples (inset) with a 2% Co doping ratio for the, (a) Co:CuInS2 NCs core, (b) Co:CuInS2@ZnS NCs. | ||
Fig. 4a shows the results of XRD with different Co amounts, which have three obvious diffraction peaks, respectively corresponding to the (112), (220), and (311) planes of the CuInS2 NCs. In contrast to the bulk CuInS2 crystal (bottom line), the diffraction peaks of the Co:CuInS2@ZnS NCs exhibit a slight shift towards bulk ZnS. This is caused by the formation of a ZnS shell outside the Co:CuInS2 NCs. Moreover, with the increase of the Co doping amount, the diffraction peaks of the CuInS2 NCs shift to larger angles. Fig. 4b shows the diffraction pattern (220) peak position with the increase of Co concentration. Since the ZnS shells are the same as those in NCs with Co doping amounts of 2%, 3.7%, and 5%, the red shifted diffraction peak in Fig. 4b is caused by Co doping. According to the previous literature,33,34 the smaller ionic radii of Co(II) (74 pm) than Cu(I) (94 pm) and In(III) (80 pm) can reduce the lattice spaces, resulting in red shifted XRD patterns. Besides, no Co metal clusters, Co sulfide or Co oxide were observed in the XRD patterns. This implies that doped Co is dispersed atomically in the structure of the host CuInS2@ZnS NCs.
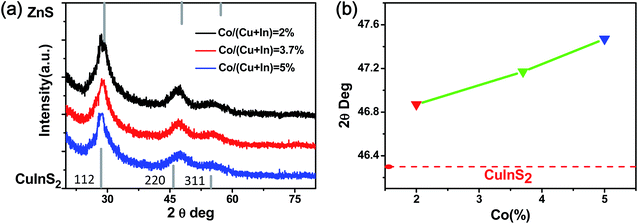 | ||
| Fig. 4 (a) XRD pattern of the Co:CuInS2@ZnS NCs with different Co doping ratios. (b) The relationship between the diffraction pattern for the (220) peak position and the concentration of doped Co. | ||
Fig. 5 shows the XPS for the Co:CuInS2@ZnS NCs with 2% Co doping. The survey scan in Fig. 5a shows the main composition of the NCs is S, C, In, Zn, O, Co, and Cu. Note that O should come from absorbed oxygen during XPS measurements. The narrow scan result in Fig. 5b shows two peaks at 932.4 eV and 952.2 eV, which correspond to the 2p energy level of Cu+. The peaks at 443.0 eV and 451.5 eV correspond to the 3d energy level of In3+, whereas the peaks at 779.6 eV and 796.4 eV correspond to the 2p energy level of Co2+.35–37 No signal for metallic cobalt is observed in Fig. 5d. Since XPS shows an extremely large error for the doped Co amount, ICP-AES was used to measure the accurate chemical composition of the NCs. As shown in Table 1, the measured Co doping amounts are about 1.8%, 3.9%, 4.5% for NCs with Co feed ratios of 2%, 3.7%, and 5%, respectively. The result shows that almost all of the fed Co ions are doped inside the NCs.
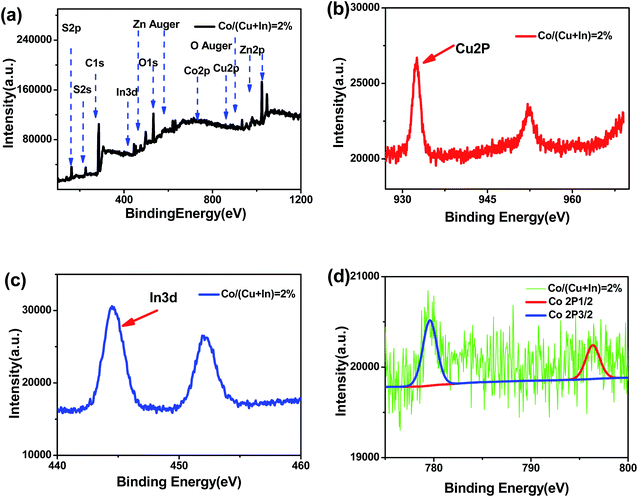 | ||
| Fig. 5 XPS spectrum of the Co:CuInS2@ZnS NCs. (a) XPS spectrum of 2% Co. (b) XPS spectrum of Cu. (c) XPS spectrum of In. (d) General XPS spectrum of the Co:CuInS2@ZnS NCs. | ||
| Co feed ratio | Cu | In | Co | Co/(Cu + In) |
|---|---|---|---|---|
| 2% | 1 | 1.87 | 0.052 | 1.8% |
| 3.7% | 1 | 1.83 | 0.111 | 3.9% |
| 5% | 1 | 1.78 | 0.124 | 4.5% |
Magnetic properties
To understand the temperature dependent magnetization, the field cooling (FC) method was used in an applied field of 1000 Oe. Fig. 6a shows FC from 200 to 400 K. We can see from Fig. 6a that the transition is from ferromagnetism to paramagnetism. According to the derivative between magnetisation and temperature, the Curies temperature for the transition from ferromagnetism to paramagnetism is above 300 K.38–40 Obviously, Co:CuInS2@ZnS NCs possibly appear ferromagnetism at room temperature.Fig. 6b shows the magnetic hysteresis loops of Co:CuInS2@ZnS NCs with different Co doping ratios at room temperature. Due to the centrosymmetric curve, we only analyzed the positive axis. In the present work, pure CuInS2@ZnS NCs show diamagnetism at 2500–10![[thin space (1/6-em)]](https://www.rsc.org/images/entities/char_2009.gif) 000 G. This can be explained by the diamagnetism of Cu(I) in CuInS2@ZnS NCs as suggested by XPS.41 At low magnetic field (0–2500 G), CuInS2@ZnS NCs appeared weakly magnetic. This is caused by some intrinsic mechanism such as exchange interaction between cupric ions (Cu+) according to the standard viewpoint.41
000 G. This can be explained by the diamagnetism of Cu(I) in CuInS2@ZnS NCs as suggested by XPS.41 At low magnetic field (0–2500 G), CuInS2@ZnS NCs appeared weakly magnetic. This is caused by some intrinsic mechanism such as exchange interaction between cupric ions (Cu+) according to the standard viewpoint.41
Different from pure CuInS2@ZnS NCs, the doping of Co can change the magnetic properties of the NCs. With a 2% Co doping ratio, Co:CuInS2@ZnS NCs shows room temperature ferromagnetism. The magnetization decreased at 5000–10![[thin space (1/6-em)]](https://www.rsc.org/images/entities/char_2009.gif) 000 G, which is caused by the diamagnetism of CuInS2@ZnS NCs. With the increase of Co doping from 3.7% to 5%, the magnetization of the magnetic field at 5000–10
000 G, which is caused by the diamagnetism of CuInS2@ZnS NCs. With the increase of Co doping from 3.7% to 5%, the magnetization of the magnetic field at 5000–10![[thin space (1/6-em)]](https://www.rsc.org/images/entities/char_2009.gif) 000 G is enhanced. It demonstrates that the increase of Co ion magnetism would offset the diamagnetism of the CuInS2@ZnS NCs. The maximal magnetization of the NCs appears at 5% Co. In this case, the saturation of magnetization is observed with 13.457 × 10⁻³ emu (Table 2). When the Co doping ratio is 10%, the magnetisation of the NCs is less than that of the 5% Co doped NCs.
000 G is enhanced. It demonstrates that the increase of Co ion magnetism would offset the diamagnetism of the CuInS2@ZnS NCs. The maximal magnetization of the NCs appears at 5% Co. In this case, the saturation of magnetization is observed with 13.457 × 10⁻³ emu (Table 2). When the Co doping ratio is 10%, the magnetisation of the NCs is less than that of the 5% Co doped NCs.
| Co doping | Saturation (Ms) | Retentivity (Mr) | Coercivity (Hs) |
|---|---|---|---|
| 2% | 4.996 × 10⁻³ emu | 631.5 × 10⁻⁶ emu g−1 | 125.99 G |
| 3.7% | 5.2603 × 10⁻³ emu | 547.9 × 10⁻⁶ emu g−1 | 99.661 G |
| 5% | 13.457 × 10⁻³ emu | 1210 × 10−6 emu g−1 | 131.32 G |
| 10% | 11.744 × 10⁻³ emu | 952.2 × 10⁻⁶ emu g−1 | 48.205 G |
On the basis of the aforementioned results, we would like to discuss the ferromagnetism of Co:CuInS2@ZnS NCs as below.
(1) Fig. 6b indicates that the origin of the room temperature ferromagnetism is from the Co. Moreover, Co presents a manner of doping inside the NCs rather than a manner of Co secondary phase separation from the host NCs. There are two items of proof for the present state of Co inside the NCs. First, the relation between NC fluorescence intensity and the amount of Co in Fig. 2 matches well with the formula QY = kf/(kf + kn + NkET). This is solid proof for the presence of Co inside the NCs instead of forming a secondary Co phase separate from the NCs. If Co is formed alone, the fluorescence of the CuInS2@ZnS NCs will not be fitted by the aforementioned equation. Second, according to the reference viewpoint,35,38 XRD and XPS can be used for excluding the influence of a Co secondary phase. If a Co secondary phase formed, a signal of the Co secondary phase should be seen in the XRD and XPS. In our work, we do not see diffraction peaks of a Co secondary phase in the XRD. Moreover, the possibility of the existence of a Co secondary phrase can be also removed through analyzing elemental valence via XPS. The result of XPS manifests that Co exists inside the Co:CuInS2@ZnS NCs in the form of Co2+ rather than Co metal clusters.38 According to the two aspects above, we maintain that Co:CuInS2@ZnS NCs possesses intrinsic ferromagnetic ordering.
(2) The Co doping amount-dependent ferromagnetism of the NCs can be explained by the increased magnetic ions and exchange interactions. Since the ferromagnetism of the NCs comes from Co doping, it is easy to comprehend that the ferromagnetism of the NCs increased with the increase of the Co doping amount from 0 to 5% in Fig. 6b. In comparison, the increased amount of magnetic Co ions inside the NCs also leads to decreased Co ion distance. This will result in increased Co–Co exchange interactions and decreased ferromagnetism according to Bound Magnetic Polaron theory.42 This should be the reason for the decreased ferromagnetism of the NCs with a Co doping amount of 10%.
Conclusions
In summary, fluorescent and room temperature ferromagnetic bi-functional Co:CuInS2@ZnS NCs were synthesized through controlling the Co doping ratio and ZnS shell thickness. Our results indicate that Co can introduce a dopant energy level in the forbidden band of CuInS2 NCs, leading to quenched NC fluorescence with increased Co doping amount. The as-prepared Co:CuInS2@ZnS NCs may have both fluorescence and room temperature ferromagnetism only when the Co doping amounts are between 2 and 5%. Different from traditional Cd-containing room temperature ferromagnetic NCs, Co:CuInS2@ZnS NCs have no toxicity. These materials are suitable for the preparation of Cd-forbidden spintronic devices.Acknowledgements
This work is supported by the National Key Basic Research Program of China (Grant No. 2015CB352002), the National Natural Science Foundation of China (Grant No. 61475034, 21403034, 61177033), the Fundamental Research Funds for the Central Universities (No. 2242014R30006), and the Natural Science Foundation of Jiangsu Province Youth Fund (No. BK20140650), the China Postdoctoral Science Foundation (No. 2014M560370, 2015T80477), and the Jiangsu Planned Projects for Postdoctoral Research Funds (No. 1401035B).References
- J. K. Furdyna, J. Appl. Phys., 1988, 64, R29–R64 CrossRef CAS.
- S. A. Wolf, D. D. Awschalom, R. A. Buhrman, J. M. Daughton, S. vonMolnar, M. L. Roukes, A. Y. Chtchelkanova and D. M. Treger, Science, 2001, 294, 1488–1495 CrossRef CAS PubMed.
- Y. Ohno, D. K. Young, B. Beschoten, F. Matsukura, H. Ohno and D. D. Awschalom, Nature, 1999, 402, 790–792 CrossRef CAS.
- H. Ohno, D. Chiba and F. Matsukura, Nature, 2000, 408, 944–946 CrossRef CAS PubMed.
- M. Yamanouchi, D. Chiba, F. Matsukura and H. Ohno, Nature, 2008, 455, 515–518 CrossRef PubMed.
- A. Chernyshov, M. Overby, X. Liu, J. K. Furdyna and Y. Lyanda-Geller, Nat. Phys., 2009, 5, 656–659 CrossRef CAS.
- C. Gould, et al., Phys. Rev. Lett., 2004, 93, 117203 CrossRef CAS PubMed.
- J. Wunderlich, T. Jungwirth and B. Kaestner, Phys. Rev. Lett., 2006, 97, 077201 CrossRef CAS PubMed.
- X. Liang, P. Guo, G. Wang, R. Deng, D. Pan and X. Wei, RSC Adv., 2012, 2, 5044–5046 RSC.
- B. Choudhury, R. Verma and A. Choudhury, RSC Adv., 2014, 4, 29314–29323 RSC.
- H. Luan, C. Zhang, F. Li, P. Li, M. Ren, M. Yuan, W. Ji and P. Wang, RSC Adv., 2014, 4, 9602–9607 RSC.
- S. Kumar, N. Tiwari, S. N. Jha, S. Chatterjee, D. Bhattacharyya, N. K. Sahoo and A. K. Ghosh, RSC Adv., 2015, 5, 94658–94669 RSC.
- L. Turyanska, R. J. A. Hill, O. Makarovsky, F. Moro, A. N. Knott, O. J. Larkin, A. Patane, A. Meanry, P. C. M. Christianen, M. W. Fay and R. J. Curry, Nanoscale, 2014, 6, 8919–8925 RSC.
- M. I. B. Bernardi, A. Mesquita, F. Beron, K. R. Pirota, A. O. de Zevallos, A. C. Doriguetto and H. B. de Carvalho, Phys. Chem. Chem. Phys., 2015, 17, 3072–3080 RSC.
- A. Bonanni and T. Dietl, Chem. Soc. Rev., 2010, 39, 528–539 RSC.
- E. S. Freitas Neto, N. O. Dantas, S. A. Lourenco, M. D. Teodoro and G. E. Marques, Phys. Chem. Chem. Phys., 2012, 14, 3248–3255 RSC.
- J. T. Wright, D. Su, T. V. Buuren and R. W. Meulenberg, J. Mater. Chem. C, 2014, 2, 8313–8321 RSC.
- I. Djerdj, Z. Jaglicic, D. Arcon and M. Niederberger, Nanoscale, 2010, 2, 1096–1104 RSC.
- V. P. Thakare, O. S. Game and S. B. Ogale, J. Mater. Chem. C, 2013, 1, 1545–1557 RSC.
- T. S. Atabaev, O. S. Jin, J. H. Lee, D. Han, H. H. T. Vu, Y. Hwang and H. Kim, RSC Adv., 2012, 2, 9495–9501 RSC.
- P. I. Archer, S. A. Santangelo and D. R. Gamelin, J. Am. Chem. Soc., 2007, 129, 9809–9840 CrossRef PubMed.
- N. S. Norberg, G. L. Parks, G. M. Salley and D. R. Gamelin, J. Am. Chem. Soc., 2006, 128, 13195–13203 CrossRef CAS PubMed.
- L. J. Hill, N. E. Richey, Y. Sung, P. T. Dirlam, J. J. Griebel, I. Shim, N. Pinna, M. Willinger, W. Vogel, K. Char and J. Pyun, CrystEngComm, 2014, 16, 9461–9468 RSC.
- H. Z. Zhong, Y. Zhou, M. F. Ye, Y. J. He, J. P. Ye, C. He, C. H. Yang and Y. F. Li, Chem. Mater., 2008, 20, 6434–6443 CrossRef CAS.
- H. Z. Zhong, S. S. Lo, T. Mirkovic, Y. C. Li, Y. Q. Ding, Y. F. Li and G. D. Scholes, ACS Nano, 2010, 4, 5253–5261 CrossRef CAS PubMed.
- T. Omata, K. Nose and S. Otsuka-Yao-Matsuo, J. Appl. Phys., 2009, 105, 073106 CrossRef.
- W. Han, L. Yi, N. Zhao, A. Tang, M. Gao and Z. Tang, J. Am. Chem. Soc., 2008, 130, 13152–13213 CrossRef CAS PubMed.
- L. Li, T. Daou, I. Texier, T. Chi, N. Liem and P. Reiss, Chem. Mater., 2009, 21, 2422–2431 CrossRef CAS.
- D. Ke, H. Li, C. Liu, Y. Hou and M. Gao, Biomaterials, 2014, 35, 1608–1617 CrossRef PubMed.
- L. Li, A. Pandey, D. Werder, B. Khanal, J. Pietryga and V. Klimov, J. Am. Chem. Soc., 2011, 133, 1176–1185 CrossRef CAS PubMed.
- A. Aboulaich, L. Balan, J. Ghanbaja, G. Medjahdi and R. Schneider, Chem. Mater., 2011, 23, 3706–3713 CrossRef CAS.
- B. Chen, H. Zhong, W. Zhang, Z. Tan, Y. Li, C. Yu, T. Zhai, Y. Bando, S. Yang and B. Zou, Adv. Funct. Mater., 2012, 22, 2081–2088 CrossRef CAS.
- L. Saravanan, A. Pandurangan and R. Jayavel, J. Nanopart. Res., 2011, 13, 1621–1628 CrossRef CAS.
- K. Hanif and R. Meulenberg, J. Am. Chem. Soc., 2002, 124, 11495–11502 CrossRef CAS PubMed.
- T. Hu, M. Zhang, S. Wang, Q. Shi, G. Cui and S. Sun, CrystEngComm, 2011, 13, 5646–5649 RSC.
- C. C. Wang, M. Liu, B. Y. Man, C. S. Chen, S. Z. Jiang, S. Y. Yang, X. G. Gao, S. C. Xu, B. Hu, Z. C. Sun, J. J. Guo and J. Hou, AIP Adv., 2012, 2, 012182 CrossRef.
- P. Chuang, C. Lin and R. Liu, ACS Appl. Mater. Interfaces, 2014, 6, 15379–15387 CAS.
- J. Ning, G. Xiao, C. Wang, B. Liu, G. Zou and B. Zou, CrystEngComm, 2013, 15, 3734–3738 RSC.
- J. Li, X. Zeng, G. Wu and Z. Xu, CrystEngComm, 2012, 14, 525–532 RSC.
- T. Yang, H. Yang, P. Wang, R. Zhao, C. Xiao, S. Wang, B. Xiao, Z. Li and M. Zhang, RSC Adv., 2014, 4, 33645–33650 RSC.
- D. Ni, J. Li, H. Bo, D. Jin, X. Peng, X. Wang, H. Ge and H. Jin, J. Nanopart. Res., 2015, 17, 191–202 CrossRef.
- A. Kaminiski and S. Das Sarma, Phys. Rev. Lett., 2002, 88, 247202 CrossRef PubMed.
| This journal is © The Royal Society of Chemistry 2016 |


