On-line UV-NIR spectroscopy as a process analytical technology (PAT) tool for on-line and real-time monitoring of the extraction process of Coptis Rhizome
Xuezhi Daia,
Hang Songa,
Wen Liua,
Shun Yaoa and
Gang Wang*ab
aSchool of Chemical Engineering, Sichuan University, Chengdu 610065, China
bDepartment of Pharmacy, Zunyi Medical College, Zunyi 563003, China. E-mail: wg8855350@163.com
First published on 15th January 2016
Abstract
An on-line ultraviolet-near infrared (UV-NIR) spectroscopy-based method for on-line and real-time monitoring of the extraction process of Coptis Rhizome was proposed. Two fiber optic probes were designed to transmit NIR radiation through a pathlength flow cell to the NIR spectrometer for collecting spectra in real-time. Partial least squares regression (PLSR) calibration model of berberine concentration was established and validated. The correlation coefficient (R) and root mean square error of calibration (RMSEC) for the calibration set were 0.9968 and 0.0253 mg mL−1, and the R and root mean square error of prediction (RMSEP) for the validation set were 0.9970 and 0.0242 mg mL−1, respectively. This proved that the calibration model had good performance. The established model was used for on-line and real-time monitoring of the extraction process of Coptis Rhizome with satisfactory results. Both the moving block of standard deviation (MBSD) and relative concentration changing rate (RCCR) methods were used to identify the end point of extraction process. The results demonstrate that the proposed method and established model can provided instant feedback of indicator concentration in the extraction process of herbal medicines.
Introduction
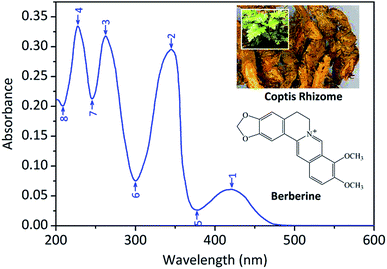
The roots and stems of Coptis chinensis Franch. (Coptis Rhizome) is often used to relieve internal fever based on the traditional Chinese medical theory.1 Modern pharmaceutical theory has proved that the alkaloids from Coptis Rhizome have medicine functions such as anti-bacterial, anti-virus, anti-inflammatory and lowering blood pressure.2 Berberine (Fig. 1), coptisine, palmatine, jatrorrhizine and ferulic acid are the main symbolic compounds in Coptis Rhizome. As a principal bioactive constituent in Coptis Rhizome, berberine has been indicated to reduce blood lipid and cure the diabetes.3Extract active compounds from raw materials is one of the most important steps in pharmaceutical manufacturing. In traditional Chinese medicine (TCM) pharmaceutical industry, the extraction process of herbal medicine is often ended when it reaches the stipulated extraction time, ignoring the effects of operating environmental and fluctuation of the quality of raw material.4 Food and Drug Administration (FDA) has been issued a significant guidance regarding the implementation of process analytical technology (PAT) for the pharmaceutical industry in 2004.5 In order to consistent with the PAT initiative of FDA and make sure the stability and the uniformity of the final products, it is necessary to detect the extraction process and record the parameters in time through online non-destructive methods.6 With the rapid development of computer technology and automatic control technology, the on-line detection can be achieved in pharmaceutical production.7 And current production of natural medicine also uses sensor technology to monitor the feeding amounts, extraction time, concentration degree, pH value, system temperature and other useful parameters.
NIR spectroscopy is being applied in the TCM pharmaceutical industry as an efficient technique for raw material testing, online process monitoring and product quality control in recent years.8–10 The increasing level of success and succeeding implementation of NIR is probably a direct result of its advantages over other analytical techniques, these advantages include outstanding sensitivity, simple sample preparation, non-destructive test and multi-constituent analysis of complex matrix.11,12 Traditionally, on-line NIR spectroscopy is often used in combination with an off-line HPLC or GC validated assay,13–16 the results of these off-line analysis methods are accurate and reliable. However, off-line validation often needs a lot of material, manpower and time. In order to make best use of time, save materials and streamline operations, the traditional off-line analysis method was replaced by on-line UV detection in the work presented here. The on-line UV measurement could be used as reference of on-line NIR prediction, which has been proved to have stability methodology before the NIR test.
Infrared spectroscopy is a widely used tool for qualitative characterization of materials and, to a lesser extent, for qualitative analysis also. Because the signals of IR spectra are caused by substance-specific vibration modes of the molecules they can readily be attributed to functional groups. However, infrared spectra obtained from aqueous solutions are generally of rather poor quality, due to the strong interference of water absorbance bands with vibrational modes of the target compounds. Additionally, quantitative analysis is usually rather difficult. Raman spectroscopy is more advantageous in aqueous systems, because excitation of the Raman signal generally takes place in the visible region and thus does not interfere with water. However, high-quality spectra are rarely obtained in aqueous solutions, because of the weak Raman effect and a non-optimal signal-to-noise ratio at low concentrations. In comparison with NIR and Raman spectroscopy, UV spectroscopy is much more sensitive in aqueous solutions, because water is almost transparent in the spectral region between 200 and 800 nm. The absorption coefficients in the UV range can be very high, thus the sensitivity is also excellent. Light sources and detectors are easily available and measurements with high signal-to-noise ratio are possible. The use of fibre optics renders the hardware setups are highly flexible and stable. Furthermore, the cost of ownership of a UV system is significantly lower than NIR and Raman spectroscopy.
In this study, the UV-NIR spectroscopy was used for on-line and non-destructive analysis in an extraction process of the powdered Coptis Rhizome. To our best knowledge, there has been no research reported on the new application of on-line UV-NIR spectroscopy in the extraction process of Coptis Rhizome. Berberine was selected as the representative quality indicator of Coptis Rhizome extraction process. The content information of berberine was interrelated with calibration model established with the PLSR method. The model was improved with the optimization of spectral data pretreatment methods, wavenumber intervals adopted and the optimum number of PLSR factors. The performance of calibration model was evaluated with R, RMSEC in the calibration step and with R, RMSEP in the validation step, respectively. The relative standard error of prediction (RSEP) was used to assess the performance of the calibration model when using for on-line and real-time monitoring of the extraction process of Coptis Rhizome. In addition, MBSD and RCCR methods were used to determine the end point of extraction process. The results can provide useful information for similar extraction research of natural bioactive compounds.
Experimental
Reagents and solutions
All chemicals used (berberine standards, HPLC ≥ 98.0%; sulfuric acid, 98.0%) were purchased from Kelong Chemical Reagent Co., Ltd. (Chengdu, China). 0.40% sulfuric acid solution was prepared by dissolving an appropriate amount of 98.0% sulfuric acid in deionized water.Instruments
NIR spectrometer (NIRQUEST512), deuterium light source (DH-2000-BAL) and fiber optic probes (T300-UV-VIS) were obtained from Ocean Optics (Dunedin, USA). Norprene chemical tube (AD300007) was purchased from Saint Gobain Co., Ltd. (FRA). The reference assays and the reliability of NIR were investigated using an UV-Vis spectrophotometer (UV2800S, SYHP Co., Ltd. China) and an ultraviolet spectrometer (TBD-2000, Tauto Biotech. Co., Ltd. China) equipped with a SpectraSuite software package (Ocean Optics, Dunedin, USA), respectively. The grinder (FW135) used to crush Coptis Rhizome was purchased from Taisite Co., Ltd. (Tianjin, China).NIR spectroscopic data collection
Coptis Rhizome was supplied by Tongrentang drugstore (Chengdu, China) and powdered into 1–2 mm particles. The schematic of experimental device used in our work is shown in Fig. 2. Extraction of Coptis Rhizome powder was carried out in a 1000 mL three-necked flask, which was filled with 500 mL 0.4% sulfuric acid solution. 100 g powdered samples were charged into the sulfuric acid solution, extracted and refluxed at 363.15 K according to the ref. 17. Two fiber optic probes were designed to transmit NIR radiation to a NIRQUEST512 spectrometer, the NIR spectra of extracts were collected on-line during the extraction process. Meanwhile, a TBD-2000 ultraviolet spectrometer was used to collect the UV absorbance of berberine and the results were used as reference data for NIR analysis. The influences of solid impurities, bubbles and flow rate of extracts passing through the flow cell on the collected NIR spectra cannot be ignored.13,18 In order to eliminate the influences of solid impurities, the extracts were passed through a 100 mesh gauze in-line filters and absorbent cotton before entering the circulation loop. Meanwhile, the peristaltic pump was designed in front of the flow cell in the circulation loop, which was adjusted with the stable flow rate about 0.5 mL s−1 through repeated experiments to meet the requirement of ideal on-line detection. Moreover, the NIR spectroscopy detection system was located beside the circulation loop to slow down the flow rate of extracts passing through the flow cell and reduce its influence on NIR spectra. The extracts were continuously pumped through the flow cell during the collection of spectral data and the flow rate monitored by the flow meter was 0.2 mL s−1.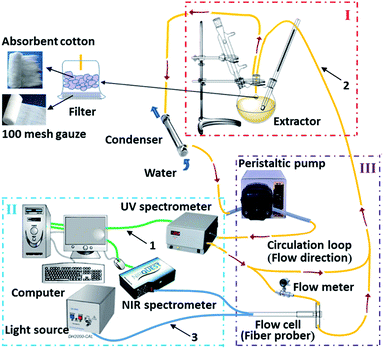 | ||
| Fig. 2 The schematic of experimental device. (I) Extracting unit; (II) analysing unit; (III) sampling unit; 1, USB signal line; 2, PTEF tube; 3, optical fiber. | ||
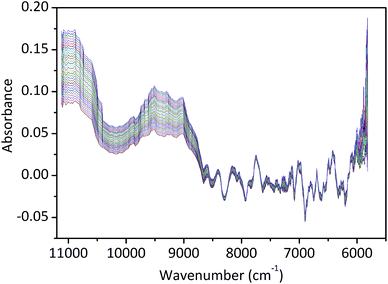
The NIR spectra of the extracts were collected at 4 cm−1 interval over the spectral region 5800–11![[thin space (1/6-em)]](https://www.rsc.org/images/entities/char_2009.gif) 200 cm−1 and 0.4% of sulfuric acid was used as a reference. The NIR spectral data of the extraction process which were used as the calibration set for the model development were collected 3 replications continuously once every 20 s, and each spectrum data of the sample was obtained by averaging the data of 3 scans. The NIR spectral data of validation set which were performed for the validation of the model were collected continuously once every 1 min in another batch extraction process, each spectrum data of the sample was also an average of 3 scans.19 The original NIR spectra of extracts were shown in Fig. 3.
200 cm−1 and 0.4% of sulfuric acid was used as a reference. The NIR spectral data of the extraction process which were used as the calibration set for the model development were collected 3 replications continuously once every 20 s, and each spectrum data of the sample was obtained by averaging the data of 3 scans. The NIR spectral data of validation set which were performed for the validation of the model were collected continuously once every 1 min in another batch extraction process, each spectrum data of the sample was also an average of 3 scans.19 The original NIR spectra of extracts were shown in Fig. 3.
As shown in Fig. 3, it is difficult to find the difference in the raw NIR spectra due to the high degree of band overlapping. However, some characteristic absorption peaks can be viewed and interpreted. Stretching first overtone of C–H bands in aromatic rings, also probably of C–H bands in pyridine ring (5935 cm−1) and with water traces present also the first overtone of O–H stretching bands of water (6879 cm−1), which are typical of the NIR spectra of an aqueous solution.
Reference assays
In order to confirm the feasibility and reliability of on-line UV measurement, before the NIR testing, the on-line UV method was validated through determining the concentration of berberine according to the previous study.20 For the on-line UV monitoring method validation, an off-line UV2800S UV-Vis spectrophotometer (Photometric noise 0.0005A, baseline drift 0.0005 A h−1 (500 nm, 0Abs)) and an on-line TBD-2000 ultraviolet spectrometer (photometric noise ≤ 0.0004 A, baseline drift 0.002 A h−1) were used to establish the calibration curve of berberine and to obtain the on-line UV absorbance of berberine, respectively. Since the detection limit of instruments (triple the noise signal) are both substantially less than the berberine levels encountered. Thus, the UV-Vis spectrophotometer and ultraviolet spectrometer used are suitable for determining the berberine.The berberine standard solution (50 mg mL−1) used for establishing calibration curve was prepared by adding alkaloid standard berberine to a 0.4% sulfuric acid solution. Then the berberine standard solution was pumped through the circulation loop and measured by the on-line UV detector. The stability was investigated at room temperature by analysing the same standard solution once every 2 h within 8 h, using 0.4% sulfuric acid solution as the blank control. Furthermore, the recovery was determined by accurately adding berberine standard solution to Coptis Rhizome extracts (v/v, 1![[thin space (1/6-em)]](https://www.rsc.org/images/entities/char_2009.gif) :
:![[thin space (1/6-em)]](https://www.rsc.org/images/entities/char_2009.gif) 1) of known concentration (50.27 mg mL−1). And the repeatability of the method was tested by analysing six individual prepared berberine standard solutions.
1) of known concentration (50.27 mg mL−1). And the repeatability of the method was tested by analysing six individual prepared berberine standard solutions.
Data processing
All the computations, including data acquisition, spectral preprocessing and data analysis (including PLSR, MBSD and RCCR), were implemented using SpectraSuite (Ocean Optics, Dunedin, USA), OPUS software (version 6.5, Bruker Optics Inc., MA, USA) and Matlab (version 7.5, MathWorks, Inc., Natick, MA, USA), respectively.The original NIR spectral data were manipulated through identifying the optimal spectral regions and selecting appropriate pretreatment methods, and then the processed spectral data were correlated with the data measured by the reference assays using PLSR to establish calibration model.21 In PLSR algorithm, the relevant information is decreasing and the irrelative information is increasing along with a higher number of PLSR factors, leading to an optimum PLSR factors number. Factors greater or less than the optimum number introduce in the model will cause “over-fitting” or “under-fitting” phenomenon, both of which will reduce the prediction accuracy of the established model.9 In the present study, PLSR model with 0–12 factors was investigated, the predicted residual error sum of squares (PRESS) was used to choose the optimum factor numbers of PLSR model.22
The performance of the calibration model was assessed in terms of R, RMSEC, RMSECV and relative standard error of prediction (RSEP).23–26 An optimal calibration models should have high R, low RMSEC and RMSECV values with the least difference between RMSEC and RMSECV. Besides, the predictive ability of the established PLSR model was assessed in terms of RSEP.27
Results and discussion
Results of UV reference assays
The numbers 1 to 4 and 5 to 8 in Fig. 1 represent the peaks and valleys of UV spectrum, respectively. The UV-Vis spectrophotometric detection wavelength was set at 345 nm based on the result of UV spectrum of berberine (see Fig. 1). The UV-Vis absorbance data of berberine was measured accurately and used to determine the calibration curve, which showed a good linearity range between the concentrations from (14 to 140) μg mL−1. The linear regression equation and R2 were as follows:| y = 3.5695 × 10⁻⁶x − 2.1829 × 10⁻⁴ (R2 = 0.9995) |
According to the procedures described in the part of Reference assays, the relative standard derivation (RSD) value of stability test was 0.18% (n = 6), which demonstrating that the on-line UV detection has good stability. The recovery varied from 97.23% to 101.26% for berberine, the average recovery and RSD values were 98.80% and 1.68% (n = 6), respectively. This indicated that the recovery analysis has good performance. Besides, the calculated RSD value being 1.47% for repeatability test (n = 6), which shows that, the proposed on-line UV detection has good repeatability. The above method validation work demonstrates that the on-line UV analytical method was feasible and credible.
Model development
Fig. 3 shows the NIR spectra of Coptis Rhizome extract samples, the spectra in this study were divided into six regions, 5810–6250, 6250–7143, 7143–7692, 7692–9091, 9091–10![[thin space (1/6-em)]](https://www.rsc.org/images/entities/char_2009.gif) 000, 10
000, 10![[thin space (1/6-em)]](https://www.rsc.org/images/entities/char_2009.gif) 000–11
000–11![[thin space (1/6-em)]](https://www.rsc.org/images/entities/char_2009.gif) 125 cm−1. Since the region of 5810–6100 cm−1 exhibits high degree of band overlapping, thus, this range was unsuitable for the calibration. Influences of different NIR spectral regions on the performance of PLSR model are shown in Table 1. According to the results, the spectral intervals selected for the calibration model of berberine were 6250–7143 cm−1 and 7692–9091 cm−1, which presented better performance than other regions.
125 cm−1. Since the region of 5810–6100 cm−1 exhibits high degree of band overlapping, thus, this range was unsuitable for the calibration. Influences of different NIR spectral regions on the performance of PLSR model are shown in Table 1. According to the results, the spectral intervals selected for the calibration model of berberine were 6250–7143 cm−1 and 7692–9091 cm−1, which presented better performance than other regions.
| Spectral region (cm−1) | R | RMSEC | RMSECV | RSEP% |
|---|---|---|---|---|
5810–11![[thin space (1/6-em)]](https://www.rsc.org/images/entities/char_2009.gif) 125 125 |
0.9956 | 0.0260 | 0.0311 | 2.71 |
| 5810–6250 | 0.9826 | 0.0584 | 0.0782 | 6.58 |
| 6250–6670 | 0.9922 | 0.0393 | 0.0513 | 4.45 |
| 6670–7143 | 0.9960 | 0.0281 | 0.0318 | 2.08 |
| 6250–7143 | 0.9963 | 0.0269 | 0.0302 | 1.70 |
| 7143–7692 | 0.9940 | 0.0342 | 0.0428 | 3.54 |
| 7692–8330 | 0.9954 | 0.0369 | 0.0443 | 2.92 |
| 8830–9091 | 0.9931 | 0.0302 | 0.0376 | 4.03 |
| 7692–9091 | 0.9957 | 0.0291 | 0.0319 | 2.53 |
9091–10![[thin space (1/6-em)]](https://www.rsc.org/images/entities/char_2009.gif) 000 000 |
0.9927 | 0.0378 | 0.0491 | 4.27 |
10![[thin space (1/6-em)]](https://www.rsc.org/images/entities/char_2009.gif) 000–11 000–11![[thin space (1/6-em)]](https://www.rsc.org/images/entities/char_2009.gif) 125 125 |
0.9880 | 0.0485 | 0.0655 | 5.31 |
| 6250–7143, 7692–9091 | 0.9967 | 0.0253 | 0.0264 | 1.37 |
Influence of different spectral pretreatments on the performance of PLSR model is shown in Table 2. MWS and SNV showed better performance, due to their advantages in spectral preprocessing. The “MWS + SNV” combination yield the highest R, the lowest RMSEC and RMSECV values with the least difference between RMSEC and RMSECV. Therefore, “MWS + SNV” method was selected to pretreat the spectra.
| Pretreatment methods | R | RMSEC | RMSECV | RSEP% |
|---|---|---|---|---|
| No treatment | 0.9948 | 0.0317 | 0.0371 | 3.06 |
| MWS | 0.9907 | 0.0291 | 0.0341 | 4.10 |
| SG | 0.9907 | 0.0292 | 0.0362 | 4.25 |
| 1D | 0.9939 | 0.2854 | 0.3404 | 3.32 |
| 2D | 0.9952 | 0.0305 | 0.0345 | 2.67 |
| MSC | 0.9888 | 0.0470 | 0.0620 | 4.92 |
| MSC + 1D | 0.9876 | 0.0494 | 0.0654 | 5.43 |
| MSC + 2D | 0.9898 | 0.0449 | 0.0579 | 4.71 |
| SNV | 0.9913 | 0.0268 | 0.0302 | 3.76 |
| SNV + 1D | 0.9913 | 0.0415 | 0.0503 | 3.95 |
| SNV + 2D | 0.9953 | 0.0289 | 0.0324 | 2.53 |
| MWS + SNV | 0.9966 | 0.0260 | 0.0272 | 1.73 |
| SG + SNV | 0.9955 | 0.2705 | 0.3005 | 2.36 |
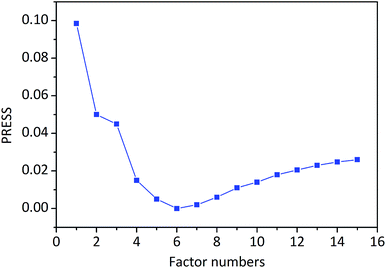
The PLSR reduces the dimensionality of the spectra data through the calculation of PLSR factor numbers, which explain the maximum amount of variability in the data. The irrelevant information is increasing, and the relevant information is descending along with a higher number of PLSR factors, leading to an optimum PLSR factor numbers. In other words, only the first few factors capture most of the variation in the original variables while the reaming factors describe random noise or linear dependencies between the variables. The dependency of PRESS on the PLSR factors number for calibration of berberine is shown in Fig. 4. It can be seen that the PRESS values of the former six factors were gradually decreased, which demonstrating that the related information of berberine was increasing. When the number of factors was greater than 6, the PRESS values were gradually increased, which indicated that the irrelevant information of berberine was increasing. So the optimal number of PLSR factors was determined to be 6.
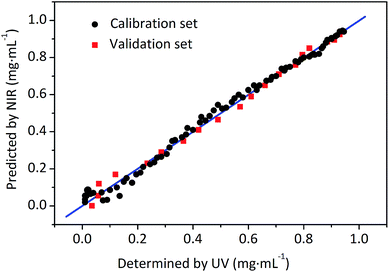
In accordance with the most suitable conditions for the calibration model building as mentioned above, the calibration model was established by PLSR.33 The regression plots between the on-line UV measured and NIR predicted values in calibration set and validation set are depicted in Fig. 5. The R and RMSEC for the calibration set of berberine were 0.9968 and 0.0253 mg mL−1, and the R and RMSEP for the validation set were 0.9970 and 0.0242 mg mL−1, respectively. It can be concluded that the established model exhibit satisfactory fitting results and predictive ability, indicating that the method to monitor extraction process by UV-NIR on-line could be realized using the developed quantitative NIR models.
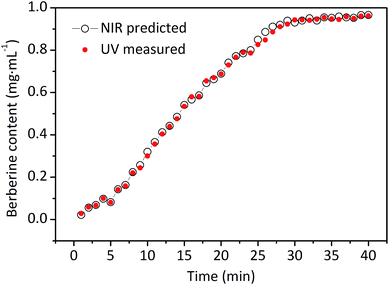
The berberine concentration scanned by on-line NIR and the reference assays measured by on-line UV during a representative extraction process are shown in Fig. 6. It can be seen from Fig. 6 that the trends of concentration variables predicted by NIR in real-time and the on-line UV reference assays are well superimposed, both tended to balance after about 35 min. The RESP value was 2.80%, which indicated that the results predicted by the NIR were highly similar to the reference assays measured by on-line UV detector. Moreover, the accuracy and reproducibility of proposed method also depend on the stability of UV-NIR instrument. In our study, RSEP was employed to inspect the stability of UV-NIR instrument.27 Unknown samples were collected from thirty new extraction batches of Coptis Rhizome at intervals of 1 h. All the RSEP values of berberine concentration in these samples determined with the NIR and the UV reference assays are lower than 5%, this indicates that the proposed method has satisfactory accuracy and reproducibility.
Rapid determination of extraction end point
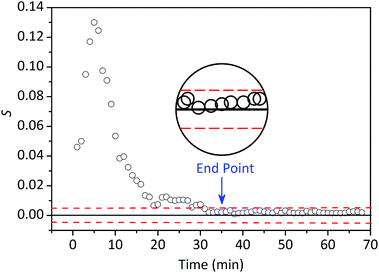
At present, the methods used in NIR analytical techniques to determine the end point of extraction process typically include Mean Square of Differences (MSD), Absolute Distance of Standard Deviation (ADSD),34 MBSD35–37 and RCCR.38 In this study, the on-line UV-NIR method was used to judge the end of Coptis Rhizome extraction process, MBSD and RCCR methods were used to monitor the extraction process and determine the end point, respectively.The spectral regions of interest (6250–7143 cm−1 and 7692–9091 cm−1) were pretreated by “MWS + SNV” combination method to determine the end point of a typical extraction process. The area of each region was integrated. Eqn (1) offers a vector consisting of the Si (S.D.), and then the mean S.D. (S) between n spectra recorded at n consecutive times could be calculated. Shifting the spectral set by one position in time and calculations are repeated in the next step.
 | (1) |
 | (2) |
The time evolution of the value of S during a typical extraction process is shown in Fig. 7. High S values demonstrated that the concentrations of the components in extracts fluctuated visibly during the initial stage of the extraction process. Slight fluctuation exhibited based on the low and virtually constant S values, it was concluded that the Coptis Rhizome extraction process reached the end point after about 35 min. This is consistent with the stipulated extraction time of TCM pharmaceutical industry. The value of S vibrations fluctuates between 0 and 0.005 in the later stage of repeated batch extractions process. Therefore, the extraction end point was considered to be reached if successive S values fall into and remain inside 0.005 (the dashed line in Fig. 7) within a period of ∼10 min.
 | (3) |
The time evolutions of the RCCR value of berberine, calculated from the values predicted by NIR and measured by UV are shown in Fig. 8. The result was generally in agreement with the results determined by the MBSD method. In this study, the appropriate threshold value of ±1% was determined after repeated batch extractions. Therefore, the end point of extraction is considered to be reached if successive RCCR values fall into and remain inside ±1% (the dashed line in Fig. 8) within a period of ∼10 min.
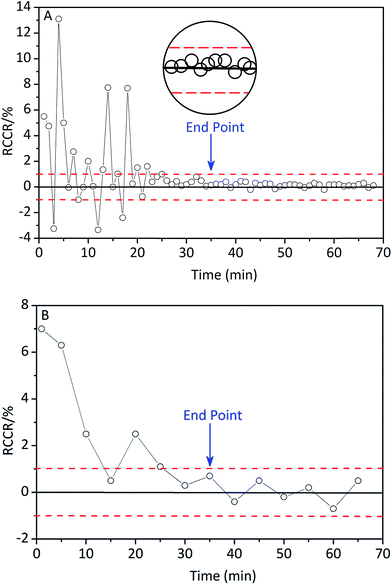 | ||
| Fig. 8 Time evolution of the RCCR value of berberine, calculated from the values predicted by NIR (A) and measured by on-line UV detector (B). | ||
It means that both MBSD and RCCR are suitable for judging the end point of extraction. Both of them are conducted simply, and the results are reliable.
Conclusions
In this study, an on-line UV-NIR spectroscopy-based method was proposed for on-line and real-time monitoring of the extraction process of Coptis Rhizome, and the on-line UV measurement was used as the reference for the method. The developed NIR calibration model was validated to obtain satisfactory performance and successfully applied to monitoring the extraction process of Coptis Rhizome in real-time. In addition, the MBSD and RCCR methods allowed rapid determination of the end point of extraction process. The developed method can significantly save time, materials and manpower. This successful on-line UV-NIR spectroscopy-based method could be possibly applied in other TCM extraction process for time and cost reduction.Acknowledgements
Preparation of this paper was supported by National Scientific Foundation of China (No. 81373284) and 2013 scientific research foundation of Sichuan University for Outstanding Young Scholars.Notes and references
- C. L. Sun, J. Li, X. Wang, W. J. Duan, T. Y. Zhang and Y. Ito, J. Chromatogr. A, 2014, 1370, 156–161 CrossRef CAS.
- J. Tang, Y. B. Feng, S. Tsao, N. Wang, R. Curtain and Y. W. Wang, J. Ethnopharmacol., 2009, 126, 5–17 CrossRef CAS PubMed.
- M. Čerňáková and D. Košťálová, Folia Microbiol., 2002, 47, 375–378 CrossRef.
- J. S. Li and B. Zhang, Pharmacol. Pharm., 2014, 5, 356–363 CrossRef.
- Food and Drug Administration (FDA), Guidance for Industry, PAT: A Framework for Innovative Pharmaceutical Development Manufacturing and Quality Assurance.
- H. X. Huang and H. B. Qu, Anal. Chim. Acta, 2011, 707, 47–56 CrossRef CAS PubMed.
- C. Schaefer, C. Lecomte, D. Clicq, A. Merschaert, E. Norrant and F. Fotiadu, J. Pharmaceut. Biomed., 2013, 83, 194–201 CrossRef CAS PubMed.
- W. L. Li, L. H. Xing, Y. Cai and H. B. Qu, Vib. Spectrosc., 2011, 55, 58–64 CrossRef CAS.
- W. L. Li, L. H. Xing, L. M. Fang, J. Wang and H. B. Qu, J. Pharmaceut. Biomed., 2010, 53, 350–358 CrossRef CAS PubMed.
- Y. W. Wu, S. Q. Sun, Q. Zhou and H. W. Leung, J. Pharmaceut. Biomed., 2008, 46, 498–504 CrossRef CAS PubMed.
- P. Roychoudhury, R. O'Kennedy, B. McNeil and L. M. Harvey, Anal. Chim. Acta, 2007, 590, 110–117 CrossRef CAS.
- G. Reich, Adv. Drug Delivery Rev., 2005, 57, 1109–1143 CrossRef CAS PubMed.
- Y. Y. Zhang, J. W. Zhang and Y. Liu, Chin. J. Pharm., 2010, 41, 662–665 CAS.
- Y. J. Wu, Y. Jin, H. Y. Ding, L. J. Luan, Y. Chen and X. S. Liu, Spectrochim. Acta, Part A, 2011, 79, 934–939 CrossRef CAS PubMed.
- Guide, I. C. H, “Q2B. Validation of analytical procedures: Methodology.” International Conference on Harmonization. Fed. Reg. (62 FR 2643), 1997.
- L. S. Pan, X. Y. Lv and P. D. Wu, Nat. Prod. Res. Dev., 2006, 18, 105–107 CAS.
- L. Li, Chem. Ind. Times, 2008, 22, 37–41 CAS.
- A. F. Santos, F. M. Silva, M. K. Lenzi and J. C. Pinto, Polym.-Plast. Technol. Eng., 2005, 44, 1–61 CrossRef CAS.
- G. Lachenal, A. Pierre and N. Poisson, Micron, 1996, 27, 329–334 CrossRef CAS.
- J. P. Collman, Z. Wang, C. Linde, L. Fu, L. Dang and J. I. Brauman, Chem. Commun., 1999, 18, 1783–1784 RSC.
- H. Martens and M. Martens, Food Qual. Prefer., 2000, 11, 5–16 CrossRef.
- C. O. Chan, C. C. Chu, D. K. W. Mok and F. T. Chau, Anal. Chim. Acta, 2007, 592, 121–131 CrossRef CAS PubMed.
- M. Otto and W. Wegscheider, Anal. Chem., 1985, 57, 63–69 CrossRef CAS.
- M. Blanco, J. Coello, H. Iturriaga, S. Maspoch and J. Pages, Chemom. Intell. Lab. Syst., 2000, 50, 75–82 CrossRef CAS.
- B. H. Mevik and H. R. Cederkvist, J. Chemom., 2004, 18, 422–429 CrossRef CAS.
- D. Xiang, J. Berry, S. Buntz, P. Gargiulo, J. Cheney, Y. Joshi, B. Wabuyele, H. Q. Wu, M. Hamed, A. S. Hussain and M. A. Khan, J. Pharm. Sci., 2009, 98, 1155–1166 CrossRef CAS PubMed.
- M. Blanco and A. Peguero, Talanta, 2008, 77, 647–651 CrossRef CAS.
- Q. J. Han, H. L. Wu, C. B. Cai, L. Xu and R. Q. Yu, Anal. Chim. Acta, 2008, 612, 121–125 CrossRef CAS PubMed.
- H. S. Guo, J. M. Chen, T. Pan, J. H. Wang and G. Cao, Anal. Methods, 2014, 6, 8810–8816 RSC.
- J. P. Conzen, Multivariate Calibration. A Practical Guide for Developing Methods in the Quantitative Analytical Chemistry, Bruker Optik, Germany, 2003 Search PubMed.
- H. M. Heise and R. Winzen, Fundamental chemometric methods, in Near Infrared Spectroscopy: Principles, Instruments, Applications, ed. H. W. Siesler, Y. Ozaki, S. Kawata, H. M. Heise, Wiley-VCH Verlag GmbH, Weinheim, 2002, pp. 125–162 Search PubMed.
- A. J. A. Santos, O. Anjos, R. Simōes, J. Rodrigues and H. Pereira, BioResources, 2014, 9, 6735–6744 Search PubMed.
- N. Wang, X. X. Zhang, Z. Yu, G. D. Li and B. Zhou, J. Anal. Methods Chem., 2014, 393596, DOI:10.1155/2014/393596.
- M. Blanco, R. C. Mestanza and J. Cruz, Anal. Methods, 2012, 4, 2694–2703 RSC.
- G. J. Vergote, T. R. M. D. Beer, C. Vervaet, J. P. Remon, W. R. G. Baeyens, N. Diericx and F. Verpoort, Eur. J. Pharmacol., 2004, 21, 479–485 CrossRef CAS.
- H. Q. Wu and M. A. Khan, J. Pharm. Sci., 2009, 98, 2784–2798 CrossRef CAS PubMed.
- O. Scheibelhofer, N. Balak, P. R. Wahl, D. M. Koller, B. J. Glasser and J. G. Khinast, AAPS PharmSciTech, 2013, 14, 234–244 CrossRef CAS PubMed.
- B. Igne, S. Talwar, J. K. Drennen III and C. A. Anderson, J. Pharm. Sci. Innovation, 2013, 8, 45–55 CrossRef.
| This journal is © The Royal Society of Chemistry 2016 |

