Electrospun carbon nano-felt derived from alkali lignin for cost-effective counter electrodes of dye-sensitized solar cells
Xiaojing Maa,
Hytham Elbohybd,
Sudhan Sigdelb,
Chuilin Laic,
Qiquan Qiao*b and
Hao Fong*ac
aProgram of Nanoscience and Nanoengineering, South Dakota School of Mines and Technology, 501 East Saint Joseph Street, Rapid City, SD 57701, USA. E-mail: Hao.Fong@sdsmt.edu; Fax: +1-605-394-1232; Tel: +1-605-394-1229
bCenter for Advanced Photovoltaics, Department of Electrical Engineering and Computer Science, South Dakota State University, 219 DEH, Brookings, SD 57007, USA. E-mail: Qiquan.Qiao@sdstate.edu; Fax: +1-605-688-4401; Tel: +1-605-688-6965
cProgram of Materials Engineering and Science, South Dakota School of Mines and Technology, 501 East Saint Joseph Street, Rapid City, SD 57701, USA
dDepartment of Physics, Faculty of Science, Damietta University, New Damietta City, 57314, Egypt
First published on 22nd January 2016
Abstract
In this study, freestanding and mechanically flexible nano-felt consisting of electrospun carbon nanofibers (ECNFs) derived from alkali lignin with a BET specific surface area of ∼583 cm2 g−1 and average pore size of ∼3.5 nm was prepared and then surface-deposited with Pt nanoparticles (Pt NPs). Both nano-felts of ECNFs and ECNFs–Pt were studied as cost-effective counter electrodes of dye-sensitized solar cells (DSSCs). The energy-dispersive X-ray spectroscopy (EDS) results showed that the amount of Pt NPs in ECNFs–Pt nano-felt was ∼9.9 wt%, and the scanning electron microscopy (SEM), transmission electron microscopy (TEM), and X-ray diffraction (XRD) results indicated that the Pt NPs with small sizes in the range of 2–20 nm were randomly distributed on the surface of ECNFs. The electrochemical impedance spectroscopy (EIS) tests revealed that the ECNFs-based counter electrode had low charge transfer resistance (Rct = 1.94 Ω cm2), and the Rct value was reduced to 1.2 Ω cm2 upon surface-deposition of Pt NPs. The prototype DSSCs based on ECNFs and ECNFs–Pt counter electrodes exhibited comparable performances to the DSSC based on a conventional Pt counter electrode in terms of short circuit density (Jsc), open circuit voltage (Voc), fill factor (FF), and energy conversion efficiency (η).
Introduction
Since reported by O'Regan and Gratzel in 1991, dye-sensitized solar cells (DSSCs) have attracted growing interests as important alternatives to conventional silicon-based solar cells due to low cost, simple fabrication process, and high energy conversion efficiency.1–6 In general, a DSSC is composed of three main components including a dye-sensitized photoanode, an electrolyte containing a redox couple such as iodide/triiodide (I−/I3−), and a counter electrode. The photoanode can be made of a thin layer of transparent conducting oxide (TCO) on a glass substrate, and the TCO layer is typically coated with a porous film of semiconductor nanoparticles (e.g., the nanoparticles of anatase-phase TiO2).7,8 Upon illumination with sunlight, the dye molecules adsorbed on the surface of TiO2 will acquire energy and become excited; thereafter, photoelectrons will be generated and then injected into the photoanode. Subsequently, the photoelectrons move to the counter electrode through an external circuit; and the reduction of I3− into I− occurs through obtaining electrons from the counter electrode, thus completing an electrical circuit.9–12The fundamental role of counter electrode in a DSSC is to catalyze the reduction of I3− into I−. Presently, thermally prepared Pt counter electrodes have been widely adopted in DSSCs due to excellent electrocatalytic performance/efficiency of Pt towards the reduction of I3− into I−.13–16 However, the high cost of Pt limits/hinders commercial applications of DSSCs; note that the cost-effectiveness is expected to be a major advantage of DSSCs. Furthermore, the corrosive I−/I3− redox couple can lead to the decrease of Pt's electrocatalytic activity with prolonging the application time, thus reducing the long-term stability/performance of DSSCs.17–20 To resolve/mitigate this problem, research endeavors have been devoted to the development of electrolyte-resistant and Pt-free counter electrodes with reasonably high electrocatalytic performance/efficiency.21,22 Numerous studies have repeatedly demonstrated that cost-effective carbon-based materials including graphite,23,24 carbon black,25,26 carbon nanotubes,27,28 carbon nanofibers,29,30 mesoporous carbon,31,32 activated carbon,33 graphene,34,35 and hard carbon spherules36 could have similar electrocatalytic performances to Pt for the reduction of I3− into I−; additionally, these carbon-based materials also possess high resistivity against corrosion of the electrolyte.9,18,37 Therefore, the complete or partial replacement of Pt with carbon-based materials could be a promising approach for making cost-effective and electrolyte-resistant counter electrodes of DSSCs with comparable efficiency/performance.22,36
The materials-processing technique of electrospinning provides a convenient approach to produce fibers with diameters typically being hundreds of nanometers (commonly known as electrospun nanofibers).38,39 Recently, electrospun carbon nanofibers (ECNFs) in the form of overlaid mats/felts have been demonstrated the potential application as novel supports of electrocatalysts owing to large specific surface area, desired nanofibrous structure, superior electrical conductivity, and high resistance against corrosive electrolyte.40 In a previous publication, we have reported that the mechanically flexible nano-felts consisting of randomly overlaid ECNFs could be prepared by electrospinning aqueous mixtures of a natural product of alkali lignin together with polyvinyl alcohol (PVA) into composite nanofiber mats followed by thermal treatments of stabilization in air and carbonization in inert environment.41 Compared to other carbon-based materials, the lignin-derived nano-felts of ECNFs possess the following advantages: (1) the abundance of lignin as a by-product of cellulose processing, thus the utilization of lignin as carbon source is cost-effective and environmentally friendly; (2) the Brunauer–Emmett–Teller (BET) specific surface areas of lignin-derived ECNF nano-felts can be very large (e.g., ∼583 m2 g−1) without any additional physical/chemical activation treatments. Note that this is several orders of magnitude larger than the BET specific surface areas of conventional carbon fibers and polyacrylonitrile-derived ECNFs mats without activation. The highly porous structure suggests that these ECNFs possess a large number of reduction sites, thus could mitigate the agglomeration of Pt nanoparticles (Pt NPs) during the surface-deposition process; (3) the lignin-derived ECNFs nano-felts are highly graphitic, hence their resistance against the corrosive electrolytes in DSSCs would be excellent; (4) these nano-felts are freestanding, thus could be used as counter electrode without any binding agents;41 and (5) the lignin-derived ECNFs nano-felts are also mechanically flexible, which may provide a promising approach for the fabrication of flexible DSSCs.
In this study, the freestanding and mechanically flexible nano-felt consisting of lignin-derived ECNFs was prepared first; subsequently, the nano-felt was surface-deposited with a small amount of Pt NPs via the wet-chemistry reactions. Thereafter, the counter electrodes of DSSCs were fabricated by using ECNFs, ECNFs–Pt, and (conventional) thermally prepared Pt; and the prototype DSSCs were then assembled and tested. The results indicated that the prototype DSSCs based on ECNFs and ECNFs–Pt counter electrodes had comparable/similar performances to the device based on conventional Pt counter electrode in terms of short circuit current density (Jsc), open circuit voltage (Voc), fill factor (FF), and energy conversion efficiency (η). Furthermore, the results acquired from electrochemical measurements revealed that the ECNFs and ECNFs–Pt counter electrodes exhibited low charge transfer resistance (Rct), large capacitance (C), and high electrocatalytic efficiency towards the reduction of I3− into I−, indicating that both ECNFs and ECNFs–Pt nano-felts could be utilized as cost-effective counter electrodes of DSSCs.
Experimental
Preparation of ECNFs and ECNFs–Pt nano-felts
The ECNFs nano-felt was prepared by electrospinning an aqueous mixture containing a natural product of alkali lignin (purchased from Sigma-Aldrich) together with PVA (purchased from Sigma-Aldrich) into composite nanofibrous mat followed by stabilization in air and carbonization in argon.41 Prior to electrospinning, 2.52 g alkali lignin was first separated into 27 g distilled water; 1.08 g PVA was then dissolved in the prepared lignin aqueous mixture at 75 °C under the constant stirring condition for 4 h. The resulting spin dope was subsequently loaded into a 30 mL BD Luer-Lok™ plastic syringe having a stainless-steel needle with 18 gauge 90° blunt end. During electrospinning, a positive voltage of 26 kV was applied to the needle by using an ES30P high voltage DC power supply, purchased from the Gamma High Voltage Research, Inc. (Ormond Beach, FL); and the feeding rate of spin dope was maintained at 1.2 mL h−1 by using a KDS-200 syringe pump purchased from the KD Scientific Inc. (Holliston, MA). The lignin/PVA composite nanofibers were collected as overlaid mat on the electrically grounded aluminum foil that covered a laboratory-produced roller with diameter of 25 cm, and the distance between aluminum foil and the tip of needle was set as 25 cm. The lignin/PVA composite nanofiber mat was finally peeled off from the aluminum foil and stored in a desiccator before subsequent stabilization and carbonization.Prior to thermal treatments, a lignin/PVA composite nanofiber mat was first wrapped onto a stainless steel rod. The stabilization was then conducted in a Lindberg 54453 heavy duty tube furnace purchased from the TPS Co. (Watertown, WI) with the following procedure: (1) the temperature was increased from 25 to 100 °C at 10 °C min−1; (2) the temperature was remained at 100 °C for 1 h; (3) the temperature was increased from 100 to 180 °C at 1 °C min−1; (4) the temperature was remained at 180 °C for 16 h; (5) the temperature was increased from 180 to 220 °C at 0.5 °C min−1; (6) the temperature was remained at 220 °C for 8 h; and (7) the sample was cooled down to room temperature. A constant air flow was maintained through the tube during the stabilization process. The stabilized nanofiber mat was then unwrapped from the stainless steel rod for the subsequent carbonization by using the following procedure: (1) the temperature was increased from 25 to 1200 °C at 5 °C min−1; (2) the temperature was maintained at 1200 °C for 1 h; and (3) the sample was cooled down to room temperature. A constant argon flow was maintained through the tube during the carbonization process.
For surface-deposition of lignin-derived ECNFs nano-felt with Pt NPs, an ECNFs nano-felt (0.05 g) was immersed into 10 mL of 0.002 M H2PtCl6 aqueous solution for 24 h; subsequently, 10 mL of 0.02 M NaBH4 (i.e., reducing agent) aqueous solution was added dropwise into the above mixture (with the total time period of ∼20 min). The mixture was then kept at room temperature for 3 h to complete the reduction of H2PtCl6. The resulting nano-felt (i.e., ECNFs–Pt nano-felt) was rinsed with distilled water for 3 times and then dried at 60 °C in a vacuum oven.
Fabrication of counter electrodes
Prior to the fabrication of counter electrodes, ECNFs and ECNFs–Pt nano-felts were first ground into tiny pieces. Subsequently, the powder-like ECNFs or ECNFs–Pt samples (0.1 g) were mixed with adequate amount of deionized (DI) water and carboxymethyl cellulose (0.0071 g) followed by sonication. The resulting paste was then doctor bladed onto the fluorine-doped tin dioxide substrate (FTO, with the values of resistance and thickness being ∼8 Ω sq−1 and 400 nm, respectively); and the counter electrodes were heat-treated at 60 °C for 12 h. For comparison, conventional Pt counter electrode was fabricated by spin coating of 0.02 M H2PtCl6·6H2O in ethanol onto FTO substrate followed by being annealed at 400 °C for 15 min. Note that the Pt amount in the ECNFs–Pt counter electrode was <10 wt% of that in the conventional Pt counter electrode, as evidenced by thermogravimetric analysis (results not shown).Assembly of DSSCs
To assemble DSSCs, an FTO substrate was first spin-coated with a compact layer of TiO2 (with particle sizes being tens of nanometers); the TiCl4 treated nanocrystalline TiO2 layer (Solaronix Ti-Nanoxide HT/SP) and light-scattering layer (Dyesol WER4-0) were then deposited. Subsequently, it was sintered at 475 °C for 1 h followed by being immersed in 0.25 mM Ruthenizer 535-bisTBA dye (Solaronix N-719) in acetonitrile/valeronitrile (volume ratio: 1/1) for 24 h; thereafter, the photoanode was rinsed with acetonitrile twice and then dried in air. Finally, the photoanode was assembled with each of the previously fabricated counter electrodes by using a thermoplastic sealant; and the I−/I3− electrolyte was then injected into the cells through the reserved channel. The details on the assembly of DSSCs were also reported in our previous publications.42–45 Note that in this study, 4 replicates of DSSCs were assembled from each counter electrode (i.e., ECNFs, ECNFs–Pt, and Pt).Characterization and evaluation
A Zeiss Supra 40VP field-emission SEM and a JEOL JEM-2100 TEM were employed to examine the morphological and microstructural properties of ECNFs and ECNFs–Pt nano-felts. The average diameters of ECNFs and Pt NPs were measured by using the Images J software. The XRD patterns were acquired from a Rigaku Ultima Plus X-ray diffractometer operated at 40 kV and 90 mA with CuKα radiation (λ = 1.54 Å), and they were recorded from 10° to 90° at the scanning speed of 1° min−1. The BET specific surface area, total pore volume, average pore size, and pore size distribution were determined by N2 adsorption at −196 °C with Micromeritics Analytical Services (Norcross, GA). The electrochemical impedance spectroscopy (EIS) measurements were carried out by using an Ametek VERSASTAT3-200 potentiostat with frequency analysis module (FDA). The AC signal had the amplitude of 10 mV in the frequency range from 0.1 to 105 Hz at zero DC bias in dark. The cyclic voltammetry (CV) measurements were carried out by using a Pt wire as counter electrode, Ag/AgCl as reference electrode, and a fabricated electrode as working electrode in an acetonitrile solution with 10 mM LiI and 0.5 mM I2 using 0.1 M tetra-n-butylammonium tetrafluoroborate as supporting electrolyte at the potential scan rate of 50 mV s−1. All of the assembled DSSC devices were tested under AM 1.5 solar simulator illumination at the light intensity of 100 mW cm−2.Results and discussion
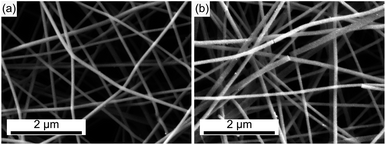
The SEM image in Fig. 1a shows representative morphology of lignin-derived ECNFs nano-felts, which was freestanding and mechanically flexible. The ECNFs in the nano-felt were uniform without microscopically identifiable beads and/or beaded nanofibers;46 and the fiber diameters were ∼120 nm. A typical SEM image of ECNFs nano-felt after surface-deposited with Pt NPs (i.e., ECNFs–Pt nano-felt) is shown in Fig. 1b. According to the SEM image, Pt NPs with very small particle sizes were randomly distributed on the surface of ECNFs. After surface-deposition with Pt NPs, the nano-felt was still mechanically flexible. Fig. 2a and the inset in Fig. 2a show the energy dispersive spectroscopy (EDS) results of ECNFs–Pt and ECNFs nano-felts, respectively. The EDS spectrum of ECNFs (inset in Fig. 2a) only had the peak of C, while the EDS spectrum of ECNFs–Pt (Fig. 2a) had both peaks of C and Pt (with the Pt loading amount of ∼9.9 wt%).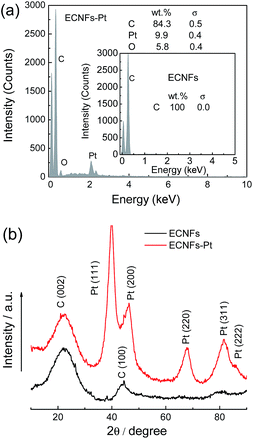 | ||
| Fig. 2 (a) EDS spectrum of ECNFs–Pt nano-felt with the inset showing the EDS spectrum of ECNFs nano-felt; (b) XRD patterns of the ECNFs and the ECNFs–Pt nano-felts. | ||
A typical TEM image (Fig. 2a) revealed that a large amount of Pt NPs with sizes in the range of 2–20 nm were randomly distributed on the surface of ECNFs after surface-deposition of Pt NPs; and such a result was in agreement with the SEM result (Fig. 1b). Note that only relatively large Pt NPs (with sizes larger than ∼5 nm) can be clearly identified in Fig. 1b. As shown in the high-resolution TEM image (Fig. 3b), the Pt NPs impregnated in ECNFs were crystalline with the inter-planar spacing (d-spacing) of ∼0.23 nm; and this is consistent with the reported value of the (111) crystallographic plane of Pt.9
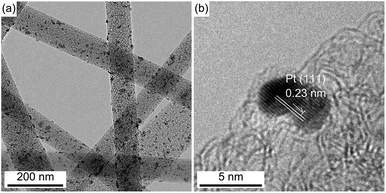 | ||
| Fig. 3 (a) Typical TEM image of ECNFs–Pt and (b) high-resolution TEM image showing an individual Pt NP in ECNFs–Pt. | ||
Crystalline structures of the ECNFs and ECNFs–Pt nano-felts were further investigated by XRD. Two Bragg reflections (the bottom curve in Fig. 2b) centered at the 2θ angles of 23° and 44° were attributed to the (002) and (100) crystallographic planes of graphite, respectively;41,47,48 both reflections/peaks were originated from hexagonal type of graphite, indicating that the ECNFs nano-felt possessed the turbostratic structure with randomly oriented graphite crystallites.48,49 In addition to the peaks from graphite structures, the XRD pattern of ECNFs–Pt nano-felt (the top curve in Fig. 2b) had 5 new diffraction peaks centered at the 2θ angles of 40°, 46°, 68°, 82°, and 86°, which were attributed to the crystallographic planes of (111), (200), (220), (311), and (222) of Pt, respectively.50,51 The XRD patterns confirmed the successful surface-deposition of Pt NPs on ECNF nano-felt, and this was consistent with the results from TEM and EDS analyses.
N2 adsorption was studied to measure the specific surface area, pore size distribution, average pore size, and pore volume of the lignin-derived ECNFs nano-felt (Fig. 4). The N2 adsorption isotherms (curve A) in Fig. 4 could be categorized as Type II under the Brunauer classification. The N2 adsorption behavior of the ECNFs nano-felt can be separated into three regions of low pressure region (p/p0 < 0.1), medium pressure region (0.1 < p/p0 < 0.9), and high pressure region (p/p0 > 0.9), which were respectively attributed to the N2 adsorptions in micropores, mesopores, and multilayer adsorption of mesopores.41 The pore size distribution curve (curve B) in Fig. 4 showed that the ECNFs nano-felt had characteristic pores in the mesopore range. According to the calculation from the N2 adsorption isotherms, the BET surface area, average pore size, and total pore volume of the ECNFs nano-felt were ∼583 m2 g−1, ∼3.5 nm, and ∼0.289 m3 g−1, respectively.
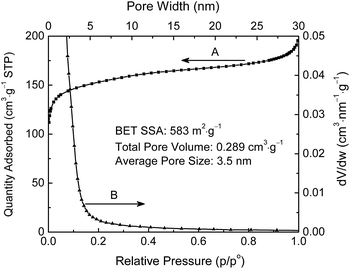 | ||
| Fig. 4 N2 adsorption isotherms (curve A) and pore size distribution (curve B) of ECNFs nano-felt. Pore size distribution was determined via the Barrett–Joyner–Halenda (BJH) method. | ||
Fig. 5 shows the CV curves acquired from three counter electrodes of ECNFs, ECNFs–Pt, and thermally prepared Pt. The tests were carried out in an acetonitrile solution with 10 mM LiI and 0.5 mM I2, while 0.1 M tetra-n-butylammonium tetrafluoroborate was used as the supporting electrode. Two typical pairs of reversible redox peaks can be clearly identified in the CV curves of three counter electrodes. The redox peak pair on the right can be assigned to the redox reaction of 3I2 + 2e− = 2I3−, which had little impact on the DSSCs performance. While the other redox peak pair on the left can be attributed to the redox reaction of I3− + 2e− = 3I−, which had direct impact on the performance of DSSCs. As previously reported,52,53 the value of current density corresponding to the left peak pair as well as the peak-to-peak separation potential (Epp) could be regarded as a sign of catalytic performance/efficiency of the counter electrode. Both counter electrodes of ECNFs and ECNFs–Pt exhibited relatively large current density values for oxidation and reduction in such a relatively negative region, indicating a fast charge transfer process and a high catalytic activity toward the I−/I3− redox reaction.10,37,52,53 Nevertheless, the Epp values were approximately the same (at ∼400 mV) for the three different counter electrode.
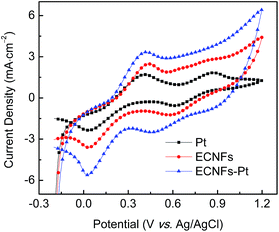 | ||
| Fig. 5 CV curves of 3 counter electrodes in an acetonitrile solution containing 10 mM LiI and 0.5 mM I2 using 0.1 M tetra-n-butylammonium tetrafluoroborate as supporting electrolyte. | ||
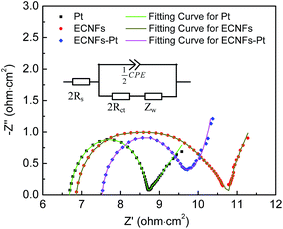
Electrochemical impedance spectroscopy (EIS) has been widely adopted to evaluate the performance/efficiency of counter electrode.54,55 Note that the performance/efficiency of DSSCs would be considerably affected by the catalytic activity arisen from the charge transfer resistance (Rct) at the electrode/electrolyte interface and the series resistance (Rs). To examine the differences on Rct and Rs of three counter electrodes (i.e., ECNFs, ECNFs–Pt, and Pt), EIS studies were performed with symmetrical dummy cells fabricated from two identical counter electrodes (i.e., ECNFs–ECNFs, ECNFs–Pt–ECNFs–Pt, and Pt–Pt). The dummy cells were made by assembling two identical counter electrodes of ECNFs, ECNFs–Pt, and Pt on each side; by doing so, the influences of photoanode could be eliminated. All of the cells contained an identical electrolyte solution with I−/I3− redox couple. Fig. 6 depicts the Nyquist plots of ECNFs–ECNFs, ECNFs–Pt–ECNFs–Pt, and Pt–Pt cells, and the inset shows the equivalent circuit model used to fit the Nyquist plots. The circuit model consists of Rct at the electrode/electrolyte interface, Rs, constant phase element (CPE) at the electrode/electrolyte interface, and Nernst diffusion impedance (Zw).18 As shown in Fig. 6, the high frequency intercept on the X-axis was related to the series Rs; while the left impedance arc at the high frequency region was originated from the charge transfer property. Note that the low frequency arch in the right region was attributed to the Zw of electrolyte.10,18,56,57
Table 1 summarizes the Rct and Rs values of each different counter electrode upon fitting the respective Nyquist plot. The Rct value of ECNFs–Pt counter electrode was 1.20 Ω cm2, and the value of ECNFs counter electrode was 1.94 Ω cm2; while the Rct value of Pt counter electrode was the smallest at 0.95 Ω cm2. Note that CPE represents the capacitance at the electrode/electrolyte interface, and it can be depicted as
| Counter electrode | Rs (Ω cm2) | Rct (Ω cm2) | β |
|---|---|---|---|
| ECNFs | 3.43 | 1.94 | 0.64 |
| ECNFs–Pt | 3.76 | 1.20 | 0.82 |
| Pt | 3.35 | 0.95 | 0.98 |
The factors including surface roughness, film porosity, leaky capacitor, and non-uniform current distribution have impacts on β value.25,58 The β values of ECNFs and ECNFs–Pt electrodes were smaller than that of Pt electrode, indicating that the electrodes of ECNFs and ECNFs–Pt were more porous than the electrode of Pt.18,25 Intriguingly, the β value of ECNFs electrode was smaller than that of ECNFs–Pt electrode, suggesting that the surface-deposition of Pt NPs would reduce the porosity of ECNFs nano-felt. Note that the Rct and Rs values of Pt counter electrode were 0.95 and 3.35 Ω cm2, respectively; and the Zw value of Pt counter electrode was small as well (Fig. 6). These results indicated that the diffusion of ions would be faster in the DSSC with Pt counter electrode.
Table 2 summarizes the photovoltaic parameters extracted from current density versus voltage (J–V) curves of the assembled DSSCs based on three different counter electrodes (as shown in Fig. 7). The tests were performed under AM 1.5 solar simulator illumination at the light intensity of 100 mW cm−2. The ECNFs–Pt based DSSC exhibited the performance with short circuit density (Jsc) of 13.15 mA cm−2, open circuit voltage (Voc) of 0.80 V, fill factor (FF) of 0.63, and energy conversion efficiency (η) of 6.94%. The values of Jsc, Voc, FF, and η for the Pt based DSSC were 14.76 mA cm−2, 0.76 V, 0.65, and 7.29%, respectively. Compared to the Pt based device, the Voc and FF values of the ECNFs–Pt based DSSC were slightly higher, while the Jsc and η values were slightly lower (but still comparable); these results suggested that the ECNFs–Pt based DSSC had a comparable charge recombination as that of the Pt based device. Previous studies revealed that the charge recombination in a DSSC at the interfaces of FTO/TiO2 and TiO2/electrolyte could result in a considerable loss in Voc.59–61 The comparable Voc value to the Pt based device further verified that the ECNFs–Pt counter electrode had little impact on charge recombination in the corresponding DSSCs. More importantly, the ECNFs based device also had a similar performance to the Pt based DSSC; in specific, the Jsc, Voc, FF, and η values of ECNFs based DSSC were 13.40 mA cm−2, 0.80 V, 0.63, and 6.75%, respectively. These results indicated that both ECNFs and ECNFs–Pt nano-felts could be utilized for making counter electrodes of DSSCs with similar performance/efficiency; in other words, the high cost of Pt that would limit commercial applications of DSSCs could be prevented by using the lignin-derived ECNFs nano-felt alone.
| Counter electrode | Jsc (mA cm−2) | Voc (V) | FF | η (%) |
|---|---|---|---|---|
| ECNFs | 13.40 | 0.80 | 0.63 | 6.75 |
| ECNFs–Pt | 13.15 | 0.80 | 0.66 | 6.94 |
| Pt | 14.76 | 0.76 | 0.65 | 7.29 |
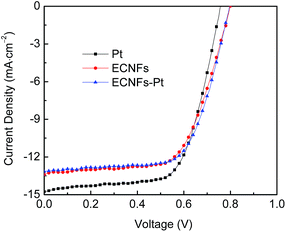 | ||
| Fig. 7 Current density versus voltage (J–V) curves acquired from the prototype DSSCs with three different counter electrodes of ECNFs, ECNFs–Pt, and Pt. | ||
Conclusion
In this study, the freestanding and mechanically flexible ECNFs nano-felt with BET specific surface area of ∼583 cm2 g−1 and average pore size of ∼3.5 nm was prepared from alkali lignin; and the ECNFs nano-felt was further surface-deposited with Pt NPs via the wet-chemistry method. The SEM, TEM, and XRD results revealed that a large amount of Pt NPs (∼9.9 wt%) with sizes in the range of 2–20 nm were randomly distributed on the nanofiber surface of ECNFs–Pt nano-felt. Subsequently, the ECNFs and ECNFs–Pt nano-felts were studied as counter electrodes of DSSCs; and both electrodes exhibited reasonably high electrocatalytic activities towards the reduction of I3− into I−. Compared to the values of the device based on conventional Pt counter electrode, the values of Jsc, Voc and FF of the prototype DSSCs made of ECNFs and ECNFs–Pt counter electrodes were similar; more importantly, the η values of the devices made of ECNFs and ECNFs–Pt counter electrodes were 6.75% and 6.94%, respectively, which were comparable to the value of the DSSC based on conventional Pt counter electrode (7.29%). This study suggested that the ECNFs and ECNFs–Pt nano-felts would be promising for the fabrication of cost-effective counter electrodes of DSSCs with reasonably high efficiency/performance; additionally, these nano-felts could be utilized for the development of flexible DSSCs.Acknowledgements
This research was supported by the National Aeronautics and Space Administration (NASA Cooperative Agreement Numbers: NNX13AD31A and NNX14AN22A) and by the US–Pakistan Joint Science & Technology Program through the National Academy of Science. H. Elbohy would like to acknowledge the Egyptian Government Fellowship (Egyptian Missions Sector 2012), and H. Fong would like to acknowledge the support from the Department of Education in Anhui Province of China (Grant Number: 2015LJRCTD001).Notes and references
- B. O'Regan and M. Gratzel, Nature, 1991, 353, 737–740 CrossRef.
- M. Gratzel, Nature, 2001, 414, 338–344 CrossRef CAS PubMed.
- A. Yella, H. W. Lee, H. N. Tsao, C. Y. Yi, A. K. Chandiran, M. K. Nazeeruddin, E. W. G. Diau, C. Y. Yeh, S. M. Zakeeruddin and M. Gratzel, Science, 2011, 334, 629–634 CrossRef CAS PubMed.
- P. Joshi, L. F. Zhang, D. Davoux, Z. T. Zhu, D. Galipeau, H. Fong and Q. Q. Qiao, Energy Environ. Sci., 2010, 3, 1507–1510 CAS.
- M. Y. Liu, G. Li and X. S. Chen, ACS Appl. Mater. Interfaces, 2014, 6, 2604–2610 CAS.
- H. Wang, Z. Sun, Y. K. Zhang, Y. Zhang, M. Liang, D. D. Jia and S. Xue, J. Phys. Chem. C, 2014, 118, 60–70 CAS.
- T. W. Hamann, A. B. F. Martinson, J. W. Elam, M. J. Pellin and J. T. Hupp, J. Phys. Chem. C, 2008, 112, 10303–10307 CAS.
- A. N. Sreekumaran, P. N. Zhu, V. B. Jaqadeesh, S. Y. Yang and S. Ramakrishna, Phys. Chem. Chem. Phys., 2011, 13, 21248–21261 RSC.
- Y. Zhao, A. Thapa, Q. Feng, M. Xi, Q. Q. Qiao and H. Fong, Nanoscale, 2013, 5, 11742–11747 RSC.
- P. Joshi, L. F. Zhang, Q. L. Chen, D. Galipeau, H. Fong and Q. Q. Qiao, ACS Appl. Mater. Interfaces, 2010, 2, 3572–3577 CAS.
- M. Gratzel, J. Photochem. Photobiol., C, 2003, 4, 145–153 CrossRef CAS.
- R. Bajpai, S. Roy, P. Kumar, P. Bajpai, N. Kulshrestha, J. Rafiee, N. Koratkar and D. S. Misra, ACS Appl. Mater. Interfaces, 2011, 3, 3884–3889 CAS.
- C. Y. Cho and J. H. Moon, Adv. Mater., 2011, 23, 2971–2975 CrossRef CAS PubMed.
- S. S. Jeon, C. Kim, J. Ko and S. S. Im, J. Phys. Chem. C, 2011, 115, 22035–22039 CAS.
- J. He, L. T. L. Lee, S. H. Yang, Q. Li, X. D. Xiao and T. Chen, ACS Appl. Mater. Interfaces, 2014, 6, 2224–2229 CAS.
- K. S. Kim, H. Song, S. H. Nam, S. M. Kim, H. Jeong, W. B. Kim and G. Y. Jung, Adv. Mater., 2012, 24, 792–798 CrossRef CAS PubMed.
- A. Kay and M. Gratzel, Sol. Energy Mater. Sol. Cells, 1996, 44, 99–117 CrossRef CAS.
- P. Joshi, Z. P. Zhou, P. Poudel, A. Thapa, X. F. Wu and Q. Q. Qiao, Nanoscale, 2012, 4, 5659–5664 RSC.
- F. Hao, P. Dong, Q. Luo, J. B. Li, J. Lou and L. Lin, Energy Environ. Sci., 2013, 6, 2003–2019 CAS.
- F. Y. Cheng and J. Chen, Chem. Soc. Rev., 2012, 41, 2172–2192 RSC.
- W. Y. Chen, C. C. Wang and S. Y. Lu, Carbon, 2013, 54, 291–299 CrossRef.
- P. Poudel and Q. Q. Qiao, Nano Energy, 2014, 4, 157–175 CrossRef CAS.
- G. H. Liu, H. Wang, X. Li, Y. G. Rong, Z. L. Ku, M. Xu, L. F. Liu, Y. Yang, P. Xiang, T. Shu and H. M. Han, Electrochim. Acta, 2012, 69, 334–339 CrossRef CAS.
- G. Veerappan, K. Bojan and S. W. Rhee, ACS Appl. Mater. Interfaces, 2011, 3, 857–862 CAS.
- T. N. Murakami, S. Ito, Q. Wang, M. K. Nazeeruddin, T. Bessho, I. Cesar, P. Liska, R. Humphry-Baker, P. Comte, P. Pechy and M. Gratzel, J. Electrochem. Soc., 2006, 153, A2255–A2261 CrossRef CAS.
- S. H. Chang, M. D. Lu, Y. L. Tung and H. Y. Tuan, ACS Nano, 2013, 7, 9443–9451 CrossRef CAS PubMed.
- K. C. Huang, Y. C. Wang, R. X. Dong, W. C. Tsai, K. W. Tsai, C. C. Wang, Y. H. Chen, R. Vittal, J. J. Lin and K. C. Ho, J. Mater. Chem., 2010, 20, 4067–4073 RSC.
- T. Chen, L. B. Qiu, Z. B. Cai, F. Gong, Z. B. Yang, Z. S. Wang and H. S. Peng, Nano Lett., 2012, 12, 2568–2572 CrossRef CAS PubMed.
- D. Sebastian, V. Baglio, M. Girolamo, R. Moliner, M. J. Lazaro and A. S. Arico, J. Power Sources, 2014, 250, 242–249 CrossRef CAS.
- L. J. Yang and W. W. F. Leung, Adv. Mater., 2013, 25, 653–701 CrossRef.
- T. Peng, W. W. Sun, X. H. Sun, N. Huang, Y. M. Liu, C. H. Bu, S. S. Guo and X. Z. Zhao, Nanoscale, 2013, 5, 337–341 RSC.
- B. Zhao, H. Huang, P. Jiang, H. F. Zhao, X. W. Huang, P. Shen, D. C. Wu, R. W. Fu and S. T. Tan, J. Phys. Chem. C, 2011, 115, 22615–22621 CAS.
- K. Imoto, K. Takahashi, T. Yamaguchi, T. Komura, J. I. Nakamura and K. Murata, Sol. Energy Mater. Sol. Cells, 2003, 79, 459–469 CrossRef CAS.
- L. Kavan, J. H. Yum and M. Gratzel, Electrochim. Acta, 2014, 128, 349–359 CrossRef CAS.
- B. Munkhbayar, M. J. Nine, J. Jeoun, M. Ji, H. Jeong and H. Chung, J. Power Sources, 2013, 230, 207–217 CrossRef CAS.
- Z. Huang, X. Z. Liu, K. X. Li, D. M. Li, Y. H. Luo, H. Li, W. B. Song, L. Q. Chen and Q. B. Meng, Electrochem. Commun., 2007, 9, 596–598 CrossRef CAS.
- Y. D. Wang, C. Y. Zhao, M. X. Wu, W. Liu and T. L. Ma, Electrochim. Acta, 2013, 105, 671–676 CrossRef CAS.
- C. L. Lai, G. J. Zhong, Z. R. Yue, G. Chen, L. F. Zhang, A. Vakili, Y. Wang, L. Zhu, J. Liu and H. Fong, Polymer, 2011, 52, 519–528 CrossRef CAS.
- C. B. Huang, S. L. Chen, C. L. Lai, D. H. Reneker, H. Y. Qiu, Y. Ye and H. Q. Hou, Nanotechnology, 2006, 17, 1558–1563 CrossRef CAS PubMed.
- R. Padmavathi and D. Sangeetha, Electrochim. Acta, 2013, 112, 1–13 CrossRef CAS.
- C. L. Lai, Z. P. Zhou, L. F. Zhang, X. X. Wang, Q. X. Zhou, Y. Zhao, Y. C. Wang, X. F. Wu, Z. T. Zhu and H. Fong, J. Power Sources, 2014, 247, 134–141 CrossRef CAS.
- H. Elbohy, A. Aboagye, S. Sigdel, Q. Wang, M. H. Sayyad, L. Zhang and Q. Qiao, J. Mater. Chem. A, 2015, 3, 17721–17727 CAS.
- J. Gong, H. Qiao, S. Sigdel, H. Elbohy, N. Adhikari, Z. Zhou, K. Sumathy, Q. Wei and Q. Qiao, AIP Adv., 2015, 5, 067134 CrossRef.
- A. Aboagye, H. Elbohy, A. D. Kelkar, Q. Qiao, J. Zai, X. Qian and L. Zhang, Nano Energy, 2015, 11, 550–556 CrossRef CAS.
- S. Sigdel, A. Dubey, H. Elbohy, A. Aboagye, D. Galipeau, L. Zhang, H. Fong and Q. Qiao, J. Mater. Chem. A, 2014, 2, 11448–11453 CAS.
- H. Fong, I. Chun and D. H. Reneker, Polymer, 1999, 40, 4585–4592 CrossRef CAS.
- V. Presser, L. Zhang, J. J. Niu, J. McDonough, C. Perez, H. Fong and Y. Gogotsi, Adv. Energy Mater., 2011, 1, 423–430 CrossRef CAS.
- H. Chen, F. Wang, S. S. Tong, S. L. Guo and X. M. Pan, Appl. Surf. Sci., 2012, 258, 6097–6102 CrossRef CAS.
- H. M. Xie, R. S. Wang, J. R. Ying, L. Y. Zhang, A. F. Jalbout, H. Y. Yu, G. L. Yang, X. M. Pan and Z. M. Su, Adv. Mater., 2006, 18, 2609–2613 CrossRef CAS.
- J. Shi, D. J. Guo, Z. Wang and H. L. Li, J. Solid State Electrochem., 2005, 9, 634–638 CrossRef CAS.
- R. I. Jafri, N. Rajalakshmi and S. Ramaprabhu, J. Mater. Chem., 2010, 20, 7114–7117 RSC.
- J. D. Roy-Mayhew, D. J. Bozym, C. Punckt and I. A. Aksay, ACS Nano, 2010, 4, 6203–6211 CrossRef CAS PubMed.
- W. Liu, Y. Fang, P. Xu, Y. Lin, X. Yin, G. Tang and M. He, ACS Appl. Mater. Interfaces, 2014, 6, 16249–16256 CAS.
- H. P. Jen, M. H. Lin, L. L. Li, H. P. Wu, W. K. Huang, P. J. Cheng and E. W. G. Diau, ACS Appl. Mater. Interfaces, 2013, 5, 10098–10104 CAS.
- J. Han, H. Kim, D. Y. Kim, S. M. Jo and S. Y. Jang, ACS Nano, 2010, 4, 3503–3509 CrossRef CAS PubMed.
- X. G. Mei, S. J. Cho, B. H. Fan and J. Ouyang, Nanotechnology, 2010, 21, 395202–395211 CrossRef PubMed.
- M. K. Wang, A. M. Anghel, B. Marsan, N. L. C. Ha, N. Pootrakulchote, S. M. Zakeeruddin and M. Gratzel, J. Am. Chem. Soc., 2009, 131, 15976–15977 CrossRef CAS PubMed.
- A. Hauch, A. Georg, S. Baumgartner, U. P. Krasovec and B. Orel, Electrochim. Acta, 2001, 46, 2131–2136 CrossRef CAS.
- J. B. Xia, N. Masaki, K. J. Jiang and S. Yanagida, J. Phys. Chem. C, 2007, 111, 8092–8097 CAS.
- S. Y. Huang, G. Schlichthörl, A. J. Nozik, M. Gratzel and A. J. Frank, J. Phys. Chem. B, 1997, 101, 2576–2582 CrossRef CAS.
- M. Gratzel, Progress in Photovoltaics: Research and Applications, 2000, 8, 171–185 CrossRef CAS.
| This journal is © The Royal Society of Chemistry 2016 |

