
LC-ESI-TOF-MS-based metabolomic analysis of ginsenoside Rd-induced anaphylactoid reaction in mice†
Xiaoyan Lu,
Xueping Lian,
Jie zheng,
Ni Ai,
Cai Ji,
Cui Hao and
Xiaohui Fan*
Pharmaceutical Informatics Institute, College of Pharmaceutical Sciences, Zhejiang University, Hangzhou 310058, China. E-mail: fanxh@zju.edu.cn; Fax: +86-571-88208426; Tel: +86-571-88208596
First published on 4th February 2016
Abstract
As a major adverse drug reaction associated with traditional Chinese medicine injections (TCMIs), an anaphylactoid reaction has attracted a significant amount of attention from regulatory agencies and research communities. To ensure safe and effective use of TCMIs in the clinic, it is of great importance to identify the causative chemical responsible for the anaphylactoid reaction observed. Ginsenoside Rd (Rd) is one of the main active components in several TCMIs which have been recently reported to cause an anaphylactoid reaction. In this study, the possibility of an Rd-induced anaphylactoid reaction was first evaluated using general toxicological assessments. As a result, the in vitro model showed that Rd treatment could directly induce β-hexosaminidase release in RBL-2H3 cells through mast cell degranulation. Further in vivo studies revealed that cutaneous vascular permeability and plasma histamine levels were significantly increased in Rd-treated mice, strengthening the fact that Rd could induce an anaphylactoid reaction. Moreover, a comprehensive metabolomic approach was established to investigate the effects of an Rd-induced anaphylactoid reaction in mice using liquid chromatography-electrospray ionization-time-of-flight-mass spectrometry. Our results evinced that alterations in the metabolites related to inflammation and allergy diseases were observed during the early stage of an anaphylactoid reaction, including glycerophospholipids, corticosteroid hormones, bile acids, sterol lipids, and fatty acids, suggesting that the disturbances in lipid metabolism may be involved in the Rd-induced anaphylactoid reaction, such as glycerophospholipid and steroid hormone metabolism. Thus, Rd may be an allergenic factor inducing an anaphylactoid reaction in Rd-contained TCMIs.
1. Introduction
Traditional Chinese medicine injections (TCMIs), one of the major utility formulations of traditional Chinese medicine (TCM) in China, usually involve complex ingredients responsible for their clinical efficacy. Nevertheless, adverse drug reactions (ADRs) are critical problems in the development of TCMIs and they may be due to the complex ingredients. Based on the reports, more than 70% ADRs of TCMIs is an anaphylactoid reaction.1 Similar to anaphylaxis, an anaphylactoid reaction is an acute life-threatening hypersensitivity reaction with severe clinical manifestations, e.g. urticaria, pruritus, angioedema, gastrointestinal symptoms, cardiac arrhythmia or bronchospasm.2 Except immunoglobulin E (IgE), similar cellular mediators that anaphylaxis involves have been suggested to engage in anaphylactoid reaction as well.2–5 Without prior sensitization, anaphylactoid reaction can be induced by drugs that have direct effects on the degranulation of mass cells or circulating basophils, and some drug-related factors (dosage and delivery rate) have been known to link with this phenomenon.6 On the contrary, anaphylaxis is an IgE mediated type I hypersensitivity reaction and requires prior sensitization of the antigen to produce antibody–antigen complex, which combines on the surface of mast cells and basophils. Many drugs can cause anaphylactoid reaction, including local anaesthetic agents, liposomes, neuromuscular blocking drugs, muscle relaxants, nonsteroidal anti-inflammatory drugs as well as iodinated contrast media used in radiography.6,7 Various immunologic and non-immunologic mechanisms were proposed for drug-induced anaphylactoid reaction, such as generation of kinins with activation of coagulation or fibrinolysis, disturbance of arachidonic acid metabolism, activation of complement cascade to produce the anaphylatoxins C3a and C5a or direct histamine release.4,8 As key effectors in allergic or immediate hypersensitivity responses, mast cells can be activated by either IgE-dependent or -independent stimuli, and then degranulation is initiated by the fusion of cytoplasmic granule membranes with plasma membranes. The secretion of preformed mediators from degranulation9 can be examined experimentally which makes mast cell as a good in vitro cellular model for studying comprehensive events induced by various allergens.10Ginsenoside Rd (Rd), belonging to the panaxadiol group of dammarane glycosides (Fig. 1), widely exists in many herbs, such as Panax ginseng C.A. Meyer and Pana notoginseng, which are used in TCM for thousands of years. Moreover, several TCMIs made of Rd and other saponins of notoginseng are prevalently used to treat coronary artery disease in clinic.11 Rd so far has been verified to exert various pharmacological effects, such as antioxidative,12 immunological adjuvant,13 anti-inflammatory,14,15 antiapoptotic,16 and neuroprotective properties.17 Interestingly, the toxicological effects of Rd have recently attracted lots of attentions since there are growing publications reporting clinical anaphylactoid reaction of Rd-contained TCMIs.18–20 A previous study also demonstrated that Rd had hapten property.21 Our preliminary study showed that Rd can remarkably induce mast cells degranulation and likely is an allergenic ingredient. However, despite of serious concerns on Rd, the possibility and mechanism of Rd-induced anaphylactoid reaction needs further confirmation and clarification.
 | ||
| Fig. 1 Structure of ginsenoside Rd. | ||
Metabolomics, one of the emerging fields of “omics” research, is concerned with the comprehensive characterization of the endogenous small molecule metabolites in biological systems.22 It provides an overview of the global biochemical events and dynamic metabolic status of the organism. Therefore, metabolomic studies enhance our understanding on disease or drug mechanisms, help to identify new biomarkers and increase prediction power on individual variations in drug response phenotypes.23 Numerous metabolomic studies have been carried out to investigate allergic (asthma and atopic dermatitis) and rheumatic diseases (rheumatoid arthritis and systemic lupus erythematosus) using different fluids (reviewed in ref. 24). However, regarding to anaphylaxis and anaphylactoid reaction, only there literatures were available on this topic using metabolomic analysis.25–27 Hu et al.25 utilized gas chromatography-mass spectrometry (GC-MS) to investigate metabolic profiling changes in a guinea pig model sensitized by ovalbumin or cattle albumin, while Chalcraft et al.26 applied a comprehensive metabolomics approach by liquid chromatography-electrospray ionization-time-of-flight-mass spectrometry (LC-ESI-TOF-MS) to study peanut-induced anaphylaxis in a murine model. Xu et al.27 conduced LC-ESI-TOF-MS-based metabolomics approach to evaluate Xuesaitong injection-induced anaphylactoid reaction, which is a TCMI containing Rd. So far there is no report about Rd-induced anaphylactoid reaction using metabolomics approach.
In this study, we aimed to confirm the possibility of Rd as an inductor of anaphylactoid reaction and further carry out a metabolomic analysis to reveal the mechanism of Rd-induced anaphylactoid reaction in mice. First, the effect of Rd on mast cell degranulation was evaluated at different concentrations in vitro, and then the in vivo models were utilized to confirm the occurrence of anaphylactoid reaction in Rd-treated mice, such as cutaneous vascular permeability assay and the histamine levels detection. Most importantly, we focused on the identify of metabolic changes in mice using UPLC-ESI-TOF-MS-based metabolomics analysis. Our results shed some light on the mechanism of Rd-induced anaphylactoid reaction, which will be helpful to understand the mechanism of anaphylactoid reaction in TCMIs and improve the safety use of TCMIs containing Rd.
2. Experimental
2.1 Chemicals and reagents
Ginsenoside Rd (purity > 99%) was obtained from Shanghai Winherb Medical S&T Development Co. Ltd. (Shanghai, China). The purity of Rd was 98.1% checked by the high performance liquid chromatography (HPLC, the detail description of the method is presented in ESI Fig. 1†), and the structure of Rd was confirmed by the 13C-nuclear magnetic resonance (NMR, ESI Fig. 2†). Compound 48/80 (C48/80), p-nitrophenyl-N-acetyl-β-D-glucosaminide, MTT [3-(4,5-dimethyl-2-yl)-2,5-diphenyltetrazolium bromide], dimethyl sulfoxide (DMSO), and Evans blue were purchased from Sigma Co. (St. Louis, MO, USA). Phenobarbital sodium (PB) was purchased from Shanghai Chemicals Reagent Company, China Pharmaceutical Corporation (Shanghai, China). Acetonitrile, methanol (Merck, Germany) and formic acid (Roe Scientific Inc.) were of HPLC grade. Deionized water was purified by a Milli-Q water purification system (Millipore, Molsheim, France). All the other reagents were obtained from commercial sources and were of analytical grade. For the in vitro experiments, the stock solution of Rd was 25 mg mL−1 in DMSO and C48/80 was 200 mg mL−1 in DMSO. For the in vivo experiments, the mixture of 10% 1,2-propanediol (v/v) and 5% ethanol (v/v) in 0.9% sodium chloride injection was used as the solvent for both Rd and C48/80.2.2 Rd-induced mast cell degranulation in vitro
The effects of Rd on RBL-2H3 proliferation were determined by MTT assay. The cells were plated in 96-well plates at a density of 4 × 10⁵ cells per mL. After 24 h, cells were washed once with phosphate buffered saline (PBS) and treated with different concentrations of Rd prepared by MEM media without phenol red and FBS (Rd was soluble in the final concentrations after preparation). After 1 h of incubation, the culture medium was removed and replaced by MTT solution (0.5 mg mL−1, final concentration prepared by MEM media without phenol red and FBS). The plates were incubated at 37 °C for 4 h and then the formed formazan crystals were solubilized with 100 μL DMSO. The optical densities were measured using 490 nm transmission light. Viability of cells was quantified as a percentage compared to vehicle control (1% DMSO), and the results were shown in the ESI Fig. 3.†
2.3 Cutaneous vascular permeability assay
Female C57BL/6 mice (body weight 18–20 g) were supplied by Shanghai SLAC laboratory Animal Co., Ltd (Shanghai, China). Food and water were available ad libitum. The mice were housed in plastic cages and maintained at an environmentally controlled room at 25 ± 1 °C with a relative humidity of 50% ± 10% under a 12 h light/dark cycle. All experiments were conducted in accordance with guidelines prescribed by the Animal Experiments Committee of Zhejiang University (Hangzhou, China). The experiment of vascular permeability or vascular leakage was carried out according to the earlier described method.29–31 Animals were randomly divided into 4 groups (n = 8), including vehicle control, Rd at 1 mg mL−1, Rd at 10 mg mL−1, and C48/80 at 0.2 mg mL−1 treatments. A 0.5% saline solution of Evans blue was injected intravenously into each animal. After 15 min, 50 μL C48/80 (0.2 mg mL−1) or Rd (1 mg mL−1 or 10 mg mL−1) administered subcutaneously into the double sites of the back of mice. The concentration of 1 mg mL−1 Rd was approximately equivalent to two times of percentage composition of Rd in the total saponins of notoginseng injection used daily in clinic. The mixture of 10% 1, 2-propanediol (v/v) and 5% ethanol (v/v) in 0.9% sodium chloride injection was used as the solvent for both Rd and C48/80 and served as a vehicle control. Mice were sacrificed by cervical dislocation at 1 h post-injection, and the skin was removed and photographed. Then, the skin specimen was cut an dissolved in 1.5 mL mixed solvent (acetone![[thin space (1/6-em)]](https://www.rsc.org/images/entities/char_2009.gif) :physiological saline = 7:3, v/v) for 2 days and the amount of dye in the supernatant was measured at 595 nm.
:physiological saline = 7:3, v/v) for 2 days and the amount of dye in the supernatant was measured at 595 nm.
2.4 Metabolomic analysis
The plasma samples from each group were thawed on ice before preparation. A volume of 200 μL extraction mix (1:1 solution of methanol:ethanol) containing internal standards, chloromycetin (500 ng mL−1) for negative mode and clarithromycin (25 ng mL−1) for positive mode, was added into a 50 μL plasma aliquot in order to precipitate proteins as previously described.32 Afterwards, the mixture was vortexed for 1 min and pelleted by centrifugation at 13000 g, 4 °C for 10 min. Then 230 μL fluid supernatant was evaporated to dryness under nitrogen (Thermo Savant SPD121P, USA). The dry residue was reconstituted in 50 μL of methanol with high purity grade water (4:1, v/v), and the resulting mixtures were centrifuged again at 13000 g, 4 °C for 10 min. All the supernatant was removed and transferred to an autosampler vial kept at 4 °C and an aliquot of 5 μL was injected for UPLC/MS analysis.
Twelve plasma samples were randomly selected from the treatment groups and mixed together as the quality control (QC) samples, which were used to validate the stability of LC-MS system during the analysis. The QC sample was first analyzed once the instrument was calibrated to condition or equilibrate the system, and then analyzed after every twelve samples to ensure instrument was in the same condition during the analytical procedure.33,34
2.4.2.1 Chromatography. Chromatographic separations were performed on an ACQUITY UPLC BEH column (C18, 2.1 × 100 mm, 1.7 μm) using an Acquity UPLC system (Waters Corp., Milford, USA). The column was maintained at 35 °C. The mobile phase, at a flow rate of 0.4 mL min−1, was composed of water containing 0.1% (v/v) formic acid (A) and acetonitrile (B). The column was eluted with a gradient of 5% B over initial-0.5 min, 5–100% B at 0.5–24 min, 100% B at 24–28 min, 5–100% B at 28–30 min.
2.4.2.2 Mass spectrometry. MS detection was done on a Waters Synapt G2 QTOF/MS (Waters Corp., Milford, MA, USA) equipped with an electrospray ionization (ESI) source. The SYNAPT G2 was operated in resolution mode. The ionization source conditions were as follows: capillary voltage of 3.0 kV, sample cone voltage of 30.0 V; extraction cone voltage of 2.0 V, trap collision energy of 4.0 V; source temperature of 120 °C, desolvation temperature of 350 °C, ion energy was at 1.0 V; the scan time of 0.2 s, trap gas flow was 2.0 mL min−1, desolvation gas (nitrogen) and cone gas (argon) were set at 600 and 50 L h−1, respectively. Masses of fragments were ranged from 75–1000 m/z in both positive and negative ionization modes. Leucine-enkephalin was used as the lock mass generating an m/z 556.2771 Da ([M + H]+) for positive mode and m/z 554.2615 Da ([M − H]−) in negative ion mode at a concentration of 2 ng mL−1 and a flow rate of 5 μL min−1 was used to check the MS response.
2.4.2.3 Data processing. The raw data was processed using MakerLynx within MassLynx software (version 4.1, Waters Corporation, Milford, USA) for peak detection and alignment as previously reported in detail.35 The main parameters of Markerlynx method were set as follows: retention time range 1–26 min, mass range 100–1000 amu, mass tolerance 0.05 Da, retention time window 0.2 s, and noise elimination level 10. After modified, the data sets were introduced to WatersEZinfo 2.0 software for partial least-squares-discriminant analysis (PLS-DA) and orthogonal partial least squares-discriminate analysis (OPLS-DA). The OPLS-DA score plots were described by the cross-validation parameter R2 (explained variance) and Q2 (goodness-of-fit/predictive accuracy).
2.4.2.4 Metabolite identification and pathway analysis. The VIP (variable importance in the projection) value and S-plot in OPLS-DA were used together to select the potential metabolite biomarkers. Candidate biomarkers were identified based on retention time, mass assignment, and online database query. The online available databases were used for initial determination of the metabolites, such as METLIN (http://www.metlin.scripps.edu), KEGG (http://www.genome.jp/kegg), lipidMAPS (http://www.lipidMAPS.org) and HMDB (http://www.hmdb.ca/). The mass tolerance between the measured m/z values and the exact mass of the components of interest was set to within 10 ppm. Several significantly different metabolic ions were re-analyzed using a targeted MS/MS mode. Finally, the metabolites were identified by comparison with the MS/MS spectrum in online databases and literatures. Metabolic pathway analysis was performed with the MetaboAnalyst tool (http://www.metaboanalyst.ca/).
2.5 Statistic analysis
All the experimental data was presented as mean ± SEM. Statistical significance was assessed by Student's t test or ANOVA test. Student's t test calculations assuming a 2-tail distribution with heteroscedastic scattering was performed using Microsoft Excel. ANOVA was conducted by one-factor with replication, followed by LSD post hoc test, using SPSS Version 21 (IBM SPSS, USA). The confidence levels were set at 95% to determine the significance of difference (p < 0.05).3. Results
3.1 Effect of Rd on β-hexosaminidase release from RBL-2H3 cells
Release of β-hexosaminidase is a hallmark indicator of the degranulation of RBL-2H3 cells. As shown in Fig. 2, positive control C48/80 elicited mast cell degranulation, as indicated by the significant increase in the β-hexosaminidase level.36,37 Rd also directly induced the release of β-hexosaminidase from RBL-2H3 cells in a dose-dependent manner, with the pronounced and stronger effects than C48/80 detected after 100 to 250 μg mL−1 treatments. | ||
| Fig. 2 The β-hexosaminidase release in RBL-2H3 cells after exposure to different concentrations of Rd for 1 h. The positive control C48/80 was 30 μg mL−1. Data are presented as mean ± SEM of three independent experiments. **p < 0.01, compared to the vehicle control group; #p < 0.001, compared to the C48/80 group. | ||
3.2 Effect of Rd on cutaneous vascular permeability
The cutaneous vascular permeability assay was applied to determine the effect of Rd in vivo, which has been optimized and proved to be a stable and reliable model to detect the anaphylactoid reactions of TCMIs.30 Again, as a positive control, C48/80 (0.2 mg mL−1) induced intense blue staining at the injection sites at 1 h post-injection compared with vehicle-treated mice (Fig. 3). As shown in Fig. 3A and B, subcutaneous injection of Rd (1 and 10 mg mL−1) also markedly increased vascular permeability, indicating Rd may induce anaphylactoid reactions in vivo. | ||
| Fig. 3 Effects of Rd on vascular permeability in mice at 1 h post-injection. (A) Both positive control C48/80 (0.2 mg mL−1) and Rd treatments induced localized vascular hyperpermeability and plasma extravasation which were visualized by intense blue staining in the skin. (B) The amount of Evans blue dye extracted from skin tissue. Rd increased the exudation of Evans blue in a dose-dependent manner. Data are presented as the mean ± SEM. *p < 0.05, **p < 0.01, compared to the vehicle control group, n = 8. | ||
3.3 Histamine release
Histamine is considered as the major mediator of the acute inflammatory and immediate hypersensitivity responses.38 As the anaphylactoid reaction is related to the concentration of drug, the minimum toxic concentrations of C48/80 and Rd were used in the assay of anaphylactoid reaction in mice. Our results indicated that just after 10 min of i.v. injection, the histamine levels in plasma of the Rd groups (Fig. 4) were significantly elevated in comparison with that of the vehicle control group (p < 0.01) and similar effect was observed for the positive control C48/80. These results showed that Rd exhibited potential anaphylactoid activity in vivo. | ||
| Fig. 4 Plasma histamine levels at 10 min post-injection. Results are expressed as mean ± SEM. **p < 0.01, compared to the vehicle control group, n = 8. | ||
3.4 Multivariate data analysis of metabolic fingerprint by LC-QTOF/MS
The LC-TOF-MS method was first validated by measuring the repeatability of QC samples. Good repeatability (RSD < 10%) was observed, and the margin of accurate mass was less than 5 ppm. A total number of 6252 aligned features in ESI+ and 3831 features in ESI− were defined by its retention time and m/z (excluding Rd, Rd metabolites and redundant isotope/adduct signals) in MakerLynx. “80% rule” was applied here to filter out features containing more than 20% zeros or missing values in all groups,39 which reduced the number of features to 2522 in ESI+ and 1719 in ESI−. The histamine levels at 10 min post-injection suggested a state of anaphylactoid reaction was being experienced, and PLS-DA of aligned features in ESI+ and ESI− showed a distinct pattern of progression from early stage of anaphylactoid reaction to mid and late stage as defined by time (Fig. 5A and B, the control group at 30 min in ES+ model, Rd group at 30 min and 2 h in ES− model all had one outlier which were excluded during the PLS-DA). At 10 min post-injection, a clear separation in the PLS-DA score plots between control and Rd groups was observed as well as 30 min and 2 h post-injection. Moreover, a time-dependent manner was observed in Rd-treated mice as the samples of 2 h point were completely separated from the samples of other two time points, and a tendency toward to control group was detected at 2 h post-injection. This corresponds well with the clinical and physiological observations of anaphylactoid reaction often induced in half an hour of drug administration.40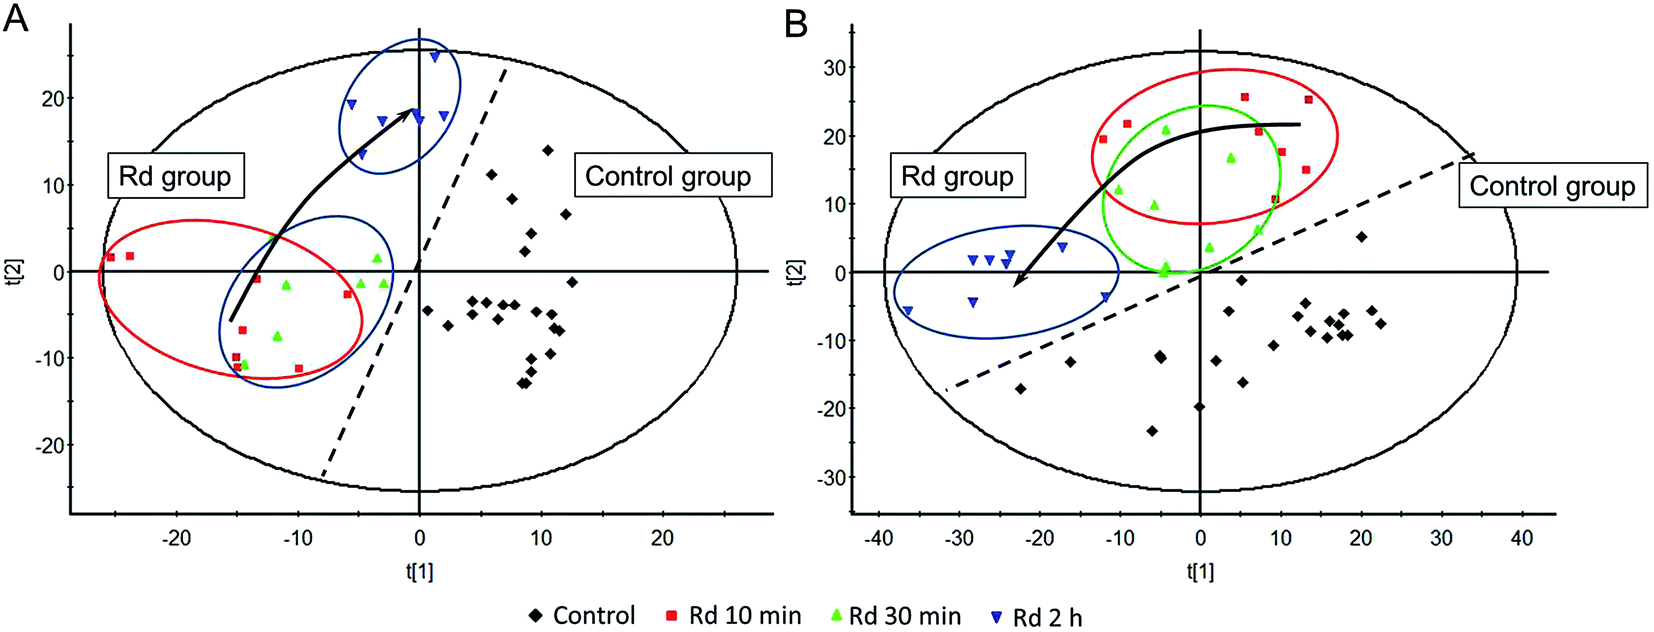 | ||
| Fig. 5 The PLS-DA score plots of metabolomics features between Rd groups and control groups. Each time point includes 8 mice per group except the 30 min-point and 2 h-point of Rd in the negative model and 30 min-point of control group in the positive mode for the outliers. Each sample encompasses 1719 metabolomic features in negative (A) model and 2522 in positive (B) mode. The PLS-DA score plots showed time-progression changes after i.v. challenge of Rd. | ||
OPLS-DA distinguished Rd-treated and vehicle-treated mice (Fig. 6, the excluded data were the same as PLS-DA). At 10 min post-injection, the total degree of separation between the two groups reached the levels of high predictive quality. R2 of this model in negative and positive modes was 0.96 and 0.98; Q2 was 0.50 and 0.68, respectively (Fig. 6A1 and B1). By the 30 min time point, R2 in negative and positive modes was 0.99 and 0.98; Q2 was 0.59 and 0.55, respectively (Fig. 6A2 and B2). Meanwhile, R2 of the OPLS-DA model of 2 h post-challenge in negative and positive modes was both 1.00; Q2 was 0.65 and 0.63, respectively (Fig. 6A3 and B3). Therefore, these data demonstrated that the OPLS-DA model was suitable for fitness and prediction. This separation roughly mirrored that no overlap between Rd and control samples was observed even at 10 min post-injection, which means that the anaphylactoid reaction induced by Rd may happen very rapidly.
 | ||
| Fig. 6 The OPLS-DA score plots of metabolomics features between Rd groups and control groups. Each time point includes 8 mice per group except the 30 min-point and 2 h-point of Rd in the negative model and 30 min-point of control group in the positive mode for the outliers. Each sample encompasses 1719 metabolomic features in negative (A) model and 2522 in positive (B) mode. The OPLS-DA score plots indicated a good separation between Rd group and control group in negative (A1, A2, A3) and positive (B1, B2, B3) model. A1 and B1: 10 min post-injection; A2 and B2: 30 min post-injection; A3 and B3: 2 h post-injection. | ||
3.5 Metabolite identification and pathway analysis
The VIP (variable importance in the projection) value, which reflects the relative contribution of each X variable to the model, is a weighted sum of squares of the PLS weights. Metabolites with larger VIP values were considered as the candidates of potential biomarkers, such as larger than 1.41 Moreover, S-plot is a scatter plot that can be utilized to explain the variable influence on the model by combining covariance (x-axis) and correlation loading profiles (y-axis), which is also useful for the extraction of putative metabolites.42 Thus, the S-plot and VIP values large than 1.8 were used together to select the potential metabolite biomarkers. Candidate biomarkers were identified based on the description in “Experimental section”. Metabolic pathway analysis was performed with the MetaboAnalyst tool (http://www.metaboanalyst.ca/), to preliminarily identify the affected metabolic pathways and facilitate further biological interpretation.43 As shown above, at 10 min post-injection, there already had a clear separation in the OPLS-DA score plots between control and Rd samples, thus the significantly altered metabolites were further identified at 10 min post-challenge. From S-plot of OPLS-DA by 10 min post-challenge, endogenous metabolites which displayed significant differences between control and Rd groups were revealed (ESI Fig. 4†).Accordingly, 20 endogenous metabolites in plasma samples at 10 min post-injection were tentatively identified (Table 1). All of them were recognized on the basis of their molecular ion information and corresponding fragments of product ion. As an example, the endogenous metabolite with m/z 621.3 in negative ion mode was detailed to illustrate the marker identification process. The accurate mass of the potential marker was determined at first. Its corresponding peak was made out according to its retention time in total ion chromatogram from ESI− scan, after that an accurate mass of the marker ([M − H]− at m/z 621.3118) was found from the mass spectrum. Then particular MS/MS information about fragmentation pattern of the marker was acquired using the Q-TOF/MS system. In the negative ion mode, MS/MS figure contained the main fragment ions [M − H − C9H17O10P]− + 305.2406, [M − H − C23H40O4]− + 241.0119, [M − H − C21H36O2 − H2O]− + 283.2491. With a mass tolerance of 5 ppm, C29H51O12P was located as the candidate because of its high mass accuracy among all possible compounds. Finally, the metabolite was identified as phosphatidylinositol [PI(20:3/0:0)] according to the METLIN and LIPID MAPS database. The literature data were also used to confirm the result that in the negative-ion spectra molecular species of PI mainly give the [M − H]− ions.44
| Retention time | m/z | Mass accuracya (ppm) | VIP | Formula | Metabolites | Trendb | p value (ANOVA)c |
|---|---|---|---|---|---|---|---|
| a Mass accuracy (ppm) was calculated according to the exact mass on the Pubchem website.b Compared with vehicle control group:↑, increased; ↓, decreased.c All p values were less than 0.05. | |||||||
| 8.11 | (−)361.202 | −2.21 | 2.23849 | C21H30O5 | Cortisol | ↑ | 4.28 × 10⁻³ |
| 8.13 | (+)363.2166 | −2.48 | 2.62641 | C21H30O5 | Dihydroprednisolone | ↑ | 2.58 × 10⁻⁵ |
| 8.28 | (−)498.2895 | −2.01 | 2.07984 | C26H45NO6S | Tauroursodeoxycholic acid | ↓ | 9.60 × 10⁻³ |
| 9.75 | (−)393.2646 | −1.27 | 2.24413 | C23H38O5 | HETE-G | ↑ | 4.15 × 10⁻³ |
| 9.77 | (−)345.2071 | −2.32 | 2.05831 | C21H30O4 | 13,14-Dehydro-15-cyclohexyl carbaprostacyclin | ↑ | 1.06 × 10⁻² |
| 13.93 | (+)542.3241 | 0.18 | 2.27371 | C28H48NO7P | PC(20:5/0:0) |
↑ | 1.07 × 10⁻³ |
| 14.24 | (−)568.2681 | −1.76 | 1.97511 | C28H44NO9P | PS(22:6/0:0) |
↑ | 1.53 × 10⁻² |
| 14.48 | (+)544.3398 | 1.10 | 2.42328 | C28H50NO7P | LysoPC(20:4) |
↑ | 2.91 × 10⁻⁴ |
| 14.54 | (+)482.3241 | 1.24 | 2.3968 | C23H48NO7P | PC(15:0/0:0) |
↓ | 3.75 × 10⁻⁴ |
| 14.65 | (−)621.3045 | −3.06 | 1.9129 | C29H51O12P | PI(20:3/0:0) |
↑ | 1.98 × 10⁻² |
| 14.8 | (+)544.3398 | 1.65 | 2.39249 | C28H50NO7P | PC(20:4) |
↑ | 3.90 × 10⁻⁴ |
| 15.07 | (−)317.2122 | −1.89 | 2.2901 | C20H30O3 | HEPE | ↓ | 3.19 × 10⁻³ |
| 15.18 | (+)496.3398 | 1.41 | 2.50502 | C24H50NO7P | LysoPC(16:0) |
↓ | 1.23 × 10⁻⁴ |
| 15.99 | (+)510.3554 | −2.55 | 2.02002 | C25H52NO7P | PC(16:0/O-1:0) |
↓ | 5.73 × 10⁻³ |
| 16.26 | (+)510.3554 | 1.18 | 2.01394 | C25H52NO7P | PC(O-16:0/1:0) |
↓ | 5.92 × 10⁻³ |
| 16.59 | (+)327.2894 | −2.44 | 1.81178 | C20H38O3 | 19-Oxo-eicosanoic acid | ↓ | 1.64 × 10⁻² |
| 16.67 | (+)510.3554 | 1.18 | 2.03904 | C25H52NO7P | PC(17:0/0:0) |
↓ | 5.13 × 10⁻³ |
| 18.48 | (+)538.3867 | 0.37 | 2.3769 | C27H56NO7P | PC(O-18:0/1:0) |
↓ | 4.50 × 10⁻⁴ |
| 18.91 | (+)538.3867 | 0.93 | 2.39304 | C27H56NO7P | PC(19:0/0:0) |
↓ | 3.88 × 10⁻⁴ |
| 21.1 | (−)331.2643 | −2.11 | 1.98894 | C22H36O2 | Adrenic acid | ↑ | 1.44 × 10⁻² |
As shown in Table 1, at 10 min post-challenge, cortisol, dihydroprednisolone, hydroxy-eicosatetraenoic acid-glyceride (HETE-G), 13,14-dehydro-15-cyclohexyl carbaprostacyclin, phosphatidylcholine [PC(20:5/0:0)], phosphatidylserine [PS(22:6/0:0)], lysophosphatidylcholine [LysoPC(20:4)], PI(20:3/0:0), phosphatidylcholine [PC(20:4)], and adrenic acid were observed to be significantly increased in Rd-treated group (p < 0.05), whereas the levels of tauroursodeoxycholic acid, PC(15:0/0:0), hydroxy-eicosapentaenoic acid (HEPE), LysoPC(16:0), PC(16:0/O-1:0), PC(O-16:0/1:0), 19-oxo-eicosanoic acid, PC(17:0/0:0), PC(O-18:0/1:0), and PC(19:0/0:0) were observed to be markedly decreased (p < 0.05).
Metabolic pathway analysis showed that lipid metabolism was disordered by Rd treatment, such as glycerophospholipid metabolism, arachidonic acid metabolism, biosynthesis of unsaturated fatty acids, and steroid hormone biosynthesis.
4. Discussion
4.1 Rd-induced anaphylactoid reaction confirmed by the general toxicological assessments
The RBL-2H3 cell line is commonly used in allergy, inflammation and immunological research.10 Its degranulation can be elicited by IgE-receptor (FcεRI) cross-linking with exposed antigen or basic secretagogues, leading to secretion of variety of pro-inflammatory mediators, such as histamine, serotonin, eicosanoides, and platelet activating factors as well as various cytokines and chemokines.45 Usually, RBL-2H3 cells were sensitized with monoclonal antidinitrophenyl (DNP)-specific immunoglobulin E (IgE) and challenged with DNP-bovine serum albumin (BSA) to elicit the degranulation in the IgE-mediated mast cell activation research.46 However, secretagogues, such as C48/80, are direct mass cell releasers without prior sensitization. The mechanism of C48/80 as a potent and direct inducer of mast cell degranulation is associated with the perturbation in the lipid bilayer of cellular membrane and interacting with Go and Gi proteins and the G protein-coupled receptors to promote the early events of downstream signaling.47,48 In our study, degranulation of RBL-2H3 was monitored by the release of β-hexosaminidase, which has been found to be associated with a variety of inflammatory diseases.38 Our results showed that Rd can directly and dose-dependently increase the degranulation of RBL-2H3 cells, while the positive control C48/80 caused less release of β-hexosaminidase at the concentration with similar cell viability, as previously described.49Histamine acts as a major mediator in the immediate-phase of an allergic response. It is most crucial for angioedema, vasodilation, increased vascular permeability, tissue edema, bronchoconstriction, and hypothermia.50 Substantial increase of histamine levels in mice plasma was clearly observed in Rd and C48/80-treated groups at 10 min post-injection in this study, indicating the anaphylactoid reaction induced by Rd in vivo. The cutaneous vascular permeability assay is a localized cutaneous allergic response as a consequence of allergen-induced vascular permeability and plasma extravasation. It has already been used to detect pseudoallergy induced by injectable drugs using rat or mice models.51,52 Previous studies have shown that mice cutaneous vascular permeability assay is a suitable model for the detection of anaphylactoid reaction.30,31 In this study, Rd could directly and dose-dependently stimulate mouse skin mast cells and increase vascular permeability of mouse back skin. Thus, the results confirmed that Rd could induce anaphylactoid reaction in vivo.
4.2 Metabolite changes of Rd-induced anaphylactoid reaction in mice
Metabolic intermediates of a sequential series of reactions often change more pronouncedly than enzymatic kinetics or individual fluxes.24 This study provides a comprehensive characterization and quantitation of changes in metabolites due to Rd-induced anaphylactoid reaction. As shown in Fig. 5, the time-dependent tendency of Rd treatments to the control group was obtained. Among the altered metabolites found at 10 min post-injection, PC, LysoPC, PS, PI, corticosteroid hormones, sterol lipids, bile acids, and fatty acids are predominantly responsible for the differences between Rd and vehicle control groups (p < 0.05).Several altered metabolites are of special interest since they are directly related to the cellular events occurring during inflammation or allergic diseases. For instance, endogenous cortisol, which is produced from cholesterol and cholic acid, is known to modulate immune responses in lung and exert broad anti-inflammatory activities.53 The elevated levels of cortisol and dihydroprednisolone in Rd group indicated the steroid hormone biosynthesis was disordered. HETE-G and HEPE derived via the lipoxygenase (LOX) pathway that is responsible for the leukotriene family of mediators54–56 were also disordered in our study. However, the specific isomers of HETE-G and HEPE could not be determined due to their similar retention times and mass spectra. Among these potential metabolites, 12-HETE-G is generated by 12-LOX, whereas 15-HETE-G, a product of 15-LOX, is a peroxisome proliferator-activated receptor (PPAR)α agonist.54 Besides, 12(S)-HEPE is a metabolite of eicosapentaenoic acid (EPA), and EPA suppresses the synthesis of prostaglandin E2 and thromboxane B2 by competitive inhibition of the cyclooxygenase 1 (COX-1) and 2 (COX-2) pathways,55 and PGE2 is also related to arachidonic acid metabolism.57 Consistently, Xu et al.27 also demonstrated that arachidonic acid metabolism was disrupted in Xuesaitong injection-induced anaphylactoid reaction, which is a TCMI containing Rd. Despite we showed the level of histamine was increased in Rd-treated mice through ELISA method, this important molecule was not detected by HPLC-QTOF/MS. The UPLC system we used in this study was a general reversed-phase (RP) liquid chromatography system which is limited to analyses high polar and/or ionic species due to poor retention of such molecules. Thus, many polar primary metabolites, including numerous amino acids, amines, and sugars, cannot be effectively analyzed in this RPLC.58
Furthermore, a large number of phospholipids were significantly altered during Rd-induced anaphylactoid reaction, indicating that Rd injection caused metabolic abnormality of phospholipids. Phospholipids are important precursors for many biologically active mediators of metabolism, including eicosanoids, diacylglycerol, and the potent anaphylactic mediator known as platelet-activating factor (PAF).56 It has been shown that PAF plays an important role in the pathogenesis of allergic reactions, acute and chronic inflammatory reactions.59 Another significant metabolite we identified, PS, is one of the activators of protein kinase C (PKC) signal transfer path.44 The activated PKC can change the structure and function of phosphorylated actin and weaken the connections between endothelial cells and matrix, increase the space of endothelial cells, as well as lead to the increase of activity of angiotensin.60–62 Thus, the activation of PKC may injury endothelial cell barrier and increases the permeability of vessel, which agreed with the result of mice cutaneous vascular permeability in this study. Besides, PC is a precursor of LysoPC. LysoPC is an important component of oxidized low-density lipoprotein, which has been confirmed to be a chemo-attractant for T lymphocytes.63 LysoPC can induce antibody formation and macrophage stimulation, which suggests LysoPC can impact on the inflammation state of an organism.55 Therefore, alterations of these compounds maybe involved in the important signaling events to trigger an anaphylactoid reaction.
A similar study about anaphylactoid reaction induced by a TCMI, Xuesaitong injection with total saponins of notoginseng as active ingredients, has recently published by another group using the same cell line RBL-2H3.21 Their results suggested that Rd–BSA conjugate, instead of Rd, showed a strong induction of RBL-2H3.21 Nevertheless, our results demonstrated that Rd was the direct inductor of RBL-2H3 degranulation using MEM media without phenol red and FBS when exposure, and the cutaneous vascular permeability and plasma histamine level were also significant increased after Rd injection. The difference between the two studies may be partially related to the different experimental conditions. Their drug treatment time was 0.5 h while it was 1 h in our study, and they used a relatively high concentration of Rd (1000 μM for Rd treatment and 1.0 mg mL−1 for Rd–BSA conjugate) that may cause cytotoxicity in cells. Therefore, some more sensitive models of anaphylactoid reaction should be executed in the future, such as beagle dogs, which are more likely to experience similar symptoms with human beings compared with other experimental animals.64,65
5. Conclusion
Our study showed Rd may be one of the allergenic ingredients in TCMIs by in vitro and in vivo experiments and this is the first report on systemic studies of anaphylactoid reaction induced by Rd. Moreover, the comprehensive analysis on metabolomics trajectories and pathways of mice undergoing Rd-induced anaphylactoid reaction showed systemic changes as anaphylactoid reaction progressed. During the early stage, inflammation and allergy diseases related metabolites were deregulated after Rd administration. So far there has been little clinical evidence or research on Rd-induced anaphylactoid reaction, more studies are warranted to understand the mechanism of Rd-induced mast cell degranulation, which has already been planned in our group. Furthermore, other allergy mediators such as complement fragments could be detected and other models like BN rats and beagle dogs could be used.Conflict of interest
The authors declare no conflicts of interest.Acknowledgements
This work was supported by the National S&T Major Project (No. 2014ZX09201022-009). The authors are grateful to Zhejiang Academy of Medical Sciences for providing the Acquity UPLC-ESI-TOF-MS platform.References
- H. Fei, Z. Qingan and Z. Man, Prog. Vet. Med., 2007, 28, 104–106 Search PubMed.
- J. Ring and H. Behrendt, Clin. Rev. Allergy Immunol., 1999, 17, 387–399 CrossRef CAS PubMed.
- P. Kallos and H. D. Schlumberger, Int. Arch. Allergy Appl. Immunol., 1987, 82, 1–3 CrossRef CAS PubMed.
- S. Robinson and I. Siyanandan, Anaesth. Intensive Care Med., 2004, 5, 298–300 CrossRef.
- K. Farnam, C. Chang, S. Teuber and M. E. Gershwin, Int. Arch. Allergy Immunol., 2012, 159, 327–345 CrossRef CAS PubMed.
- B. A. Baldo and N. H. Pham, Mechanisms of Hypersensitivity, Springer, New York, 2013, pp. 37–90 Search PubMed.
- D. K. Sreevastava and V. K. Tarneja, Med. J. Armed Forces India, 2003, 59, 53–56 CrossRef.
- J. Watkins, Monogr. Allergy, 1992, 30, 108–129 CAS.
- J. Kalesnikoff and S. J. Galli, Nat. Immunol., 2008, 9, 1215–1223 CrossRef CAS PubMed.
- E. Passante and N. Frankish, Inflammation Res., 2009, 58, 737–745 CrossRef CAS PubMed.
- Q. Chunling, D. YanFen and Y. ChongRen, Mod. Chin. Med., 2012, 14, 25–30 Search PubMed.
- R. Ye, X. Kong, Q. Yang, Y. Zhang, J. Han and G. Zhao, Neuropharmacology, 2011, 61, 815–824 CrossRef CAS PubMed.
- Z. Yang, A. Chen, H. Sun, Y. Ye and W. Fang, Vaccine, 2007, 25, 161–169 CrossRef CAS PubMed.
- R. Ye, Q. Yang, X. Kong, J. Han, X. Zhang, Y. Zhang, P. Li, J. Liu, M. Shi, L. Xiong and G. Zhao, Neurochem. Int., 2011, 58, 391–398 CrossRef CAS PubMed.
- D. Zhu, M. Liu, Y. Yang, L. Ma, Y. Jiang, L. Zhou, Q. Huang, R. Pi and X. Chen, J. Neurosci. Res., 2014, 92, 1217–1226 CrossRef CAS PubMed.
- T. Tamura, X. Cui, N. Sakaguchi and M. Akashi, Food Chem. Toxicol., 2008, 46, 3080–3089 CrossRef CAS PubMed.
- R. Ye, N. Li, J. Han, X. Kong, R. Cao, Z. Rao and G. Zhao, Neurosci. Res., 2009, 64, 306–310 CrossRef CAS PubMed.
- C. Huaying, Z. Libo and J. Ruomin, Pharmacol. Clin. Chin. Mater. Med., 2012, 02, 164–169 Search PubMed.
- X. Peng and Z. Guozhu, Her. Med., 2013, 32, 127–129 Search PubMed.
- L. Wenwu, Z. Huixia, Y. Shasha and L. Chao, Chin. J. Pharmacovigilance, 2010, 07, 690–693 Search PubMed.
- Z. Xiang, T. Qiao, H. Xiao, T. G. Kang, D. Dou, H. Li and H. Kuang, Planta Med., 2013, 79, 1043–1050 CrossRef CAS PubMed.
- S. M. Watkins and J. B. German, Curr. Opin. Mol. Ther., 2002, 4, 224–228 CAS.
- R. Kaddurah-Daouk, B. S. Kristal and R. M. Weinshilboum, Annu. Rev. Pharmacol. Toxicol., 2008, 48, 653–683 CrossRef CAS PubMed.
- R. Scrivo, L. Casadei, M. Valerio, R. Priori, G. Valesini and C. Manetti, Curr. Allergy Asthma Rep., 2014, 14, 445 CrossRef PubMed.
- X. Hu, G. P. Wu, M. H. Zhang, S. Q. Pan, R. R. Wang, J. H. Ouyang, J. G. Liu, Z. Y. Chen, H. Tian and D. B. Liu, Anal. Bioanal. Chem., 2012, 404, 887–893 CrossRef CAS PubMed.
- K. R. Chalcraft, J. Kong, S. Waserman, M. Jordana and B. E. McCarry, Metabolomics, 2014, 10, 452–460 CrossRef CAS.
- Y. Xu, D. Dou, X. Ran, C. Liu and J. Chen, J. Chromatogr. A, 2015, 1416, 103–111 CrossRef CAS PubMed.
- J. M. Yoo, D. E. Sok and M. R. Kim, Int. Immunopharmacol., 2013, 17, 123–131 CrossRef CAS PubMed.
- Y. Sugimoto, K. Umakoshi, N. Nojiri and C. Kamei, Eur. J. Pharmacol., 1998, 351, 1–5 CrossRef CAS PubMed.
- C. Shidong, Master, thesis, Shandong University, 2012.
- W. Huaishan, Master, thesis, Shandong University, 2011.
- S. J. Bruce, I. Tavazzi, V. Parisod, S. Rezzi, S. Kochhar and P. A. Guy, Anal. Chem., 2009, 81, 3285–3296 CrossRef CAS PubMed.
- W. B. Dunn, D. Broadhurst, P. Begley, E. Zelena, S. Francis-McIntyre, N. Anderson, M. Brown, J. D. Knowles, A. Halsall, J. N. Haselden, A. W. Nicholls, I. D. Wilson, D. B. Kell and R. Goodacre, Nat. Protoc., 2011, 6, 1060–1083 CrossRef CAS PubMed.
- W. Li, Y. Tang, J. Guo, E. Shang, Y. Qian, L. Wang, L. Zhang, P. Liu, S. Su, D. Qian and J. A. Duan, J. Chromatogr. A, 2014, 1346, 49–56 CrossRef CAS PubMed.
- M. Kristensen, S. B. Engelsen and L. O. Dragsted, Metabolomics, 2012, 8, 64–73 CrossRef CAS.
- C. J. Fowler, M. Sandberg and G. Tiger, Inflammation Res., 2003, 52, 461–469 CrossRef CAS PubMed.
- Y. Bae, S. Lee and S. H. Kim, Toxicol. Appl. Pharmacol., 2011, 254, 56–64 CrossRef CAS PubMed.
- V. T. Sang, C. S. Kong and S. K. Kim, Carbohydr. Polym., 2011, 84, 649–655 CrossRef.
- S. Bijlsma, I. Bobeldijk, E. R. Verheij, R. Ramaker, S. Kochhar, I. A. Macdonald, B. van Ommen and A. K. Smilde, Anal. Chem., 2006, 78, 567–574 CrossRef CAS PubMed.
- P. M. Mertes, M. C. Laxenaire and F. Alla, Anesthesiology, 2003, 99, 536–545 CrossRef PubMed.
- X. Lu, Q. Zhao, Y. Tian, S. Xiao, T. Jin and X. Fan, Int. J. Toxicol., 2011, 30, 478–491 CrossRef CAS PubMed.
- R. S. Varghese, A. Cheema, P. Cheema, M. Bourbeau, L. Tuli, B. Zhou, M. Jung, A. Dritschilo and H. W. Ressom, J. Proteome Res., 2010, 9, 2786–2793 CrossRef CAS PubMed.
- J. Xia, R. Mandal, I. V. Sinelnikov, D. Broadhurst and D. S. Wishart, Nucleic Acids Res., 2012, 40, W127–W133 CrossRef CAS PubMed.
- L. Jia, C. Wang, S. Zhao, X. Lu and G. Xu, J. Chromatogr. B: Anal. Technol. Biomed. Life Sci., 2007, 860, 134–140 CrossRef CAS PubMed.
- A. Rashid, E. Sadroddiny, H. T. Ye, A. Vratimos, S. Sabban, E. Carey and B. Helm, Mol. Immunol., 2012, 52, 224–228 CrossRef CAS PubMed.
- M. Kim, S. J. Lim, S. W. Kang, B. H. Um and C. W. Nho, J. Agric. Food Chem., 2014, 62, 3750–3758 CrossRef CAS PubMed.
- Subhashini, P. S. Chauhan, S. Kumari, D. Dash and R. Singh, Am. J. Life Sci., 2013, 1, 165–170 CrossRef.
- A. Chahdi, P. F. Fraundorfer and M. A. Beaven, J. Pharmacol. Exp. Ther., 2000, 292, 122–130 CAS.
- F. H. Huang, X. Y. Zhang, L. Y. Zhang, Q. Li, B. Ni, X. L. Zheng and A. J. Chen, Acta Pharmacol. Sin., 2010, 31, 849–854 CrossRef CAS PubMed.
- C. Cheng, D. S. Ng, T. K. Chan, S. P. Guan, W. E. Ho, A. H. Koh, J. S. Bian, H. Y. Lau and W. S. Wong, Allergy, 2013, 68, 195–203 CrossRef CAS PubMed.
- L. Aihua, L. I. Chunying, Y. I. Yan, Z. Yong, W. Yunting, L. I. Guiqin and Y. E. Zuguang, China J. Chin. Mater. Med., 2012, 37, 1865–1870 Search PubMed.
- L. Aihua, Z. Yong, L. I. Chunying, Y. I. Yan, W. Yunting, L. I. Guiqin and Y. E. Zuguang, China J. Chin. Mater. Med., 2012, 37, 1871–1874 Search PubMed.
- W. E. Ho, Y. J. Xu, F. Xu, C. Cheng, H. Y. Peh, S. R. Tannenbaum, W. S. Wong and C. N. Ong, Am. J. Respir. Cell Mol. Biol., 2013, 48, 204–211 CrossRef CAS PubMed.
- M. Alhouayek, J. Masquelier and G. G. Muccioli, Drug Discovery Today, 2014, 19, 295–304 CrossRef CAS PubMed.
- X. Ding, J. Hu, J. Li, Y. Zhang, B. Shui, Z. Ding, L. Yao and Y. Fan, Anal. Biochem., 2014, 458, 49–57 CrossRef CAS PubMed.
- X. Ding, J. Hu, C. Wen, Z. Ding, L. Yao and Y. Fan, PLoS One, 2014, 9, e88223 Search PubMed.
- N. C. Thomson, R. Chaudhuri, M. Spears, C. M. Messow, S. Jelinsky, G. Miele, K. Nocka, E. Takahashi, O. J. Hilmi, M. C. Shepherd, D. K. Miller and C. McSharry, Allergy, 2014, 69, 527–536 CrossRef CAS PubMed.
- H. G. Gika, G. A. Theodoridis, R. S. Plumb and I. D. Wilson, J. Pharm. Biomed. Anal., 2014, 87, 12–25 CrossRef CAS PubMed.
- C. C. Yost, A. S. Weyrich and G. A. Zimmerman, Biochimie, 2010, 92, 692–697 CrossRef CAS PubMed.
- G. L. King, H. Ishii and D. Koya, Kidney Int. Suppl., 1997, 60, S77–S85 CAS.
- N. Kang, G. Alexander, J. K. Park, C. Maasch, I. Buchwalow, F. C. Luft and H. Haller, Kidney Int., 1999, 56, 1737–1750 CrossRef CAS PubMed.
- J. J. Lynch, T. J. Ferro, F. A. Blumenstock, A. M. Brockenauer and A. B. Malik, J. Clin. Invest., 1990, 85, 1991–1998 CrossRef CAS PubMed.
- H. F. McMurray, S. Parthasarathy and D. Steinberg, J. Clin. Invest., 1993, 92, 1004–1008 CrossRef CAS PubMed.
- J. M. Shenton, J. Chen and J. P. Uetrecht, Chem.–Biol. Interact., 2004, 150, 53–70 CrossRef CAS PubMed.
- Y. N. Mi, N. N. Ping, X. Xiao, Y. B. Zhu, J. Liu and Y. X. Cao, PLoS One, 2014, 9, e90199 Search PubMed.
Footnote |
| † Electronic supplementary information (ESI) available. See DOI: 10.1039/c5ra24301g |
| This journal is © The Royal Society of Chemistry 2016 |