A new series of pyrenyl-based triarylamines: syntheses, structures, optical properties, electrochemistry and electroluminescence†
Ran Zhanga,
Yun Zhaoa,
Guoling Lib,
Daisheng Yanga and
Zhonghai Ni*a
aSchool of Chemical Engineering and Technology, China University of Mining and Technology, Xuzhou 221116, Jiangsu Province, P. R. China. E-mail: nizhonghai@cumt.edu.cn
bInstitute for Materials Chemistry and Engineering, Kyushu University, 744 Motooka, Nishi-Ku, Fukuoka, 819-0395, Japan
First published on 15th January 2016
Abstract
Five dipyrenyl-based triarylamines N-p-(R)-phenyl-N,N-dipyrenyl-1-amine (R = H (2a), CH3 (2b), OCH3 (2c), F (2d), NO2 (2e)) and one tripyrenyl-based triarylamine N,N-bis(7-tert-butylpyren-1-yl)-N-pyrenyl-1-amine (3py) were successfully synthesized by copper- and palladium-catalyzed coupling reactions in high yields. These compounds were structurally characterized and their photoelectric properties were analyzed by spectroscopy, electrochemical and theoretical studies. Moreover, the structures of 2b, 2c and 2d were determined by single-crystal X-ray diffraction analysis, indicating that the three compounds are all twisted paddle-like structures with a nitrogen atom as the linking center and the substituent attached to the para position of the benzene ring has an important effect on the intermolecular interactions. Compounds 2a–2d and 3py show green fluorescence emissions with excellent absolute fluorescence quantum yields in toluene (66.06–86.06%). Compound 2e displays a faint emission with a very low quantum yield because of the effect of the strong electron-withdrawing nitro group. They are thermally stable with decomposition temperatures above 355 °C. Organic light-emitting diodes incorporating the materials 2c and 2d as non-doped emitters were fabricated.
Introduction
Organic light emitting diodes (OLEDs) have attracted significant attention due to their promising applications in flat-panel displays and in general lighting applications.1–3 In the past decade, great progress has been made to design and synthesize excellent functional materials for high performance OLED devices.4–7 Among these materials, triarylamines have been paid much attention due to their excellent electron donating, their ease in oxidation of the nitrogen center and their ability to transport charge carriers with high stability.8 Hence, triarylamines have been widely employed as hole-transporting and/or emitting materials for efficient electroluminescent devices. As one of the most typical representatives, triphenylamine derivatives have been deeply and widely studied. Up to date, a large number of triphenylamine-based compounds with interesting photoelectric properties have been reported.9,10 In recent years, the synthesis of new triarylamines containing polycyclic aromatic hydrocarbons (PAHs) has become an important tendency in order to obtain excellent photoelectric materials.11,12 Indeed, many naphthyl-,13 anthryl-,14,15 fluorenyl-based16 triarylamines with interesting properties have been developed and employed as emitting and/or hole-transporting materials for photoelectric devices. In addition, PAHs-based triarylamines as emitters featuring improved charge injection and transport characteristics could effectively elevate the device performances.17–20 Therefore, the design and exploitation of new PAHs-based triarylamines should be paid much more attention in order to achieve promising functional materials.As one of the most known polyaromatic hydrocarbons, pyrene has been paid everlasting attention in the past one century because of its excellent fluorescence properties, high carrier mobility and hole-injection ability originated from its extensive flat π-conjugated molecular structure.21–24 For example, several pyrene-based tetraarylethenes with interesting aggregation-induced emission properties have been subtly designed and synthesized recently.25–27 Due to the excellent luminescent properties of pyrene and the transporting properties of triarylamines, several series of triarylamines containing pyrenyl unit have been developed, which show efficient photoelectric properties.28–32 However, to the best of our knowledge, the reported pyrene-based triarylamines are all monopyrenyl-based triarylamines, dipyrenyl- and tripyrenyl-based triarylamines have not been investigated, which may exhibit good luminescence property and hole-injection ability.
Based on the above considerations, a new series dipyrenyl- and tripyrenyl-based triarylamines N-p-(R)-phenyl-N,N-dipyrenyl-1-amine (R = H (2a), CH3 (2b), OCH3 (2c), F (2d), NO2 (2e)) and N,N-bis(7-tert-butylpyren-1-yl)-N-pyrenyl-1-amine (3py) were designed and synthesized by C–N coupling reactions. The incorporation of different substituents to benzene ring can tune the electronic structures of the objective compounds and then influences their photoelectric properties. Herein, we report the syntheses, structures, optical properties, electrochemistry of the new series of pyrenyl-based triarylamines and the performances of the simple non-doped OLED devices using two representatives (2c and 2d) as the emitting materials.
Results and discussion
Synthesis and characterization
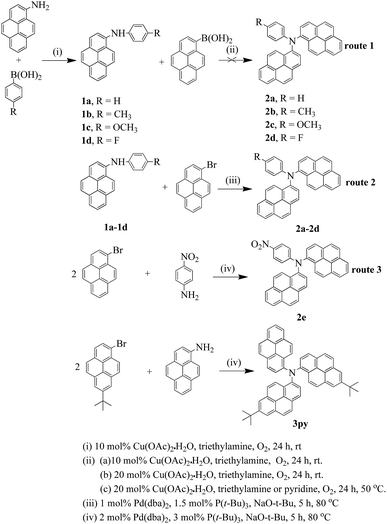
The synthetic procedures of the six compounds are presented in Scheme 1. According to the previous reports, arylamines can be obtained by copper catalyzed Ullmann condensation33 and palladium catalyzed Buchwald–Hartwig coupling reaction.34 Ullmann reaction needs rather high temperature and long reaction time with limitations on the reaction substrates. Moreover, the reaction requires strictly water-free and oxygen-free conditions which also limit its wide application. The palladium catalyzed Buchwald–Hartwig reactions can produce a more wide variety of arylamines with relatively mild conditions and high yield. A drawback for this method is that the palladium catalysts and ligands involved are very expensive and not readily available. Chan–Lam coupling35 also allows the formation of aryl C–N bond via an oxidative coupling of boronic acids with N-containing nucleophilic substrates in the air at room temperature, which gives it certain advantages over the Ullmann and Buchwald–Hartwig reactions. Thus, we adopted Chan–Lam coupling reaction to synthesize the key intermediates using 1-aminepyrene and p-(R)-phenylboronic acid as the precursors. Then, the intermediate compounds 1a–1d were successfully obtained in moderate yields. But this method has no effect on some arylboronic acids whose para position is functionalized with strong electron-withdrawing groups, such as nitro group. Based on the intermediates 1a–1d, we plan to utilize the Chan–Lam coupling to obtain the target products (2a–2d). Regrettably, the tries under various conditions were fruitless (route 1 in Scheme 1). It is probably that the N-arylation with boronic acids just has an effect on the C–N(heteroarene) bond transformation.35 Fortunately, we finally successfully obtained the final products (2a–2e) in excellent yields employing palladium catalyzed Buchwald–Hartwig coupling reaction (route 2 and 3 in Scheme 1), furthermore, the compound 2e was synthesized by a one-pot process. Gratifyingly, the tripyrenyl-based compound 3py can also be obtained through the one-pot method with a medium yield.Photophysical properties
The absorption properties of compounds 2a–2e and 3py were measured in dichloromethane and toluene, and the results are listed in Table 1. The absorption spectra of the six compounds in dichloromethane are shown in Fig. 1. The longest wavelength absorptions at ca. 380–425 nm are attributed to the charge transfer from amine to pyrene. The absorptions at ca. 325 nm seem to be ascribed to pyrene localized π–π* transitions, which are similar to those of monopyrenyl-based triarylamines.32 The higher energy bands appearing at ca. 272–275 nm are observed for compounds 2a–2e, which may be assigned to pyrene and phenyl localized π–π* transitions.30,36 For compounds 2a–2e, the charge transfer transitions from amine to pyrene show a fascinating trend because of the different electron-donating abilities of the peripheral substituents attached to the phenyl ring. Slight red-shift absorptions are observed for compounds 2b and 2c compared to that of 2a, which is due to the introduction of the electron-donating groups of methyl and methoxy. Compound 2d displays a smaller hypsochromic shift than those of 2b and 2c and the same to that of 2a even though it contains an electron-withdrawing fluorine group. The reason for this phenomenon might be that the fluorine on the para of the phenyl ring cannot alter the electron structure of the whole molecule obviously. However, the compound 2e which contains a strong electron-withdrawing nitro group has an apparent blue-shift (Δλ = 11 nm) compared to that of compound 2a. It is probably due to that the longest absorption are attributed to a coexistence of an electron transfer from amine to nitro unit and a charge transfer from amine to pyrene. Thus, the absorptions of compounds 2a–2e in the longest wavelength are highly dependent on the electron-donating abilities of the substituents, when the electron-donating ability increases, the charge-transfer interaction between amine and pyrene also increases. Furthermore, it is necessary to compare the absorptions of dipyrenyl- and tripyrenyl-based compounds with the monopyrenyl-based triarylamine N,N-diphenylpyren-1-amine 1py (Scheme S1†). The λmax of compounds 2a–2d and 3py shifted toward long wavelength compared to that of 1py due to the increase of conjugation. However, the compound 2e exhibits a small blue-shift relative to that of 1py, which probably demonstrates a presence of an electron transfer between the amine and the electron-withdrawing nitro unit.| Com. | λmax (nm) | Fluo. emission λem (nm) (ΦFa (%)) | Stokes shift [cm−1] | ||||
|---|---|---|---|---|---|---|---|
| DCM | TOL | DCM | TOL | Film | DCM | TOL | |
| a Absolute quantum yield measured in solutions using integrating sphere. | |||||||
| 2a | 275, 333, 407 | 333, 410 | 486 (49.15) | 459 (81.71) | 473 (12.61) | 3994 | 2604 |
| 2b | 275, 333, 411 | 334, 412 | 491 (34.45) | 467 (67.67) | 482 (28.83) | 3964 | 2857 |
| 2c | 275, 334, 413 | 335, 416 | 504 (38.28) | 480 (86.02) | 499 (20.21) | 4372 | 3207 |
| 2d | 275, 333, 407 | 334, 409 | 482 (37.85) | 460 (69.39) | 485 (30.04) | 3823 | 2711 |
| 2e | 272, 329, 396 | 334, 398 | 467 (1.04) | 444 (3.35) | 584 (3.47) | 3839 | 2603 |
| 3py | 337, 410 | 337, 413 | 494 (29.26) | 469 (66.06) | 498 (12.14) | 4147 | 2891 |
| 1py | 275, 300, 400 | 302, 402 | 463 | 446 | 472 | ||
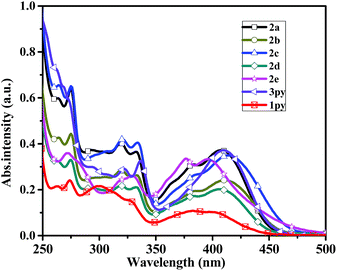 | ||
| Fig. 1 Absorption spectra of the compounds 2a–2e, 3py and 1py recorded in dichloromethane at 1 × 10⁻⁵ M concentration. | ||
From the data presented in Table 3, it is evident that the substituent on the para position of phenyl ring influences the energy gaps of the compounds. The relatively strong electron-donating moieties such as methoxy group can shrink the band gap, while the electron-withdrawing units like nitro widen the band gap, suggesting that enhancing the amine donor to pyrene acceptor interaction is expected to decrease the band gap.
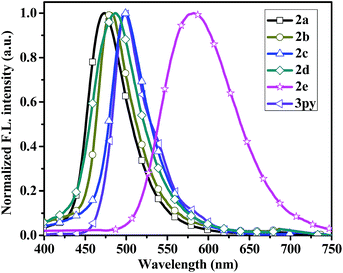
The fluorescent emission spectra of compounds 2a–2e, 3py and 1py were recorded in dilute dichloromethane (10−5 M) as shown in Fig. 2 and the relevant data are presented in Table 1. Dipyrenyl-based triarylamines 2a–2e and tripyrenyl-based compound 3py show a progressive red-shift compared to that of monopyrenyl-based compound 1py due to the increase of conjugation. For the compounds 2a–2e and 3py, the emission peaks appear in the range of 444–480 nm and systematically vary in agreement with the absorption spectra. Compounds 2b and 2c exhibit red-shift relative to 2a, while compounds 2d and 2e show blue-shift ca. 4 nm and ca. 19 nm compared to that of 2a, respectively. In short, the emission maximums show progressive red-shift with increasing the electron-donating ability of the substituents on the phenyl ring and blue-shift are observed when the electron-withdrawing strength of the substituents raise. The compounds 2a–2d and 3py in dichloromethane show bright green emissions. While it is worth noting that 2e is almost non-emissive because the incorporation of a strong electron-withdrawing nitro group might lead to the occurrence of photo-induced electron transfer from the donor to acceptor. The effects of concentration on the emission of compounds 2a–2d and 3py in dichloromethane were also measured (Fig. S1†). The intensities of the emission gradually increase with the increase of the concentration from 1.0 × 10⁻⁸ M to 1.0 × 10⁻⁶ M. However, the fluorescence intensities decrease when the concentration increases to 10−5 M due to the aggregation-induced quenching effect. Compounds 2a–2e and 3py show small Stokes' shifts (3823–4372 cm−1 in dichloromethane), indicating less energy loss during the relaxation process and thereby ensuring efficient fluorescence.
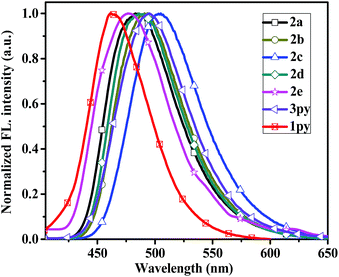 | ||
| Fig. 2 Normalized emission spectra of the compounds 2a–2e, 3py and 1py recorded in dichloromethane at 1 × 10⁻⁵ M concentration. | ||
In the thin films, compounds 2a–2c exhibit slight blue-shift in their emission profiles and bandwidth narrowing phenomenon (Fig. 3), which suggests that the polarity of the solid films are less than that in dichloromethane solution. On the contrary, the emission spectra of compound 2d and 3py in thin film state exhibits a small bathochromic shift (3 nm and 4 nm) relative to that in dichloromethane solution, which indicates that the two compounds exhibit a very similar conformation in both states.37 However, the film emissions of 2a–2d and 3py show red-shift (14–26 nm) compared to that in toluene solution, implying that there exist π–π stacking in film states. Particularly, the emission spectrum of compound 2e in solid state is significantly red-shift by ca. 117 nm to that observed in dichloromethane. There are probably two reasons for the enormous red-shift. The major reason is that the incorporation of strong electron-withdrawing nitro group increase the charge separation resulting in dipole–dipole relaxation in the excited state38 and another possible cause is due to the intermolecular π–π stacking.
The absolute fluorescence quantum yields ΦFs of compounds 2a–2d and 3py recorded in solutions such as dichloromethane (from 29.26 to 49.15%), toluene (from 66.06 to 86.02%) and in thin films (from 12.14 to 30.04%) were determined using an integrating sphere (Table 1). Compounds 2a–2d and 3py show high ΦFs in nonpolar solvents such as toluene. However, the ΦFs exhibit significant reduction in polar solvents such as dichloromethane. It clearly states that the main energy decay channel in compounds 2a–2d and 3py is dipolar relaxation which is noteworthy in polar solvents.39 The ΦF of 3py shows an obvious decline in dichloromethane compared to those of 2a–2d, which indicates that the intermolecular π–π interactions is increased due to the increasing number of pyrene ring in the molecule. The ΦFs of compounds 2a–2d and 3py measured in solid films are apparently much smaller than those in dichloromethane and toluene due to the strong intermolecular π–π interactions in solid states. The ΦFs of compound 2e both in solutions and thin film are very low, indicating that the nitro group is effectively involved in an electron-transfer quenching of the excited state.
To better understand the effect of environments on the electronic spectroscopic of the compounds, we selected 2a–2d and 3py as candidates to study the absorption and emission spectra in different polar solvents such as toluene (TOL), dichloromethane (DCM), tetrahydrofuran (THF), methanol (MeOH), N,N-dimethylformamide (DMF) and acetonitrile (MeCN). The pertinent data are summarized in Tables S1 and S2.† The changes in absorption and emission profiles for compound 2a with different solvent polarities are illustrated in Fig. 4. The spectra of compounds 2b–2d and 3py in different solvent polarities are shown in Fig. S2–S4.† In the absorption spectra, compounds 2a–2d and 3py are insensitive to the solvent polarity with the shift below 7 nm. In the emission spectra, compounds 2a–2d and 3py display a remarkable and positive solvatochromism, which indicates that the excited state is more stable in polar solvent probably due to the separation of charges in the higher energy state.38 A decreased fluorescence quantum yield and an increased band width are also observed in the solvent of higher polarity. Furthermore, the relationships of Stokes' shifts against the solvent parameter ET (30) of the compounds 2a–2d and 3py were investigated as shown in Fig. S5.†
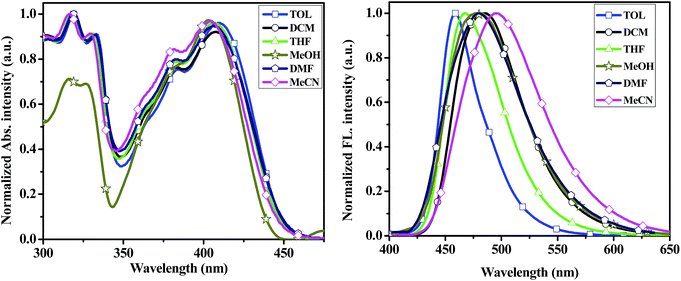 | ||
| Fig. 4 UV-vis absorption (left) and emission spectra (right) of the compound 2a recorded in different solvents at ∼10−5 concentration. | ||
Crystal structure and theoretical calculation
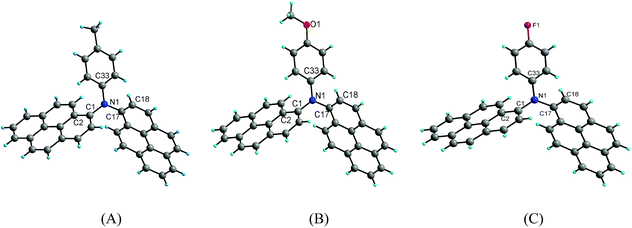
Suitable single crystals of compounds 2b, 2c and 2d for X-ray crystallography were obtained by the slow evaporation of a mixture of dichloromethane/methanol at room temperature. However, efforts to obtain the suitable single crystals of 2a and 2e were failed. The detailed information about the crystal data for compounds 2b–2d is summarized in Table 2. Compounds 2b and 2c crystallize in the triclinic crystal system with space group P![[1 with combining macron]](https://www.rsc.org/images/entities/char_0031_0304.gif) , whereas compound 2d crystallizes in the monoclinic crystal system with space group P21/c. The crystal structure diagrams of the three compounds are shown in Fig. 5.
, whereas compound 2d crystallizes in the monoclinic crystal system with space group P21/c. The crystal structure diagrams of the three compounds are shown in Fig. 5.
| Parameter | 2b | 2c | 2d |
|---|---|---|---|
| Empirical formula | C39H25N | C39H25NO | C38H24FNO |
| Mr (g mol−1) | 507.60 | 523.60 | 529.58 |
| T/K | 123 | 123 | 123 |
| Wavelength (Å) | 0.71073 | 0.71073 | 0.71073 |
| Crystal system | Triclinic | Triclinic | Monoclinic |
| Space group | P![[1 with combining macron]](https://www.rsc.org/images/entities/char_0031_0304.gif) |
P![[1 with combining macron]](https://www.rsc.org/images/entities/char_0031_0304.gif) |
P21/c |
| a/Å | 10.979(2) | 10.920(2) | 11.218(3) |
| b/Å | 11.264(2) | 11.212(2) | 19.743(5) |
| c/Å | 12.763(3) | 12.802(3) | 13.558(4) |
| α (°) | 115.84(3) | 115.66(3) | 90 |
| β (°) | 110.99(3) | 106.77(3) | 113.822(9) |
| γ (°) | 90.42(3) | 90.89(3) | 90 |
| V (Å3) | 1301.0(7) | 1334.7(7) | 2747.0(13) |
| Z | 2 | 2 | 4 |
| Dcalc (g cm−3) | 1.296 | 1.303 | 1.28 |
| F(000) | 532.0 | 548.0 | 1104.0 |
| μ (mm−1) | 0.074 | 0.077 | 0.081 |
| Unique reflections | 4524 | 4641 | 4810 |
| Observed reflections | 3233 | 3521 | 2863 |
| Parameters | 363 | 372 | 367 |
| R (int) | 0.0511 | 0.0653 | 0.0916 |
| R [I > 2σ(I)] | 0.0497 | 0.0629 | 0.0727 |
| wR2 (all data) | 0.1119 | 0.1645 | 0.2472 |
| GOF on F2 | 0.972 | 1.038 | 1.000 |
X-ray diffraction analysis shows that compounds 2b, 2c and 2d are twisted paddle-like structures with nitrogen atom as the linking center as expected. Although the substituent on the para of the phenyl is different, the structures of the three compounds are extremely similar to each other. The bond lengths of C–N in the three compounds are in a narrow range of 1.419(2)–1.442(5) Å. The C–O bond length in the structure of compound 2c is 1.372(2) Å for Cpyrenyl–O and 1.415(3) Å for Cmethyl–O. The bond length of C–F in compound 2d is 1.368(5) Å. The bond angles of C–N–C in the three compounds range from 115.92(13)–125.44(11)°. In the three crystal structures, the two pyrenyl rings are completely not coplanar with the phenyl ring, which are evidenced by the dihedral angles in the range of 62.92(11)–77.87(11)°. Of course, the two pyrenyl units in the three compounds are also significantly twisting with the dihedral angle in the range from 85.63(3)° to 89.52(13)°. The four atoms including the central nitrogen atom and the three carbons bonded by nitrogen atom are almost coplanar with the maximal deviation of 0.111(2) Å (N1) for 2b, 0.112(2) Å (N1) for 2c and 0.149(5) Å (N1) for 2d.
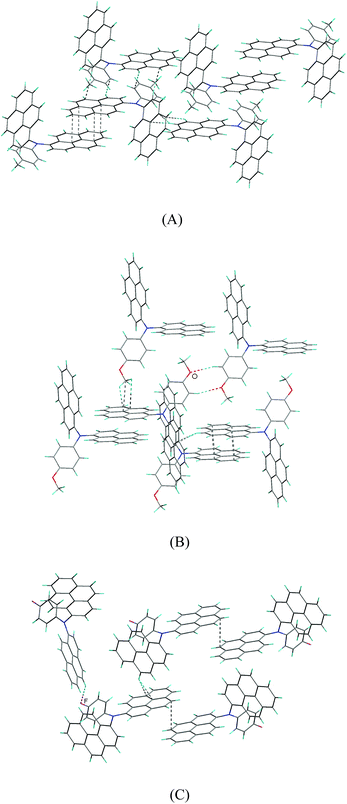
There are affluent intermolecular interactions for the three compounds as shown in their crystal packing diagrams (Fig. 6 and S6†). For compounds 2b and 2c, firstly, two independent units of 2b and 2c are linked together by relatively strong π–π interactions, forming dimeric supramolecular structures, in which the two neighboring pyrenyl moieties display nearly face-to-face pattern with the shortest intermolecular C–C distance of 3.565(2) Å for 2b and 3.503(2) Å for 2c, respectively. Then, these dimers are connected by affluent C–H⋯π interactions, forming three-dimensional (3D) network supramolecular structures. In addition, there is C–H⋯O hydrogen bonds for compound 2c.
For compound 2d, the pyrenyl rings in the supramolecular dimer are marginally overlap with the shortest intermolecular C–C distance of 3.639(5) Å, suggesting that the π–π stacking interaction between the pyrenyl rings for compound 2d are relatively weak compared to those of compounds 2b and 2c. Then, these supramolecular dimers for compound 2d are linked by C–H⋯π interactions, forming two-dimensional supramolecular layer structures. Finally, these layers are linked together through C–H⋯F hydrogen bonds, giving 3D network supramolecular structure.
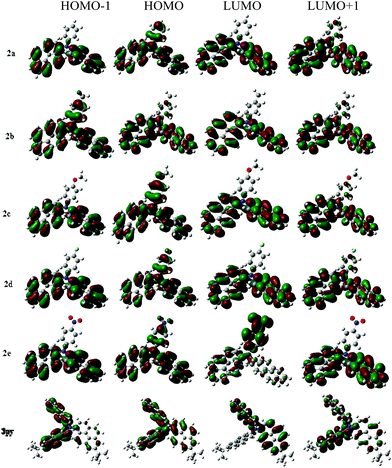
To deeply investigate the electronic structures of compounds 2a–2e, 3py and understand the absorption characteristics, density functional theory (DFT) calculations (B3LYP/6-31G(d,p) basis set) were performed on compounds 2a–2e and 3py with the Gaussian 09W software package. The HOMO–LUMO energy gaps (Eg cal.) were calculated and are presented in Table 3. The prominent wavelength vertical transitions and their oscillator strengths (f) obtained from the computations are summarized in Table 4. Electronic distributions in the frontier molecular orbitals of compounds 2a–2e and 3py are shown in Fig. 7.
| Com. | Eox(ΔEp)a, mV | Egb/Eg cal.c (eV) | HOMO/LUMOd (eV) | HOMO/LUMOc ((DFT)(eV)) | Td/°C | Tg/°C |
|---|---|---|---|---|---|---|
| a Measured in dry dichloromethane. All Eox data are reported relative to ferrocene.b Eg = 1240/λonset.c Obtained from the quantum chemical calculation.d HOMO values were deduced from the relation: HOMO = Eox + 4.8. LUMO values were calculated from the relation band gap = HOMO − LOMO. | ||||||
| 2a | 0.385 (130) | 2.73/3.21 | −5.185/−2.455 | −4.834/−1.626 | 377 | ND |
| 2b | 0.335 (105) | 2.70/3.18 | −5.135/−2.435 | −4.780/−1.602 | 369 | 131 |
| 2c | 0.285 (125) | 2.67/3.12 | −5.085/−2.415 | −4.699/−1.579 | 370 | 131 |
| 2d | 0.390 (140) | 2.71/3.20 | −5.190/−2.480 | −4.878/−1.675 | 360 | 131 |
| 2e | 0.600 (155) | 2.77/3.28 | −5.400/−2.730 | −5.267/−2.086 | 355 | 163 |
| 3py | 0.760 (135) | 2.70/3.19 | −5.560/−2.860 | −5.345/−2.155 | 425 | 238 |
| Com. | λabs (nm) | f | Assignment |
|---|---|---|---|
| 2a | 446.29 | 0.3282 | HOMO → LUMO (96.4%) |
| 421.50 | 0.0962 | HOMO−1 → LUMO (6.7%) | |
| HOMO → LUMO+1 (90.0%) | |||
| 356.82 | 0.0317 | HOMO → LUMO+2 (63.2%) | |
| 2b | 451.58 | 0.3274 | HOMO → LUMO (96.6%) |
| 426.51 | 0.1045 | HOMO−1 → LUMO (5.7%) | |
| HOMO → LUMO+1 (91.1%) | |||
| 358.59 | 0.0283 | HOMO → LUMO+2 (74.0%) | |
| 2c | 461.92 | 0.3111 | HOMO → LUMO (96.8%) |
| 433.67 | 0.1197 | HOMO−1 → LUMO (4.5%) | |
| HOMO → LUMO+1 (92.2%) | |||
| 362.56 | 0.0287 | HOMO → LUMO+2 (79.8%) | |
| 2d | 447.05 | 0.3308 | HOMO → LUMO (96.5%) |
| 422.40 | 0.0927 | HOMO−1 → LUMO (6.5%) | |
| HOMO → LUMO+1 (90.3%) | |||
| 357.60 | 0.0261 | HOMO → LUMO+2 (74.2%) | |
| 2e | 437.07 | 0.2866 | HOMO → LUMO (97.7%) |
| 424.30 | 0.2564 | HOMO−2 → LUMO (2.4%) | |
| HOMO → LUMO+1 (93.8%) | |||
| 390.51 | 0.0061 | HOMO → LUMO+2 (79.0%) | |
| 3py | 480.50 | 0.3975 | HOMO → LUMO (97.4%) |
| 456.82 | 0.2609 | HOMO−1 → LUMO (2.3%) | |
| HOMO → LUMO+1 (97.5%) | |||
| 411.19 | 0.0135 | HOMO → LUMO+2 (85.5%) |
The measured wavelength absorption peaks and energy gaps of these compounds are smaller than the theoretically forecast values but the changing tendencies are similar. The predicted vertical transitions and their assignments are summarized in Table 4, indicating that there are three prominent absorptions for the compounds. The longest wavelength transitions are mainly due to the electronic excitation from the HOMO to LUMO, while the second absorptions largely result from the HOMO to LUMO+1 electronic excitation. Electronic distributions observed from the frontier orbitals of compounds 2a–2d are approximately identical. However, the electronic distributions of compound 2e with a nitro group exhibit obvious differences with those of 2a–2d. For compounds 2a–2d and 3py, the HOMO orbitals are contributed by the whole triarylamine molecules and the LUMO orbitals are mainly distributed over the pyrenyl segments, which indicates that the longest absorption bands realized for the 2a–2d and 3py can be assigned to a charge transfer from amine to pyrene. Compound 2e shows a longest vertical transition at 437 nm which is primarily composed of a HOMO to LUMO electron transfer. The HOMO for compound 2e is mostly spread over the triarylamine that is away from the nitro group, while the LUMO is chiefly delocalized over nitrophenyl unit, which indicates that the longest wavelength transition at 437 nm is probably attributed to an amine to nitrophenyl charge transfer. The LUMO+1 for compound 2e is composed of the pyrenyl rings, which indicates that the second transition stems from the charge transfer from the amine to the pyrenyl units. Additionally, involving the nitro group in the triarylamine decreases the oscillator strength of the first absorption with a concomitant increment in the second absorption, which indicates that the charge transfer from amine to pyrenyl units is competitive with that from amine to nitrophenyl moiety.
Electrochemical and thermal studies
The electrochemical properties of compounds 2a–2e and 3py were studied by cyclic voltammetry (CV) measurements and the oxidation potentials of these compounds were calculated by calibrating with the internal ferrocene standard (Fig. S7†). The relevant parameters are collected in Table 3. Compounds 2a–2e and 3py display one quasi-reversible oxidation wave at relatively low oxidation potential arising from the oxidation of the amine. The influence of the substituent at the para position of phenyl ring on the oxidation potential is apparent for compounds 2a–2e. The electron-donating groups (OMe > Me > H) decline the onset oxidation potential (2c < 2b < 2a), whereas the electron-withdrawing substituents (NO2 > F > H) increase the onset oxidation potential (2e > 2d > 2a). The highest occupied molecular (HOMO) values were evaluated from the oxidation potentials by comparing with the ionization potential of ferrocene (HOMO = Eox + 4.8, where Eox is obtained by subtraction of the half-peak potential of ferrocene (E1/2) from oxidation potential of the compound, E1/2 = +0.44 eV relative to the calomel electrode). The HOMO values were observed to be −5.185, −5.135, −5.085, −5.190, −5.400, −5.560 eV for 2a, 2b, 2c, 2d, 2e, 3py, respectively. The HOMO of compound 3py is much lower than compounds 2a–2e due to the extension of conjugation, which indicates that dipyrenyl-based triarylamines possessing better hole-injection and hole-transporting abilities than tripyrenyl-based triarylamines for simple device. The lowest unoccupied molecular orbital (LUMO) values for the compounds were estimated from the relation: LUMO = HOMO − Eg, and the optical energy gaps (Eg) are derived from the lowest energy absorption onsets in the absorption spectra. The LUMO values of the compounds were determined to be −2.455, −2.435, −2.415, −2.480, −2.730, −2.860 eV for 2a, 2b, 2c, 2d, 2e, 3py, respectively. From the absorption edge, the band gaps (Eg) of the compounds are 2.73, 2.70, 2.67, 2.71, 2.77, 2.70 eV for 2a, 2b, 2c, 2d, 2e, 3py, respectively. The results indicate that different substituents in the compounds can inevitably result in different energy states of the whole molecule.The glass transition temperatures (Tg) and the decomposition temperatures (Td) of the synthesized compounds were determined with DSC and TGA respectively (Fig. S8† and Table 3). The whole compounds show high thermally stability and the Td values corresponding to 5% weight loss under nitrogen atmosphere are in the range of 355–425 °C. The thermal property of 3py is improved than the dipyrenyl-based compounds 2a–2e which may due to the increased molecular weights. DSC thermograms of compounds 2b–2e and 3py exhibit noticeable Tg peaks in the range of 131–238 °C. Compound 2a does not show obvious Tg most likely due to its crystallinity and smaller heat capacity.
Electroluminescence
Compounds 2c and 2d as two representatives were used as the non-doped emitting layers (EMLs) in OLEDs with the following structure: ITO/PEDOT:PSS (40 nm)/EML (30 nm, 55 nm, 80 nm, 105 nm)/TmPyPB (50 nm)/LiF (1 nm)/Al (100 nm). Among which, poly(3,4-ethylenedioxythiophene):ploy(4-styrenesulfonate) (PEDOT:PSS) acts as the hole injection layer, 1,3,5-tri[(3-pyridyl)-phen-3-yl]benzene (TmPyPB) is used as an electron-transporting material, 2c and 2d are green emitters. The structures and the energy levels of compounds 2c and 2d used in these devices are shown in Fig. S9† and the essential performance parameters are demonstrated in Table 5. The results suggest that the hole injection into the emitting layers of devices 2c and 2d is efficient because of the extremely small barrier between the hole injection material (−5.2 eV for PEDOT:PSS) and the emitting material (−5.09 eV for 2c and −5.19 eV for 2d).| Device | Structure | Vona | λmaxb | Lmaxc | ηd | EQEe | CIEf |
|---|---|---|---|---|---|---|---|
| a Turn-on voltage (V) at a luminance of 1 cd m−2.b Emission maximum.c Maximum luminance (cd m−2) at the applied voltage (V).d Luminance efficiency (cd A−1).e External quantum efficiency (%).f CIE coordinates (x, y). | |||||||
| I | ITO/PEDOT:PSS/2c (30 nm)/TmPyPB/LiF/Al | 2.8 | 508 | 4713 | 2.47 | 0.84 | 0.24, 0.60 |
| II | ITO/PEDOT:PSS/2c (55 nm)/TmPyPB/LiF/Al | 2.9 | 514 | 3778 | 5.41 | 1.12 | 0.26, 0.60 |
| III | ITO/PEDOT:PSS/2c (80 nm)/TmPyPB/LiF/Al | 2.9 | 509 | 2871 | 2.06 | 0.60 | 0.28, 0.57 |
| IV | ITO/PEDOT:PSS/2c (105 nm)/TmPyPB/LiF/Al | 3.6 | 499 | 953 | 1.94 | 0.78 | 0.23, 0.56 |
| V | ITO/PEDOT:PSS/2d (30 nm)/TmPyPB/LiF/Al | 3.6 | 483 | 3429 | 1.45 | 0.29 | 0.14, 0.35 |
| VI | ITO/PEDOT:PSS/2d (55 nm)/TmPyPB/LiF/Al | 4.5 | 482 | 1283 | 1.55 | 0.04 | 0.16, 0.35 |
| VII | ITO/PEDOT:PSS/2d (80 nm)/TmPyPB/LiF/Al | 6.2 | 481 | 228 | 0.96 | 0.48 | 0.17, 0.36 |
| VIII | ITO/PEDOT:PSS/2d (105 nm)/TmPyPB/LiF/Al | 8.1 | 470 | 167 | 0.13 | 0.06 | 0.29, 0.36 |
The current density–voltage–luminance (I–V–L) characteristics of the OLED devices are shown in Fig. 8. The performance of the devices is related to the thickness of the emitters. When the thicknesses of emitters are 30 nm, the device I based on compound 2c exhibits a maximum luminance (Lmax) of 4713 cd m−2, an external quantum efficiency (EQE) of 0.84% and a turn-on voltage of 2.8 V, and the performance of device V based on 2d is less efficient with a Lmax of 3429 cd m−2, a EQE of 0.29% and a turn-on voltage of 3.6 V. The turn-on voltages are very low due to the small hole-injection barrier, indicating decent device performance. The maximum efficiencies of 5.41 cd A−1 for 2c and 1.55 cd A−1 for 2d are obtained from the devices II and VI when the thicknesses of the emitters are 55 nm.
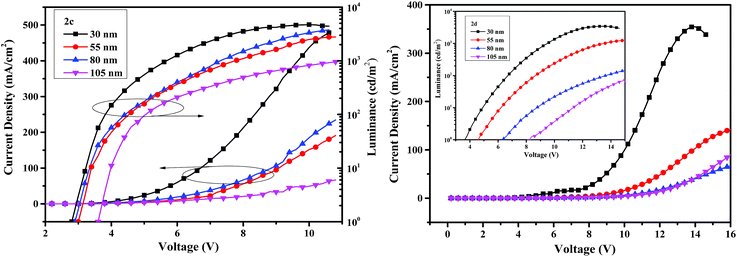 | ||
| Fig. 8 The current density–voltage–luminance curves with varying thickness of the compounds 2c (left) and 2d (right). | ||
The electroluminescent (EL) spectra of devices 2c and 2d with different thicknesses are given in Fig. 9. When thicknesses of emitters are 30, 55 and 80 nm, the maximum EL emission peaks all locate at 507 nm for 2c, which are slightly red-shift compared with the PL spectrum probably due to the microcavity effect.40 While the maximum EL peaks at 483 nm for 2d, which are matched with the PL spectrum. No emission shoulders at a longer wavelength due to excimer and exciplex species formed at the interface of the EML and TmPyPB layers are detected.
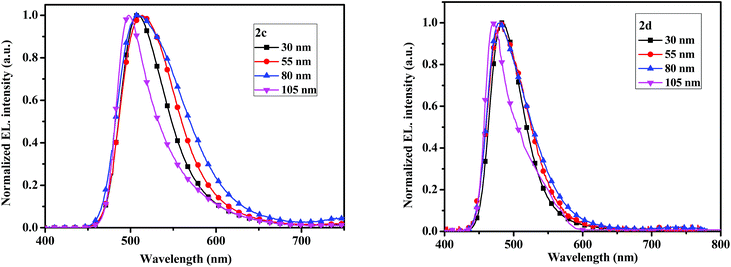 | ||
| Fig. 9 The electroluminescent spectrum with varying thickness of the compounds 2c (left) and 2d (right). | ||
Experimental
Materials and methods
Dichloromethane was distilled from calcium hydride. The 4 Å molecular sieves were activated before use. All other chemicals were purchased from commercial sources and used without further purification. 1H and 13C NMR spectra were collected on a Bruker-400 MHz or Bruker-600 MHz spectrometer in CDCl3 or DMSO solutions with TMS as an internal standard. Mass spectra were obtained on a Bruker Ultraflextreme MALDI TOF/TOF mass spectrometer or an IonSpec HiRes MALDI FT mass spectrometer. Elemental analysis (C, H, N) of the dried solid samples were carried out using an Elementary Vario El analyzer. UV-vis spectra were recorded on Shimadzu UV-3600 with a UV-VIS-NIR spectrophotometer. Emission spectra were performed by a HITACHI fluorescence spectrometer (F-4600). The absolute fluorescence quantum yields (ΦF) were determined by FM-4P-TCSPC Transient State Fluorescence Spectrometer using an integrating sphere for dilute solutions (dichloromethane and toluene) and thin films which obtained by drop-casting on quartz plate. Cyclic voltammetry experiments were performed with a CHI660A electrochemical work station. All measurements were carried out at room temperature with a conventional three-electrode configuration consisting of a glassy carbon working electrode, a platinum auxiliary electrode and a calomel reference electrode. The solvent in all experiments was dry dichloromethane and the supporting electrolyte was 0.1 M tetrabutylammonium hexafluorophosphate. The solutions were purged with nitrogen for 5 min prior to the measurement. All scans were performed at a scan rate 0.05 V s−1. The E1/2 values were determined as 1/2 (Eap + Ecp), where Eap and Ecp are the anodic and cathodic peak potentials, respectively. All potentials reported are referenced to ferrocene which was used as internal standard toward the end of each experiment. The glass-transition temperatures (Tg) of the compounds were determined with differential scanning calorimetry (DSC) under a nitrogen atmosphere by using a DSC6000 (PerkinElmer). Samples were heated to 300 or 400 °C at a rate of 10 °C min−1 and cooled at 10 °C min−1 then heated again under the same heating conditions as used in the initial heating process. Decomposition temperature (Td) were determined with thermogravimetric analysis (TGA) under a nitrogen atmosphere by using a DTG-60AH (Shimadzu). Samples were heated to 800 °C at a rate of 10 °C min−1. Crystals data of compounds were selected on a Bruker APEX II CCDC diffractometer with graphite-monochromated Mo-Kα radiation (λ = 0.71073 Å) at 123 K using the ω-scan technique. The structures were solved by direct methods with the SHELXS-97 (ref. 41) computer program, and refined by full-matrix least-squares methods (SHELXL-97) on F2. The ground state geometries of all molecules were fully optimized using density functional theory (DFT) at the B3LYP/6-31G(d,p) level, as implemented in Gaussian 09W software package.42 The electronic transitions were calculated using the time-dependent DFT (B3LYP) theory and the 6-31G(d,p) basis sets.OLED fabrication and performance evaluation
Poly(ethylenedioxythiophene):poly(styrenesulfonate) (PEDOT:PSS) (Baytron PAI 4083) and TmPyPB were purchased from Heraeus Precious Metals GmbH Co. KG and Luminescence Technology Corp., respectively. The OLEDs have a structure of indium tin oxide (ITO)/PEDOT:PSS (40 nm)/2c or 2d (30 nm, 55 nm, 80 nm, 105 nm)/TmPyPB (50 nm)/LiF (1 nm)/Al (150 nm).43 For the device fabrication, a 40 nm-thick PEDOT:PSS layer was spin-coated from an aqueous dispersion of PEDOT:PSS onto the onto the pre-cleaned ITO substrate and then annealed at 120 °C for 30 min in air condition. Subsequently, the EML was spin-coated with four different thicknesses from its fresh tetrahydrofuran solution at a spin speed of 1800 rpm and then annealed at 100 °C for 30 min. to remove the residual solvent at N2 atmosphere in a glove box. Finally, the structure of TmPyPB (50 nm)/LiF (1 nm)/Al (150 nm) was thermally deposited in sequence in a vacuum chamber at a pressure less than 4 × 10⁻⁴ Pa through a shadow mask with an array of 14 mm2 openings. The current density–voltage–luminance (I–V–L) characteristics were measured using a Keithley source measurement unit (Keithley 2400) with a calibrated silicon photodiode. The EL spectra of the devices were measured using a SpectraScan PR650 spectrophotometer. All measurements were carried out at room temperature under ambient conditions. External quantum efficiency (EQE) of the devices were calculated from the luminance, current density and EL spectra, assuming a Lambertian distribution.Synthetic procedures
A similar procedure with phenylboronic acid, p-methylphenylboronic acid, p-methoxyphenylboronic acid and p-fluorophenylboronic acid was followed for the synthesis of 1a–1d.
N-Phenylpyrene-1-amine (1a) was obtained as a white powder solid (silica gel column chromatography from hexane/dichloromethane mixture, 3![[thin space (1/6-em)]](https://www.rsc.org/images/entities/char_2009.gif) :
:![[thin space (1/6-em)]](https://www.rsc.org/images/entities/char_2009.gif) 2). Yield: 0.88 g, 75%. Mp: 143–146 °C. 1H-NMR (400 MHz, d6-DMSO) δ (ppm): 8.70 (s, 1H), 8.39 (d, J = 9.2 Hz, 1H), 8.24–7.95 (m, 8H), 7.28 (t, J = 7.8 Hz, 2H), 7.18 (d, J = 8.0 Hz, 2H), 6.89 (t, J = 7.3 Hz, 1H). 13C-NMR (101 MHz, d6-DMSO) δ (ppm): 145.19 (s), 138.42 (s), 131.88 (s), 131.58 (s), 129.68 (s), 127.90 (s), 126.75 (s), 126.38 (d, J = 10.7 Hz), 125.95 (d, J = 6.7 Hz), 125.13 (s), 124.98 (s), 124.77 (s), 122.87 (s), 121.93 (s), 120.49 (s), 117.64 (d, J = 21.9 Hz). Elemental analysis: anal. calcd for C22H15N: C, 90.07; H, 5.15; N, 4.77. Found: C, 91.02; H, 5.13; N, 4.70%. GC/MSD: m/z 293 [M]+.
2). Yield: 0.88 g, 75%. Mp: 143–146 °C. 1H-NMR (400 MHz, d6-DMSO) δ (ppm): 8.70 (s, 1H), 8.39 (d, J = 9.2 Hz, 1H), 8.24–7.95 (m, 8H), 7.28 (t, J = 7.8 Hz, 2H), 7.18 (d, J = 8.0 Hz, 2H), 6.89 (t, J = 7.3 Hz, 1H). 13C-NMR (101 MHz, d6-DMSO) δ (ppm): 145.19 (s), 138.42 (s), 131.88 (s), 131.58 (s), 129.68 (s), 127.90 (s), 126.75 (s), 126.38 (d, J = 10.7 Hz), 125.95 (d, J = 6.7 Hz), 125.13 (s), 124.98 (s), 124.77 (s), 122.87 (s), 121.93 (s), 120.49 (s), 117.64 (d, J = 21.9 Hz). Elemental analysis: anal. calcd for C22H15N: C, 90.07; H, 5.15; N, 4.77. Found: C, 91.02; H, 5.13; N, 4.70%. GC/MSD: m/z 293 [M]+.
N-(p-Methylphenyl)pyrene-1-amine (1b) was obtained as faint yellow plate crystals. Yield: 0.80 g, 66%. Mp: 168–169 °C. 1H-NMR (400 MHz, d6-DMSO) δ (ppm): 8.60 (s, 1H), 8.41 (d, J = 9.2 Hz, 1H), 8.15–8.08 (m, 4H), 8.03–7.86 (m, 4H), 7.12 (s, 4H), 2.27 (s, 3H). 13C-NMR (101 MHz, d6-DMSO) δ (ppm): 142.17 (s), 139.33 (s), 131.84 (d, J = 33.4 Hz), 130.15 (s), 129.85 (s), 127.94 (s), 126.69 (s), 126.39 (s), 126.17 (s), 125.99 (s), 125.32 (s), 125.09 (s), 124.63 (d, J = 12.3 Hz), 124.17 (s), 122.80 (s), 120.92 (s), 118.69 (s), 116.38 (s), 20.84 (s). Elemental analysis: anal. calcd for C23H17N: C, 89.87; H, 5.57; N, 4.56. Found: C, 89.85; H, 5.54; N, 4.61%. GC/MSD: m/z 307 [M]+.
N-(p-Methoxyphenyl)pyrene-1-amine (1c) was obtained as green plate crystals. Yield: 0.76 g, 59%. Mp: 164–166 °C. 1H-NMR (400 MHz, d6-DMSO) δ (ppm): 8.53 (s, 1H), 8.46 (d, J = 9.2 Hz, 1H), 8.12–8.06 (m, 4H), 7.98–7.94 (m, 2H), 7.87 (d, J = 8.8 Hz, 1H), 7.72 (d, J = 8.4 Hz, 1H), 7.23 (d, J = 8.8 Hz, 2H), 6.95 (d, J = 8.8 Hz, 2H), 3.76 (s, 3H). 13C-NMR (101 MHz, d6-DMSO) δ (ppm): 154.96 (s), 140.69 (s), 137.15 (s), 131.98 (d, J = 37.6 Hz), 127.99 (s), 126.61 (d, J = 4.5 Hz), 125.99 (d, J = 17.6 Hz), 125.24 (s), 124.47–123.89 (m), 122.58 (s), 121.93 (s), 119.53 (s), 115.18 (s), 114.40 (s), 55.74 (s). Elemental analysis: anal. calcd for C23H17NO: C, 85.42; H, 5.30; N, 4.33; O, 4.95. Found: C, 85.34; H, 5.35; N, 4.93%. GC/MSD: m/z 323 [M]+.
N-(p-Fluorophenyl)pyrene-1-amine (1d) was obtained as a faint yellow power solid. Yield: 0.53 g, 43%. Mp: 131–132 °C. 1H-NMR (600 MHz, d6-DMSO) δ (ppm): 8.71 (s, 1H), 8.39 (d, J = 6.0 Hz, 1H), 8.18–8.15 (m, 3H), 8.12 (d, J = 9.6 Hz, 1H), 8.04 (d, J = 9.0 Hz, 1H), 8.01–7.99 (m, 1H), 7.96 (d, J = 9.0 Hz, 1H), 7.86 (d, J = 7.8 Hz, 1H), 7.21–7.19 (m, 2H), 7.16–7.13 (m, 2H). 13C-NMR (ppm): (151 MHz, d6-DMSO) δ 157.98 (s), 156.42 (s), 141.27 (s), 139.00 (s), 131.94 (s), 131.61 (s), 127.93 (s), 126.78 (s), 126.43 (d, J = 5.1 Hz), 125.92 (s), 125.62 (s), 124.97 (d, J = 6.8 Hz), 124.74 (s), 124.34 (s), 122.67 (s), 121.16 (s), 119.79 (d, J = 8.2 Hz), 116.52 (s), 116.36 (s), 116.21 (s). Elemental analysis: anal. calcd for C22H14FN: C, 85.42; H, 5.30; N, 4.33; O, 4.95. Found: C, 85.38; H, 5.35; N, 4.30%. GC/MSD: m/z 311 [M]+
N-Phenyl-N,N-dipyrenyl-1-amine (2a) was obtained as a yellow powder solid. Yield: 0.74 g, 75%. Mp > 300 °C. 1H-NMR (400 MHz, CDCl3) δ (ppm): 8.36 (d, J = 9.2 Hz, 2H), 8.10–8.01 (m, 16H), 7.94 (s, 2H), 7.02–6.86 (s, 3H). MALDI TOF-MS: m/z 493.189 [M]+. Elemental analysis: anal. calcd for C38H23N: C, 92.46; H, 4.70; N, 2.84. Found: C, 94.24; H, 4.82; N, 2.64%.
N-p-(Methyl)-phenyl-N,N-dipyrenyl-1-amine (2b) was obtained as yellow-green crystals. Yield: 0.81 g, 80%. Mp: 263–265 °C. 1H-NMR (400 MHz, CDCl3) δ (ppm): 8.36 (d, J = 9.2 Hz, 2H), 8.18 (d, J = 7.6 Hz, 2H), 8.05 (m, 10H), 7.91 (d, J = 9.2 Hz, 2H), 7.79 (d, J = 8.4 Hz, 2H), 6.99 (d, J = 8.4 Hz, 2H), 6.79 (d, J = 8.4 Hz, 2H), 2.31 (s, 3H). 13C-NMR (101 MHz, CDCl3) δ (ppm): 148.78 (s), 142.95 (s), 131.43 (s), 131.13 (s), 130.58 (s), 129.77 (s), 128.78 (s), 127.63 (s), 127.31 (s), 126.67 (d, J = 10.1 Hz), 126.44 (s), 126.10 (d, J = 12.3 Hz), 125.76 (s), 125.05–124.93 (m), 123.58 (s), 120.92 (s), 58.49 (s), 29.71 (s), 20.70 (s). MALDI TOF-MS: m/z 507.213 [M]+. Elemental analysis: anal. calcd for C39H25N: C, 92.28; H, 4.96; N, 2.76. Found: C, 90.45; H, 4.82; N, 2.98%.
N-p-(Methoxy)-phenyl-N,N-dipyrenyl-1-amine (2c) was obtained as yellow-green bulk crystals. Yield: 0.87 g, 83%. Mp: 257–259 °C. 1H-NMR (400 MHz, CDCl3) δ (ppm): 8.35 (d, J = 9.6 Hz, 2H), 8.18 (t, J = 7.6 Hz, 2H), 8.11–7.97 (m, 7.6 Hz, 10H), 7.89 (d, J = 9.2 Hz, 2H), 7.73 (d, J = 8.4 Hz, 2H), 6.89 (d, J = 9.2 Hz, 2H), 6.77 (d, J = 8.8 Hz, 2H), 3.79 (s, 3H). 13C-NMR (101 MHz, CDCl3) δ (ppm): 154.63 (s), 143.44 (s), 131.14 (s), 128.57 (s), 127.42 (d, J = 20.1 Hz), 126.49 (s), 126.16 (s), 125.68 (d, J = 8.7 Hz), 124.94 (d, J = 12.2 Hz), 123.56 (s), 122.10 (s), 114.60 (s), 55.48 (s). MALDI TOF-MS: m/z 523.124 [M]+. Elemental analysis: anal. calcd for C39H25NO: C, 89.46; H, 4.81; N, 2.68. Found: C, 91.25; H, 4.62; N, 2.81%.
N-p-(Fluoro)-phenyl-N,N-dipyrenyl-1-amine (2d) was obtained as a yellow powder. Yield: 0.82 g, 80%. Mp: 284–286 °C. 1H-NMR (400 MHz, CDCl3) δ (ppm): 8.33 (d, J = 9.2 Hz, 2H), 8.20 (d, J = 8.0 Hz, 2H), 8.12–7.99 (m, 10H), 7.93 (d, J = 9.2 Hz, 2H), 7.78 (d, J = 8.4 Hz, 2H), 6.87 (m, 4H). 13C-NMR (101 MHz, CDCl3) δ (ppm): 158.92 (s), 156.53 (s), 147.35 (s), 142.42 (s), 131.08 (s), 128.96 (s), 127.84 (s), 127.28 (s), 126.81 (s), 126.60 (s), 126.47 (s), 126.26 (s), 125.86 (d, J = 6.7 Hz), 125.22–124.95 (m), 123.34 (s), 122.03 (d, J = 7.8 Hz), 115.98 (s), 115.75 (s). MALDI TOF-MS: m/z 511.284 [M]+. Elemental analysis: anal. calcd for C38H22FN: C, 89.21; H, 4.33; N, 2.74. Found: C, 88.01; H, 4.15; N, 2.96%.
Conclusions
In conclusion, a new series of dipyrenyl- and tripyrenyl-based triarylamines have been elaborately designed and successfully synthesized by copper and palladium catalyzed C–N coupling reactions. The optical properties indicate that the dipyrenyl-based compounds with electron-donating and weak electron-withdrawing groups show green emissions with excellent absolute quantum yields, while the compound with strong electron-withdrawing nitro group is almost non-emissive and display very low quantum efficiency. The DFT calculations show that the substituents attached to the para position of phenyl ring have significant influence on the electronic structures of the compounds, which further affects their optical and electrochemical properties. Compounds 2c and 2d have been acted as non-doped emitters in simple OLEDs. Lower turn-on voltage obtained is due to the low hole-injection barrier of the devices. Preliminary research of the devices show moderate brightness and efficiencies, the compounds as dopant and hole-transporting layer will be further carried out in our lab.Acknowledgements
This work was supported by the Fundamental Research Funds for the Central Universities (2015XKMS047).References
- J. H. Huang, J. H. Su, X. Li, M. K. Lam, K. M. Fung, H. H. Fan, K. W. Cheah, C. H. Chen and H. Tian, J. Mater. Chem., 2011, 21, 2957 RSC.
- L. H. Liu, X. J. Liu, B. H. Zhang, J. Q. Ding, Z. Y. Xie and L. X. Wang, J. Mater. Chem. C, 2015, 3, 5050 RSC.
- K. R. J. Thomas, J. T. Lin, Y. T. Tao and C. W. Ko, Adv. Mater., 2000, 12, 1949 CrossRef CAS.
- D. C. Chercka, S. J. Yoo, M. Baumgarten, J. J. Kim and K. Müllen, J. Mater. Chem. C, 2014, 2, 9083 RSC.
- D. Karthik, K. R. J. Thomas, J. H. Jou, S. Kumar, Y. L. Chen and Y. C. Jou, RSC Adv., 2015, 5, 8727 RSC.
- H. P. Shi, Z. H. Gong, D. H. Xin, J. Roose, H. Peng, S. Chen, J. W. Y. Lamb and B. Z. Ben, J. Mater. Chem. C, 2015, 3, 9095 RSC.
- J. H. Huang, J. H. Su and H. Tian, J. Mater. Chem., 2012, 22, 10977 RSC.
- Z. J. Ning and H. Tian, Chem. Commun., 2009, 5483 RSC.
- M. Liang and J. Chen, Chem. Soc. Rev., 2013, 42, 3453 RSC.
- Z. Ning, Z. Chen, Q. Zhang, Y. Yan, S. Qian, Y. Cao and H. Tian, Adv. Funct. Mater., 2007, 17, 3799 CrossRef CAS.
- Y. T. Tao, C. L. Yang and J. G. Qin, Chem. Soc. Rev., 2011, 40, 2943 RSC.
- C. Lambert, J. Ehbets, D. Rausch and M. Steeger, J. Org. Chem., 2012, 77, 6147 CrossRef CAS PubMed.
- K. Goushi, R. Kwong, J. J. Brown, H. Sasabe and C. Adachi, J. Appl. Phys., 2004, 95, 7798 CrossRef CAS.
- M. X. Yu, J. P. Duan, C. H. Lin, C. H. Cheng and Y. T. Tao, Chem. Mater., 2002, 14, 3958 CrossRef CAS.
- H. Lee, B. J. Kim, S. Kim, J. Kim, J. Lee, H. Shin, J. H. Leeb and J. Park, J. Mater. Chem., 2014, 2, 4737 CAS.
- A. Yella, R. Humphry-Baker, B. F. E. Curchod, N. A. Astani, J. Teuscher, L. E. Polander, S. Mathew, J.-E. Moser, I. Tavernelli, U. Rothlisberger, M. Grätzel, M. K. Nazeeruddin and J. Frey, Chem. Mater., 2013, 25, 2733 CrossRef CAS.
- A. M. Thangthong, N. Prachumrak, R. Tarsang, T. Keawin, S. Jungsuttiwong, T. Sudyoadsuk and V. Promarak, J. Mater. Chem., 2012, 22, 6869 RSC.
- T. M. Figueira-Duarte and K. Müllen, Chem. Rev., 2011, 111, 7260 CrossRef CAS PubMed.
- H. J. Nie, C. J. Yao, J. Y. Shao, J. Yao and Y. W. Zhong, Chem.–Eur. J., 2014, 20, 17454 CrossRef CAS PubMed.
- H. Surya Prakash Rao and S. Vijjapu, RSC Adv., 2014, 4, 25747 RSC.
- A. G. Crawford, A. D. Dwyer, Z. Q. Liu, A. Steffen, A. Beeby, L. O. Pålsson, D. J. Tozer and T. B. Marder, J. Am. Chem. Soc., 2011, 133, 13349 CrossRef CAS PubMed.
- P. Kotchapradist, N. Prachumrak, R. Tarsang, S. Jungsuttiwong, T. Keawin, T. Sudyoadsuk and V. Promarak, J. Mater. Chem. C, 2013, 1, 4916 RSC.
- B. R. Kaafarani, A. O. El-Ballouli, R. Trattnig, A. Fonari, S. Sax, B. Wex, C. Risko, R. S. Khnayzer, S. Barlow, D. Patra, T. V. Timofeeva, E. J. W. List, J. L. Brédas and S. R. Marder, J. Mater. Chem. C, 2013, 1, 1638 RSC.
- C. Tang, F. Liu, Y. J. Xia, L. H. Xie, A. Wei, S. B. Li, Q. L. Fan and W. Huang, J. Mater. Chem., 2006, 16, 4074 RSC.
- Z. M. Zhang, Z. Yun, R. Zhang, L. F. Zhang, W. Q. Cheng and Z. H. Ni, Dyes Pigm., 2015, 118, 95 CrossRef CAS.
- Z. J. Zhao, S. H. Ye, Y. J. Guo, Z. F. Chang, L. Y. Lin, T. Jiang, J. W. Y. Lam, P. Lu, H. Y. Qiu, Y. Q. Liu and B. Z. Tang, Org. Electron., 2011, 12, 2236 CrossRef CAS.
- Z. J. Zhao, S. M. Chen, J. W. Y. Lam, Z. M. Wang, P. Lu, F. Mahtab, H. H. Y. Sung, I. D. Williams, Y. G. Ma, H. S. Kwok and B. Z. Tang, J. Mater. Chem., 2011, 21, 7210 RSC.
- T. Keawin, N. Prachumrak, S. Namuangruk, C. S. Pansay, N. Kungwan, S. Maensiri, S. Jungsuttiwong, T. Sudyoadsukb and V. Promarak, RSC Adv., 2015, 5, 73481 RSC.
- K. R. J. Thomas, J. T. Lin, Y. T. Tao and C. W. Ko, J. Am. Chem. Soc., 2001, 123, 9404 CrossRef CAS PubMed.
- X. Feng, J. Y. Hu, L. Yi, N. Seto, Z. Tao, C. Redshaw, M. R. J. Elsegood and T. Yamato, Chem.–Asian J., 2012, 7, 2854 CrossRef CAS PubMed.
- J. Y. Hu, M. Era, M. R. J. Elsegood and T. Yamato, Eur. J. Org. Chem., 2010, 2010, 72 CrossRef.
- K. R. Justin Thomas, M. Velusamy, J. T. Lin, C. H. Chuen and Y. T. Tao, J. Mater. Chem., 2005, 15, 4453 RSC.
- F. Monnier and M. Taillefer, Angew. Chem., Int. Ed., 2009, 48, 6954 CrossRef CAS PubMed.
- A. R. Muci and S. L. Buchwald, Top. Curr. Chem., 2002, 219, 131 CrossRef CAS.
- K. S. Rao and T. S. Wu, Tetrahedron, 2012, 68, 7735 CrossRef.
- A. Nantalaksakul, A. Mueller, A. Klaikherd, C. J. Bardeen and S. Thayumanavan, J. Am. Chem. Soc., 2009, 131, 2727 CrossRef CAS PubMed.
- J. Y. Hu, X. L. Ni, X. Feng, M. Era, M. R. J. Elsegood, S. J. Teat and T. Yamato, Org. Biomol. Chem., 2012, 10, 2255 CAS.
- N. Kapoor and K. R. J. Thomas, New J. Chem., 2010, 34, 2739 RSC.
- Z. H. Guo, Z. X. Jin, J. Y. Wang and J. Pei, Chem. Commun., 2014, 50, 6088 RSC.
- Z. Zhao, G. Y. K. Chan, S. Chen, C. Deng, J. W. Y. Lam, C. K. W. Jim, Y. Hong, P. Lu, Z. Chang, X. Chen, P. Lu, H. S. Kwok, H. Qiu and B. Z. Tang, J. Mater. Chem., 2012, 22, 4527 RSC.
- G. M. Sheldrick, Acta Crystallogr., Sect. A: Found. Crystallogr., 2008, 64, 112 CrossRef CAS PubMed.
- M. J. Frisch, G. W. Trucks, H. B. Schlegel, G. E. Scuseria, M. A. Robb and J. R. Cheeseman, Gaussian 09, revision A.02, Gaussian, Inc., Wallingford, CT, 2009 Search PubMed.
- S. M. Wang, X. D. Wang, B. Yao, B. Z. Zhang, J. Q. Ding, Z. Y. Xie and L. X. Wang, Sci. Rep., 2015 DOI:10.1038/srep12487.
- T. M. Figueira-Duarte, S. C. Simon, M. Wagner, S. I. Druzhinin, K. A. Zachariasse and K. Müllen, Angew. Chem., Int. Ed., 2008, 47, 10175 CrossRef CAS PubMed.
Footnote |
| † Electronic supplementary information (ESI) available: CCDC numbers 1056681 (2b), 1056682 (2c), 1056680 (2d). One- and two-dimensional supramolecular structures of 2d. PL, cyclic voltammetry and NMR spectra. Energy levels of devices. DSC and TGA thermograms. CCDC 1056680–1056682. For ESI and crystallographic data in CIF or other electronic format see DOI: 10.1039/c5ra26017e |
| This journal is © The Royal Society of Chemistry 2016 |

