 Open Access Article
Structure and chemistry of surface-doped Pt:SnO2 gas sensing materials†
David
Degler
a,
Hudson W.
Pereira de Carvalho
bc,
Kristina
Kvashnina
de,
Jan-Dierk
Grunwaldt
b,
Udo
Weimar
a and
Nicolae
Barsan
*a
aUniversity of Tübingen, Institute of Physical and Theoretical Chemistry, Auf der Morgenstelle 15, 72076 Tübingen, Germany. E-mail: nb@ipc.uni-tuebingen.de; Tel: +49 7071 29 78761
bKarlsruhe Institute of Technology, Institute for Chemical Technology and Polymer Chemistry, Engesserstr. 20, 76131 Karlsruhe, Germany
cCentro de Energia Nuclear na Agricultura, Universidade de São Paulo, P. O. Box 96, 13400-970, Piracicaba, SP, Brazil
dESRF, BP220, 6 rue Jules Horowitz, 38043 Grenoble, France
eHelmholtz-Zentrum Dresden-Rossendorf (HZDR), Institute of Resource Ecology, P. O. Box 510119, 01314, Dresden, Germany
First published on 11th March 2016
Abstract
Surface-doped Pt:SnO2 was synthesized by impregnation of calcined SnO2 made by an aqueous sol–gel route. The structure of the introduced Pt-dopant and its behaviour during gas exposure were examined by in situ and operando X-ray absorption spectroscopy. The results reveal that Pt forms a nano-sized PtO2 phase, which was not found for bulk and surface doped materials, studied previously. In a comparative investigation of undoped and Pt-doped SnO2 gas sensors the performance and the surface chemistry were investigated, the latter one using operando FT-IR spectroscopy. The results prove the strong influence of the different Pt structures on the surface chemistry of SnO2, providing the basis for an understanding on the varying sensor performance of differently synthesized Pt:SnO2 gas sensing materials.
1. Introduction
Gas sensors based on semiconducting metal oxides, first and foremost SnO2, are widely used for the detection of flammable and toxic gases such as CO, H2 or CH4.1,2 Under typical gas sensing conditions – high background humidity and the presence of interfering gases – pure SnO2 materials show a strongly decreased sensor signal, sensitivity and stability. In order to overcome this disadvantage noble metals like Pd3–12 or Pt3,5,13–18 are added to SnO2, changing its surface chemistry and/or electrical properties.17,18 Previous studies have shown, that already small differences in the introduction method of the noble metal, (doping before or after calcination, calcination temperature or noble metal concentration) lead to very different dopant structures and thus gas sensing properties.3,5,19,20 However, these results were obtained by ex situ techniques, like photoelectron spectroscopy or electron microscopy, and the derived structural parameters can thus not be directly applied to explain the effect of noble metal doping during gas sensing.21,22 An improved approach to understand the role of noble metals in gas sensing materials is the use of operando spectroscopic techniques which allow the examination of gas sensors under operating conditions. X-ray absorption spectroscopy (XAS) has been proven to be a suitable operando techniques to study structural parameters of even low concentrated noble metals (0.2% wt) in gas sensing materials, by interpretation of the extended X-ray absorption fine structure (EXAFS), and the behaviour of the noble metal in various atmospheric conditions, mainly obtained by the analysis of the X-ray absorption near edge structure (XANES).23–25 Complementary to the structural evaluation the surface chemistry of gas sensing layers can be studied by operando diffuse reflectance infrared Fourier-transform spectroscopy (DRIFTS), revealing surface species actively interacting with or caused by the atmosphere, such as carbonylic species on the noble metal surface, carbonates, hydroxyls or M–O overtones on SnO2, which are considered to be fundamental for understanding the gas reception mechanism.9,22,26–28 The potential of these methods was demonstrated when examining SnO2:Pt which was doped before the final calcination steps.20 The structural evaluation by XAS showed that Pt replaces Sn4+ ions in the SnO2 lattice and that it is atomically distributed on the surface and in the bulk of the whole material.29 As observed by DRIFTS the atomically distributed Pt4+ sites change the chemistry of hydrogen containing gases (H2, H2O) and hence improve the CO sensing performance of this material.13 Furthermore, it was shown that Pt4+ in the bulk of the material has a strong influence on the electrical properties of the SnO2 and consequently the improved gas sensing properties were traced back to changes in the chemistry and the electronic properties of the material.30 This raises the question which effect Pt exhibits on SnO2 if it is only present on the surface of the material.2. Experimental
2.1. Sample preparation
Undoped tin dioxide was synthesized by an aqueous sol–gel route starting with SnCl4 (Merck, purified by distillation). The precipitated solid was separated, washed several times, dried (120 °C), calcined at 1000 °C for 8 h under air and milled afterwards. The Pt loadings were introduced either before the calcination step (gel-impregnation, GI) or after the calcination step (powder-impregnation, PI) as an aqueous solution of H2PtCl6 (PtCl4, Aldrich, ≥99.99% trace metal basis) added to the SnO2 suspension and stirred for 48 h at room temperature. The PI material was additionally thermally treated after the impregnation (450 °C, 1 h). The prepared doped materials aimed at a nominal Pt loading of 0.2% wt. Gas sensors were made by screen printing a paste, made from undoped or Pt-doped SnO2 powders and an organic binder (propandiol), on alumina substrates equipped with interdigitated electrodes and a backside heating meander.31 Pt-Electrodes and Pt-heaters were used for gas sensor characterization by DC-resistance measurements and IR spectroscopy. For the X-ray spectroscopic analysis of the Pt-doped sample alumina substrates with Au-electrodes and an Ag/Pd-alloy-heater were used to avoid interference of Pt signals (absorption/fluorescence) from the substrates during XAS measurements.2.2. General experimental setup
For all experiments similar basic setups were used, allowing to control the atmospheric composition, the temperature of the sensor and the readout of the sensor response.22 Gases were mixed using home-made gas mixing stations based on mass flow controllers (Bronkhorst EL-Flow select). Test gases mixtures (H2 in synthetic air or He) were added to a carrier gas stream (synthetic air or He). Humidity levels were dosed by using evaporators filled with deionized water. The sensors were heated by applying voltage and current to the backside heaters using a DC-powder supply (Agilent E 3630A) and adjusting the exact values according to the sensor's temperature calibration. All experiments were conducted at 300 °C if not specified differently. To characterize the sensor responses as such and during all operando spectroscopic experiments the resistance was measured using a digital multimeter (Keithley 2000). All experiments were performed by measuring one sensor at a time to avoid downstream effects, which are expected for Pt-doped SnO2 gas sensors.152.3. Operando X-ray absorption spectroscopy
In situ and operando high-energy-resolution fluorescence detected (HERFD) X-ray absorption spectroscopy measurements were performed at beamline ID26 at the European Synchrotron Radiation Facility (ESRF, Grenoble, France). At this experimental station the beam was provided by a set of mechanically independent undulators. The incident energy was selected by a Si (111) double crystal monochromator. The beam size on the sample had an area 0.2 × 0.5 mm2 (vertical × horizontal) and the energy calibration was performed using a Pt foil. The spectra were recorded in high-energy-resolution fluorescence detection by means of an X-ray emission spectrometer. The sample, analyzer crystals and avalanche photodiode were displaced in a vertical Rowland geometry. The Pt L3-edge HERFD spectra were measured recording the intensity of the Pt Lα1 emission line (9442 eV) as a function of the incident energy. The emission energy was selected using the 〈660〉 reflection of four spherically bent Ge crystal analyzers. The broadening of the elastic peak was 1.8 eV. The sensors were mounted in a special home-made cell which allowed recording both HERFD spectra and electrical resistance as function of the atmosphere composition and temperature.24 XAS data analysis was carried out using Athena and Arthemis software of the IFEFFIT package.32 The spectra were energy calibrated, background subtracted and then normalized. The structural parameters were obtained by adjusting theoretical structural models, ab initio calculated phase and amplitude functions using the FEFF 6.0 code,33 to the experimental data. The EXAFS spectra in k space were Fourier transformed between 3.0 and 11.5 Å−1 and the data fitting was performed in R space between 1.0 and 2.2 Å for the first coordination shell, and between 1 and 4 Å when further shells were considered. The number of fitted parameters was always lower than the number of independent ones.The ratio between the oxidized and reduced Pt species were estimated by linear combination fitting (LCF) of operando XANES spectra using Athena IFEFFIT.32 The linear combination fitting was performed in the spectral range of −20 and 70 eV referred to the absorption edge. This procedure allowed tracking the proportion of oxidized and reduced Pt species. Since the references for the linear combinations were the first spectrum of the series and a spectrum of a Pt foil (both recorded at room temperature) the calculated ratios are relative values.
2.4. Operando DRIFT spectroscopy
Operando FT-IR spectroscopy was done on a Bruker Vertex70v spectrometer equipped with an external high performance globar, a KBr beamsplitter and a mid-band MCT detector. All samples were measured in diffuse reflectance geometry using a mirror optic (Praying Mantis, Harrick) with a home-made operando cell placed inside, which allows simultaneous resistance and spectroscopic measurements.9 Single channel spectra were recorded averaging 512 scans with a spectral resolution of 1 cm−1. The as obtained single channel spectra were processed with Bruker's OPUS software (version 7.2). Absorbance spectra were calculated as apparent absorbance using a single channel spectrum of the sensor before test gas exposure as reference.9,283. Results
3.1. Gas sensing performance
Fig. 1 shows the sensor signals to CO of undoped and Pt-doped materials in dry and humid air. Considering first the sensor performance in dry air (empty symbols) the undoped material shows the highest sensor signals to CO, followed by Pt:SnO2 GI, while Pt:SnO2 PI shows the lowest sensor signals. However, in the presence of water vapour (filled symbols) the situation changes: the undoped material shows a substantial decrease of the sensor signals compared to dry air, while the sensor signals of Pt:SnO2 PI are strongly increased. The Pt:SnO2 GI sensor shows only a minor increase, compared to the one observed for Pt:SnO2 PI. In order to understand these findings, the differences in the structure of the platinum dopant and the resulting changes of the materials chemistry have to be studied.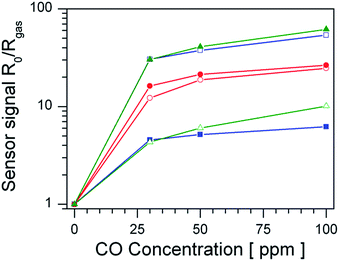 | ||
| Fig. 1 Sensor signals of undoped SnO2 (blue squares), Pt:SnO2 GI (red circles) and Pt:SnO2 PI (green triangles) in dry (empty symbols) and humid (50% r.h. at 25 °C, filled symbols) air. | ||
3.2. Structural investigations
As basis for understanding the effect of Pt surface doping the structure, oxidation state and dispersion of Pt need to be unravelled. For GI materials a detailed XAS investigation has reported by M. Hübner et al.,25 showing that Pt replaces Sn4+ ions in the SnO2 lattice and that it is distributed in the whole material.25 Similar results were recently reported by N. Murata et al.,16 finding a up to 10% at of Pt incorporated in SnO2. Hence, the following section focuses on the PI material. Fig. 2 presents the Fourier-transform of ex situ recorded EXAFS spectra of PtO2 (bulk) reference and Pt:SnO2 PI. The peaks shown in Fig. 2 are related to the backscattering of the nearest neighbours and thus the atomic radial distribution function (not phase-shifted) around the Pt absorber atoms. The visual inspection already reveals that the first coordination shell around the Pt atoms of PtO2 and Pt:SnO2 PI is the same, while the outer backscattering contributions (2nd and 3rd peak) are dissimilar. This indicates that the Pt dopant in SnO2 forms a PtO2-like phase which has not completely the same structure like the bulk oxide (PtO2). Quantitative structural information was obtained by fitting theoretical calculated spectra to the experimental ones; the structural parameters are presented in Table 1 and the refined spectra of the experimental data and the reference materials are shown in Fig. 3 and ESI 1 to 2,† respectively. The first hypothetical structural model considered that the chemical environment of Pt atoms in Pt:SnO2 PI is similar to one found in PtO2, this approach was satisfactory to describe the first coordination shell; however it failed to fit to the outer shells. The Pt atoms in SnO2:Pt presented 6.0 oxygen atoms at 2.02 Å, it means that coordination number and distance fits to the values observed for PtO2 bulk reference. Interestingly, the mean-square deviation of interatomic distances (σ2) is considerably higher for the sensing material than for the reference bulk oxide. This parameter accounts for the structural disorder, at low temperatures it expresses that static disorder of the pair distribution function and at high temperatures it reveals the thermal disorder summed to the static one. As long as all ex situ measurements were carried out at room temperature, the high σ2 suggest that Pt atoms in the sensor powder are in disordered environment that could result from the low particle size. To describe the outer shells FEFF 6.0 generated paths from PtO2 and SnO2 models were used. A constraint was applied to the second coordination forcing the number of neighbours to be ≤6 like it was found for PtO2. The analysis shows that Sn atoms are required to fit the model to the experimental spectra. Pt:SnO2 PI presents Pt neighbours at 3.14 ± 0.05 Å and Sn atoms at 3.63 ± 0.03 Å. This differs from the previous study were Pt was introduced before the calcination step: in this study the 2nd coordination shell contained only Sn atoms; this was interpreted as an atomic distribution of Pt, replacing Sn atoms in the SnO2 lattice.25 The EXAFS analysis of Pt:SnO2 PI has to be interpreted as the formation of a nano-sized PtO2 phase on the surface or inside of the SnO2 material.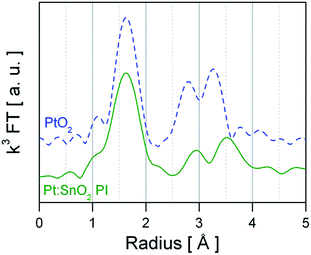 | ||
| Fig. 2 k 3 weighted Fourier transform of ex situ recorded EXAFS spectra from reference PtO2 (blue dashed line) and SnO2:Pt (green straight line). | ||
| Atom | N | R [Å] | σ 2 [10−3 Å2] | ρ [%] | |
|---|---|---|---|---|---|
| a PtO2: ΔE0 = 12.9 ± 1.0 eV, SnO2:Pt: ΔE0 = 12.7 ± 1.7 eV SnO2: ΔE0 = 5.4 ± 0.5 eV; Sn K So2 = 1.07, Pt L3So2 = 0.83; a = adjusted; f = fixed; c = constrained. | |||||
| SnO2:Pt PI | O | 6.0f | 2.02 ± 0.01a | 3.1 ± 0.1a | 4.7 |
| Pt | 2.4 ± 1.4c | 3.14 ± 0.05a | 4.8 ± 3.0a | ||
| Sn | 3.6 ± 1.4c | 3.63 ± 0.03a | 4.8 ± 3.0a | ||
| PtO2 | O | 6.0f | 2.02 ± 0.01a | 2.7 ± 0.9a | 4.5 |
| Pt | 6.0f | 3.10 ± 0.01a | 2.7 ± 0.5a | ||
| SnO2 | O | 6.0f | 2.06 ± 0.02a | 3.1 ± 0.4a | 1.0 |
| Sn | 2.0f | 3.21 ± 0.02a | 5.2 ± 0.2a | ||
| O | 4.0f | 3.60 ± 0.02a | 4.1 ± 3.0a | ||
| Sn | 8.0f | 3.73 ± 0.02a | 4.0 ± 0.2a | ||
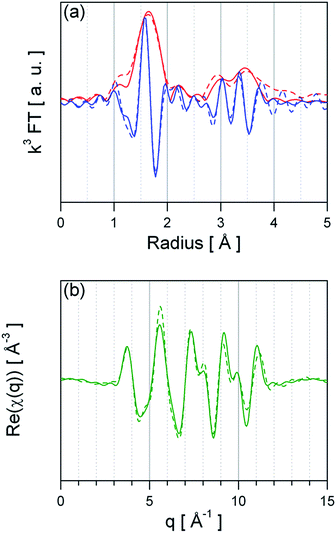 | ||
| Fig. 3 Real part (a) and imaginary part (b) of the refined EXAFS fits of Pt:SnO2 PI. The dashed line represents the experimental data and the solid line the fit function. | ||
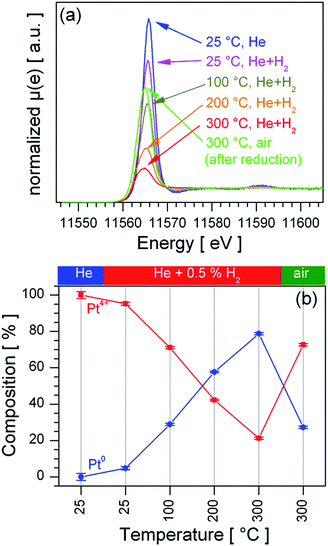
To determine the distribution of the Pt dopant temperature programmed reduction (TPR) was performed on a stepwise heated sensor in a 0.5% vol. H2/He atmosphere, the recorded XANES spectra (Fig. 4a) were quantitatively analysed by LCF analysis, as shown in Fig. 4b. The Pt:SnO2 PI material is already reduced at room temperature in 0.5% vol. H2/He; the stepwise increase of the sensor's temperature leads to a further reduction of the Pt, which ends in the formation of a mainly metallic Pt at 300 °C. Switching from the reducing atmosphere to synthetic air causes a re-oxidation of the Pt at 300 °C. Since the re-oxidation is a slow process it did not reach the initial Pt composition in the time allotted to the re-oxidation experiment (90 minutes). In contrast Pt:SnO2 GI is only partially reduced under much harsher conditions (2% vol. H2/He at 600 °C, see ESI 3†). The clear difference in the reducibility of Pt for the two samples points out that for Pt:SnO2 PI the Pt is accessible to gases, i.e. only present at the surface and not incorporated in the SnO2 lattice. The Pt oxidation state strongly depends on the composition of the atmosphere, i.e. the Pt actively interacts with reducing and oxidizing gases.
The structural evaluation presented above revealed that powder-impregnation leads to the formation of a nano-sized PtO2 phase mostly present at the surface of SnO2 (Fig. 5a), which strongly differs from the structure Hübner et al.25 proposed for gel-impregnated materials, for which Pt is atomically dispersed in the SnO2 bulk and surface (Fig. 5b). A similar occurrence of atomically distributed Pd or a separate oxide phase is observed when comparing Pd-doped SnO2 materials made by gel-impregnation or flame spray pyrolysis (dopant introduced before/during the grain formation) with powder-impregnated materials (dopant introduced after the grain formation).4,24
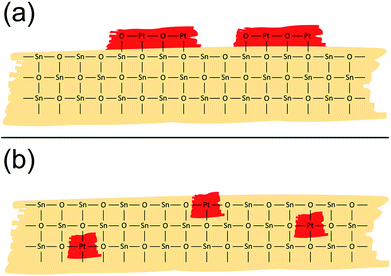 | ||
| Fig. 5 Schematic representation of the Pt structure as proposed by EXAFS and XANES analysis for Pt:SnO2 PI (a) and Pt:SnO2 GI (b). | ||
3.3. Operando XAS
The fundamental models for the enhanced gas sensing performance of noble metal loaded SnO2 are closely linked to the oxidation state of the noble metal: for metallic clusters a chemical sensitization by a spill-over mechanism is expected, while for partial oxidized clusters – being reduced during test gas exposure – an electronic sensitization by the alignment of the Fermi-levels is a commonly accepted model.17,18 Hence, the oxidation state of Pt under operation conditions is of fundamental interest to understand the role of Pt for gas sensing. Since the TPR experiments showed that PtO2 phase is easily reduced and re-oxidized at 300 °C the question raises which oxidation state of Pt is dominant under operation conditions in the absence and presence of H2. Fig. 6 shows XANES recorded from heated sensors in dry air and dry air containing 50 ppm H2. For both materials the presence of H2 leads to a slight decrease of the white line (first absorption feature above the Pt L3 edge), which indicates a weak reduction of the Pt, but for none of the materials a shift or strong decrease of the white line, which indicates the formation of metallic Pt, is observed. In the case of Pt:SnO2 PI the lack of a considerable reduction can be explained with the high excess of O2 – 20.5% O2 in comparison with 50 ppm H2 – which favours the re-oxidation and prevents the formation of a metallic Pt phase under operating conditions. As Pt:SnO2 GI is not reducible even at higher H2 concentrations and in the absence of oxygen, it is expected that it is not reduced by very low H2 concentration in air. The XAS spectra shown in Fig. 6 do not show any differences between Pt:SnO2 PI and GI, i.e. for both materials oxidized Pt dominates under operating conditions.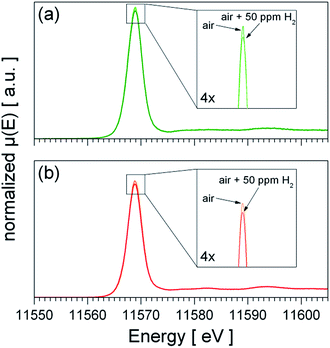 | ||
| Fig. 6 Operando XANES spectra of Pt:SnO2 PI (a) and Pt:SnO2 GI (b) recorded at 300 °C in dry air and dry air plus 50 ppm H2. The spectra shown in (b) is based on the raw data measured by M. Hübner et al.25 and was treated similar to the data shown in (a). | ||
3.4. Operando DRIFTS
Pt-based catalysts are widely used for the catalytic oxidation of CO.34,35 Oxidized36–40 as well as reduced35,41–44 Pt species are reported to be catalytically active, whereupon the latter one is found to be more reactive.41,42 Thus it is reasonable to assume that Pt, in either form, chemically sensitizes the SnO2 material and that such a chemical sensitization should result in a changed surface chemistry, as it was demonstrated for Pt:SnO2 GI.13Fig. 7 shows DRIFT spectra of both Pt-doped materials recorded during CO exposure in dry and humid air. In agreement with previous works undoped SnO2 shows no carbonyl species under operation conditions (spectra not shown).45 During CO exposure both Pt-doped samples (Fig. 7a and b) show the formation of different carbonyl species; due to the absence of carbonyls on undoped SnO2, these carbonyls are identified as platinum carbonyl species (Pt–CO). On both materials only carbonyl species assigned to oxidized platinum are observed, while no carbonyl bands on metallic Pt can be assigned.46 This supports the findings by operando XAS, which did not show the formation of metallic Pt under operation conditions. A closer look reveals, that Pt:SnO2 PI shows two carbonyl species at 2148 and 2131 or 2135 cm−1 (Fig. 7a), while Pt:SnO2 GI shows only one carbonyl species at 2124 cm−1 (Fig. 7b). Again this is in line with the structure proposed for both materials: in case of Pt:SnO2 PI the presence of PtO2 clusters offers a higher heterogeneity of Pt-sites – e.g. edges and planar surface regions – available for CO adsorption; which is in line with the appearance of several different carbonyl species. In case of Pt:SnO2 GI the atomically distributed Pt should be found in a homogeneous surrounding, which is in line with the appearance of a single carbonyl species.
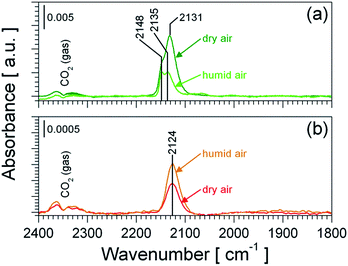 | ||
| Fig. 7 Operando DRIFT spectra of Pt:SnO2 PI (a) and Pt:SnO2 GI (b) recorded during the exposure of 100 ppm CO in dry air (reference: dry air) and humid air (reference: humid air) at 300 °C. The spectra shown in (b) are based on the experimental data previously published by K. Großmann et al.13 | ||
Since the carbonyls on Pt:SnO2 PI appear at higher wavenumbers than the carbonyl species on Pt:SnO2 GI (see Fig. 7) an incorporation of Pt into the SnO2, as it is observed for Pt:SnO2 GI, can be ruled out; again this is in line with XAS results. Consequently, the occurrence of carbonyl species on the Pt-doped samples point out that the sensitization caused by Pt-doping is related to changed chemistry, which is linked closely to the structure of the Pt doping. Regarding the effect of humidity on the carbonyl species the following was observed. On Pt:SnO2 PI the presence of water vapour strongly decreased the intensity of the Pt–CO bands, indicating a lower CO adsorption on the PtO2 phase, which results in a lower level of CO oxidation on the PtO2 phase. On the opposite, for the Pt:SnO2 GI the intensity of the Pt–CO band is increased by the humidity, indicating a higher CO adsorption and hence an increased CO oxidation activity of the atomic Pt sites (in humid conditions). These findings suggest that the differences in the sensor performance (Fig. 1) are most likely related to the different chemical activity of the Pt sites.
4. Discussion
The Pt-structures, revealed by XAS, create new reaction sites in addition to the Sn–O–Sn sites present on undoped (pristine) SnO2:For Pt:SnO2 GI the atomically distributed Pt offers new reactive surface sites (Pt–O–Sn), which separate the oxidation of CO from interfering compounds like water vapor.13 While the pristine SnO2 surface is deactivated by water vapour,45 the Pt–O–Sn sites on Pt:SnO2 remain active maintaining the sensing activity (Fig. 1). The increase of the carbonyl species in humid air can be explained by a decreased level of CO oxidation onto the (pristine) SnO2 surface, which causes a shift for the surface reaction to the atomic Pt sites. This compensation of the decreased activity of SnO2 surface explains the independence of the CO sensor signal from the water vapour in the background (Fig. 1).
For Pt:SnO2 PI three different reactive sites are possible: the SnO2 surface (Sn–O–Sn), the PtO2 surface (Pt–O–Pt) or the boundary of the two oxides (Pt–O–Sn) and the gas phase, the so called 3-phase-boundary the latter one, the Pt–O–Sn site at the 3-phase-boundary, may differ from the Pt–O–Sn sites found for atomically distributed Pt.
Regarding the situation in dry air the operando DRIFT spectrum (Fig. 7a) suggests that the reaction is mainly taking place at the PtO2 surface (Pt–O–Pt sites), indicated by the appearance of carbonyl species (2148 and 2131 cm−1) and in line with the TPR XANES results, proving the feasible reduction and re-oxidation of the PtO2 phase. Assuming that there is no electron exchange between SnO2 and PtO2, any reaction at the Pt–O–Pt sites does not change the resistance of SnO2 and hence has no impact on the sensor signal. The CO oxidized on the PtO2 phase is not anymore available for a reaction on the SnO2 phase (Sn–O–Sn or Sn–O–Pt sites) and consequently the parallel reaction on the PtO2 phase will decrease the sensor signals for a certain concentration, as it is observed for Pt:SnO2 PI in dry air (Fig. 1). In humid air the situation changes: the carbonyl bands decrease strongly, i.e. the Pt–O–Pt sites deactivated, and the reaction is shifted to the SnO2 surface or the 3-phase-boundary. As the pristine SnO2 surface is deactivated in humid air, the oxidation of CO in humid air on Pt:SnO2 PI has to take place at the Pt–O–Sn sites, i.e. the 3-phase-boundary. A reaction at the 3-phase-bouandary, which keeps the surface active in the presence of water vapour while the PtO2 phase gets deactivated, gives an appropriate explanation for the high sensor performance of Pt:SnO2 PI in humid air (Fig. 1).
5. Conclusions
By the use of complementary operando spectroscopic techniques – XAS and DRIFTS – and the direct comparison with analogous data of a related material, structure and surface chemistry of surface doped Pt:SnO2 were revealed and provided the basis for better understanding of the CO gas sensing mechanism of Pt doped SnO2. In contrast to atomically distributed Pt (gel-impregnation) it was found that introduced after the calcination step (powder-impregnation) Pt forms a separate oxide phase, which offers additional reaction sites, which are not electronically coupled to the SnO2. Hence, the decreased sensor signals in dry air are caused by a parallel reaction on the PtO2 phase with no effect onto the electrical properties of SnO2. Nevertheless, the presence of PtO2 clusters at the surface of SnO2 prevents a complete deactivation of the SnO2 surface in humid air, resulting in a higher CO sensing performance in the presence of water vapour.This work demonstrated the fundamental role of structure and distribution of noble metals in oxide materials for the surface chemistry, which has a direct link to the materials functionality – in this case, gas sensing. Furthermore, it has been shown that the used of complementary experimental techniques and the comparison of rational designed materials is a powerful method to study the structure–function relationships of functional materials, such as gas sensors or catalysts.
Acknowledgements
We thank the ESRF (Grenoble) for beamtime allocation at beamline ID26 in the frame of proposal MA 1530 and the financial support.References
- A. Gurlo, N. Barsan and W. Udo, in Metal Oxides – Chemistry and Applications, ed. J. L. G. Fierro, CRC Press, 2006, pp. 683–738 Search PubMed.
- R. Jaaniso and O. Kiang Tan, Semiconductor Gas Sensors, Woodhead Publishing Limited, 2013 Search PubMed.
- A. Cabot, A. Diéguez, A. Romano-Rodriguez, J. R. Morante and N. Barsan, Sens. Actuators, B, 2001, 79, 98–106 CrossRef CAS.
- D. Degler, H. W. P. De Carvalho, U. Weimar, N. Barsan, D. Pham, L. Mädler and J.-D. Grunwaldt, Sens. Actuators, B, 2015, 219, 315–323 CrossRef CAS.
- A. Diéguez, A. Vilà, A. Cabot, A. Romano-Rodriguez, J. R. Morante, J. Kappler, N. Barsan, U. Weimar and W. Göpel, Sens. Actuators, B, 2000, 68, 94–99 CrossRef.
- M. Epifani, J. Arbiol, E. Pellicer, E. Comini, P. Siciliano, G. Faglia and J. R. Morante, Cryst. Growth Des., 2008, 8, 1774–1778 CAS.
- G. Ghiotti, A. Chiorino, G. Martinelli and C. Carotta, Sens. Actuators, B, 1995, 25, 520–524 CrossRef CAS.
- F. Gyger, A. Sackmann, M. Hübner, P. Bockstaller, D. Gerthsen, H. Lichtenberg, J.-D. Grunwaldt, N. Barsan, U. Weimar and C. Feldmann, Part. Part. Syst. Charact., 2014, 31, 591–596 CrossRef CAS.
- S. Harbeck, A. Szatvanyi, N. Barsan, U. Weimar and V. Hoffmann, Thin Solid Films, 2003, 436, 76–83 CrossRef CAS.
- R. G. Pavelko, H. Daly, M. Hu, C. Hardacre and E. Llobet, J. Phys. Chem. C, 2013, 117, 4158–4167 CAS.
- T. Wagner, M. Bauer, T. Sauerwald, C. Kohl and M. Tiemann, Thin Solid Films, 2011, 520, 909–912 CrossRef CAS.
- A. Marikutsa, M. Rumyantseva and A. Gaskov, J. Phys. Chem. C, 2015, 119, 24342–24350 CAS.
- K. Großmann, S. Wicker, U. Weimar and N. Barsan, Phys. Chem. Chem. Phys., 2013, 15, 19151–19158 RSC.
- I. Kocemba and J. Rynkowski, Sens. Actuators, B, 2011, 155, 659–666 CrossRef CAS.
- L. Mädler, T. Sahm, A. Gurlo, J.-D. Grunwaldt, N. Barsan, U. Weimar and S. Pratsinis, J. Nanopart. Res., 2006, 8, 783–796 CrossRef.
- N. Murata, T. Suzuki, M. Kobayashi, F. Togoh and K. Asakura, Phys. Chem. Chem. Phys., 2013, 15, 17938 RSC.
- N. Yamazoe, Sens. Actuators, B, 1991, 5, 7–19 CrossRef CAS.
- N. Yamazoe, Y. Kurokawa and T. Seiyama, Sens. Actuators, B, 1983, 4, 283–289 CrossRef CAS.
- J. Kappler, N. Barsan, U. Weimar, A. Dièguez, J. L. Alay, R. Rodriguez, J. R. Morante and W. Göpel, Fresenius. J. Anal. Chem., 1998, 361, 110–114 CrossRef CAS.
- A. Cabot, J. Arbiol, J. R. Morante, U. Weimar, N. Barsan and W. Gopel, Sens. Actuators, B, 2000, 70, 87–100 CrossRef CAS.
- A. Gurlo and R. Riedel, Angew. Chem., Int. Ed. Engl., 2007, 46, 3826–3848 CrossRef CAS PubMed.
- N. Barsan, D. Koziej and U. Weimar, Sens. Actuators, B, 2007, 121, 18–35 CrossRef CAS.
- M. Hübner, D. Koziej, J.-D. Grunwaldt, U. Weimar and N. Barsan, Phys. Chem. Chem. Phys., 2012, 14, 13249–13254 RSC.
- D. Koziej, M. Hübner, N. Barsan, U. Weimar, M. Sikora and J.-D. Grunwaldt, Phys. Chem. Chem. Phys., 2009, 11, 8620–8625 RSC.
- M. Hübner, D. Koziej, M. Bauer, N. Barsan, K. Kvashnina, M. D. Rossell, U. Weimar and J.-D. Grunwaldt, Angew. Chem., Int. Ed. Engl., 2011, 50, 2841–2844 CrossRef PubMed.
- D. Koziej, K. Thomas, N. Barsan, F. Thibault-Starzyk and U. Weimar, Catal. Today, 2007, 126, 211–218 CrossRef CAS.
- D. Koziej, N. Barsan, V. Hoffmann, J. Szuber and U. Weimar, Sens. Actuators, B, 2005, 108, 75–83 CrossRef CAS.
- K. Großmann, R. G. Pavelko, N. Barsan and U. Weimar, Sens. Actuators, B, 2012, 166–167, 787–793 CrossRef.
- M. Hübner, D. Koziej, M. Bauer, N. Barsan, K. Kvashnina, M. D. Rossell, U. Weimar and J.-D. Grunwaldt, Angew. Chem., 2011, 123, 2893–2896 CrossRef.
- M. Hübner, N. Barsan and U. Weimar, Sens. Actuators, B, 2012, 171–172, 172–180 CrossRef.
- N. Barsan and U. Weimar, J. Phys.: Condens. Matter, 2003, 15, R813–R839 CrossRef CAS.
- B. Ravel and M. Newville, J. Synchrotron Radiat., 2005, 12, 537–541 CrossRef CAS PubMed.
- J. J. Rehr and R. C. Albers, Rev. Mod. Phys., 2000, 72, 621–654 CrossRef CAS.
- A. Russell and W. S. Epling, Catal. Rev.: Sci. Eng., 2011, 53, 337–432 CAS.
- G. Ertl, Angew. Chem., Int. Ed., 2008, 47, 3524–3535 CrossRef CAS PubMed.
- M. D. Ackermann, T. M. Pedersen, B. L. M. Hendriksen, O. Robach, S. C. Bobaru, I. Popa, C. Quiros, H. Kim, B. Hammer, S. Ferrer and J. W. M. Frenken, Phys. Rev. Lett., 2005, 95, 255505 CrossRef CAS PubMed.
- E. M. C. Alayon, J. Singh, M. Nachtegaal, M. Harfouche and J. A. van Bokhoven, J. Phys.: Conf. Ser., 2009, 190, 012152 CrossRef.
- B. L. M. Hendriksen and J. W. M. Frenken, Phys. Rev. Lett., 2002, 89, 046101 CrossRef CAS PubMed.
- J. Singh, M. Nachtegaal, E. M. C. Alayon, J. Stötzel and J. A. Van Bokhoven, ChemCatChem, 2010, 2, 653–657 CrossRef CAS.
- E. M. C. Alayon, J. Singh, M. Nachtegaal, M. Harfouche and J. A. van Bokhoven, J. Catal., 2009, 263, 228–238 CrossRef CAS.
- A. Boubnov, A. Gänzler, S. Conrad, M. Casapu and J.-D. Grunwaldt, Top. Catal., 2013, 56, 333–338 CrossRef CAS.
- A. M. Gänzler, M. Casapu, A. Boubnov, O. Müller, S. Conrad, H. Lichtenberg, R. Frahm and J.-D. Grunwaldt, J. Catal., 2015, 328, 216–224 CrossRef.
- J. Wintterlin, S. Väkening, T. V. W. Janssens, T. Zambelli and G. Ertl, Science, 1997, 278, 1931–1934 CrossRef CAS PubMed.
- F. J. Gracia, L. Bollmann, E. E. Wolf, J. T. Miller and A. J. Kropf, J. Catal., 2003, 220, 382–391 CrossRef CAS.
- D. Degler, S. Wicker, U. Weimar and N. Barsan, J. Phys. Chem. C, 2015, 119, 11792–11799 CAS.
- E. Ivanova, M. Mihaylov, F. Thibault-Starzyk, M. Daturi and K. Hadjiivanov, J. Mol. Catal. A: Chem., 2007, 274, 179–184 CrossRef CAS.
Footnote |
| † Electronic supplementary information (ESI) available: (i) Refined fitted EXAFS spectra of PtO2 (reference) and SnO2 (reference). See DOI: 10.1039/c5ra26302f |
| This journal is © The Royal Society of Chemistry 2016 |

