 Open Access Article
Analysis of the wetting state of super-repellent fabrics with liquids of varying surface tension
Sohyun
Park
a,
Jooyoun
Kim
b and
Chung Hee
Park
*a
aDepartment of Textiles, Merchandising, and Fashion Design, Seoul National University, Seoul, Korea. E-mail: junghee@snu.ac.kr
bDepartment of Apparel, Textiles, and Interior Design, Kansas State University, Manhattan, KS, USA
First published on 11th May 2016
Abstract
In designing a super-repellent surface that is not wet to liquids with a lower surface tension than water, micro and nano-scale surface roughness have a great impact in addition to low surface energy. In this study, a super-repellent fabric was fabricated using oxygen plasma etching and plasma enhanced chemical vapor deposition (PECVD) with hexamethyldisiloxane (HMDSO). The influence of dual roughness on wettability in micro and nano-scale structures was analyzed using the contact angles of test reagents whose surface tension ranges from 33–72 dyn cm−1. The treated fabrics produced dual scale roughness, and exhibited contact angles greater than 160° against the test liquid whose surface tension was greater than 42 dyn cm−1. The Cassie–Cassie theoretical model, which is based on the non-wetting assumption of either micro-scale or nano-scale roughness, explained well the actual water contact angles on the treated fabrics. For the liquid with 42 dyn cm−1 surface tension, the wetting behavior followed behavior between the Cassie–Wenzel state and Cassie–Cassie state depending on the aspect ratio of the nano-scale roughness. With an increased etching time of 7 min or longer, the actual contact angles were measured to be larger than those predicted using the Cassie–Cassie model, which may be a result of the formation of partial re-entrant structures at the tips of the nano-pillars. Self-cleaning effects were demonstrated for solid particles adhered on the treated fabrics such as silicon carbide and Sudan Black B. Water was more effective in adhering to both particle types and rolling off the surface than isopropyl alcohol solution.
Introduction
Similar to the concept of the superhydrophobic surface,1–3 the superomniphobic surface can be defined as one that gives a contact angle (CA) of greater than 150° against most liquids with lower surface tensions than water.4 In achieving superomniphobicity, the geometric shape of micro- and nano-pillars on the surface, in addition to a low surface free energy, is known to have great impact. Given that there are limitations in lowering the surface energy of a solid, the geometric surface structure has a more decisive impact on the repellency of low surface tension liquids.Some studies, including that of Tuteja et al.4, theoretically explained how to obtain inherently repellent surfaces by forming the ‘re-entrant’ structures at the surface.4–8 According to Tuteja et al.,4 when the re-entrant geometric angle (ψ) of a surface feature is smaller than the Young’s contact angle, θe,9 the CA of a liquid cannot advance forward; instead pocketed air is maintained, which leads to a Cassie–Baxter state. They stressed the importance of the geometric angle between the surface roughening structure and the substrate surface for the control of the wettability in an effective way.4–8 However, there has been not enough data on the geometric parameters of the roughening structures such as the height, width, and thickness of the re-entrant structures. More studies need to be conducted on the parameters of surface structures to implement superomniphobicity.
Self-cleaning effects on superhydrophobic surfaces are shown when a weakly adhered soil on the surface gets easily removed by a water droplet to be rolled off together.10–12 In a Cassie–Baxter state in which the adhesion between a solid surface and water droplet is reduced by the air pockets present between nano-pillars or hairs, water droplets are easily rolled off the surface. In a Wenzel state where the contact area between a solid surface and water droplets is large, great energy is required to cause water droplets to be separated from the solid interface, thus making the droplets stay on a fabric surface.12,13
A previous study13 that examined the influence of a varying intensity of artificial precipitation on self-cleaning effects revealed that water droplets with a relatively smaller size and a lower level of kinetic energy such as fog and mist showed a remarkably lower level of self-cleaning effects than regular rainfall. In other words, if a water droplet with enough kinetic energy causes elastic deformation at the surface, the water droplet can easily adhere to dust particles. Such self-cleaning effects can be realized when soil particles show stronger adhesion to water droplets than to the solid surface. However, the study by Li, et al. on self-cleaning effects argues that if the soil particles are chemically hydrophobic, their adhesion to water droplets will be low, reducing the self-cleaning effect.12
In recent years, a variety of methods for developing self-cleaning textiles were reported based on superhydrophobic surfaces.14–21,23 However, simple evaluation criteria such as contact angle measurements were used to measure the superhydrophobic properties without considering self-cleaning applications. If an effective method of evaluating repellency towards liquids with varied properties is developed using different types of liquids to go beyond water contact angle measurements, it can contribute to adequately evaluating fabric repellency criteria and self-cleaning performance.
This study intends to analyze the respective effect of micro- and nano-scale roughness on the wetting properties of liquids with a wide range of surface tensions and to evaluate the self-cleaning performance for solid particles. Major design factors for a super-repellent textile surface were analyzed for textile substrates with varying levels of surface roughness.
To this end, a super-repellent textile surface was prepared on a polyethylene terephthalate (PET) woven fabric, where the micro-scale roughness was controlled through the number of filaments per yarn, such as 36, 72, and 144 filaments per yarn. On a fabric with innate micro-scale roughness, nano-scale roughness was additionally incorporated using plasma etching over different time periods.
A mixture of isopropyl alcohol and deionized water was prepared as a test solution whose surface tension ranges between 33–72 dyn cm−1. The contact angle of the test solution was measured to investigate the level of repellency of fabrics having different surface roughness. Also, the self-cleaning performance of the treated fabrics was examined for solid particles. The influence of the chemical properties of solid particles on the self-cleaning effects was discussed.
Experimental
Materials
100% polyethylene terephthalate (PET) film and a plain weave fabric comprising 75 denier yarn were used (Table 1). The number of filaments comprising the yarn was diversified into 36, 72 and 144 in order to create micro-roughness on different scales at the fabric substrate and to assess the influence of micro-scale roughness on the hydrophobicity. Fabrics were prepared in the same density with untwisted yarns.Fabric specimens underwent a de-sizing and scouring process. De-sizing and scouring solution was prepared with 5 g L−1 sodium dodecyl benzene sulfonate (60%) and 5 g L−1 anhydrous sodium carbonate in a liquor ratio of 30![[thin space (1/6-em)]](https://www.rsc.org/images/entities/char_2009.gif) :
:![[thin space (1/6-em)]](https://www.rsc.org/images/entities/char_2009.gif) 1. The fabrics were immersed in the solution for 1 hour at 90 °C, then were rinsed 5 times, and naturally dried.
1. The fabrics were immersed in the solution for 1 hour at 90 °C, then were rinsed 5 times, and naturally dried.
For plasma treatment, oxygen gas (99.99% in purity) and hexamethyldisiloxane gas (Sigma-Aldrich, USA) were used.
Plasma treatment
For plasma treatment, a custom-made radio frequency glow discharge plasma system was used. The plasma process consisted of (1) plasma etching using oxygen gas to create nano-scale roughness, and (2) plasma enhanced chemical vapor deposition (PECVD) with hexamethyldisiloxane (HMDSO) compounds. For plasma etching, specimens (2 cm × 8 cm) were attached on a stainless cathode plate inside the chamber. The chamber pressure was set at 1 mTorr, then oxygen gas was injected at 4 cm3 min−1. The chamber was stabilized until the chamber pressure reached 30–70 mTorr. A bias voltage of 400 V was applied to the cathode to ionize the oxygen gas that etched the specimen. Etching time was varied between 0, 1, 2, 3, 5, 7, 10, and 15 min respectively, to introduce nano-pillars in various aspect ratios.PECVD was carried out subsequently to oxygen plasma etching to lower the surface energy of the fabric. HMDSO gas was injected at 10 cm3 min−1, and the chamber pressure was set at 20 mTorr. A bias voltage of −400 V was applied to the cathode, then the ionized HMDSO gas was deposited onto the surface for 30 s.
Three kinds of specimens were prepared: HMDSO-deposited fabric specimens having innate micro-scale roughness, plasma-etched film specimens having nano-scale roughness only followed by HMDSO deposition, and fabric specimens having both micro- and nano-scale roughness with HMDSO deposition. The sample codes for the different processes are summarized in Table 2.
| Sample & treatment code | Description | |
|---|---|---|
| Sample | Film | PET film |
| 36f | 75D/36f PET fabric | |
| 72f | 75D/72f PET fabric | |
| 144f | 75D/144f PET fabric | |
| Treatment code | U | Untreated |
| H | 30 s of HMDSO–PECVD | |
| E1, E2, E3, E5, E7, E10, E15 | Etched using oxygen plasma for 1 min, 2 min, 3 min, 5 min, 7 min, 10 min, and 15 min, respectively, with subsequent HMDSO–PECVD for 30 s | |
Surface characterization
In analyzing the surface roughness of the specimens, the study distinguished micro-scale roughness resulting from the waviness of filament fibers and yarns, and nano-scale roughness resulting from the nano-pillars formed by plasma etching. To calculate the solid fraction of micro-scale and nano-scale roughness respectively, the Cassie–Cassie model suggested by Rahmawan et al.20 was applied.Wettability
The static contact angle and shedding angle were measured at room temperature using a Theta Lite Optical Tensiometer (KSV Instruments, Finland). To measure the static contact angle of the specimen, a 3.3 ± 0.3 μL water droplet was dropped vertically from a 1 cm height onto the specimen, and the contact angle was measured after 1 s. Ten measurements were made for the static contact angle from different locations on a specimen, and the average value was used for the analysis.To evaluate the level of anti-wettability or repellency, the contact angle of liquids with different surface tensions was measured, using a test reagent formulated using AATCC test method 193.24 AATCC test method 193 indicates that varying grades of repellency can be tested using a test reagent whose surface tension is controlled by the mixing ratio of water to isopropyl alcohol. The compositions of the test reagent and the surface tensions are seen in Table 3.
Volume ratio of composition (water![[thin space (1/6-em)]](https://www.rsc.org/images/entities/char_2009.gif) : :![[thin space (1/6-em)]](https://www.rsc.org/images/entities/char_2009.gif) isopropyl alcohol) isopropyl alcohol) |
Surface tension (dyn cm−1) |
|---|---|
100![[thin space (1/6-em)]](https://www.rsc.org/images/entities/char_2009.gif) : :![[thin space (1/6-em)]](https://www.rsc.org/images/entities/char_2009.gif) 0 0 |
72.0 |
98![[thin space (1/6-em)]](https://www.rsc.org/images/entities/char_2009.gif) : :![[thin space (1/6-em)]](https://www.rsc.org/images/entities/char_2009.gif) 2 2 |
59.0 |
95![[thin space (1/6-em)]](https://www.rsc.org/images/entities/char_2009.gif) : :![[thin space (1/6-em)]](https://www.rsc.org/images/entities/char_2009.gif) 5 5 |
50.0 |
90![[thin space (1/6-em)]](https://www.rsc.org/images/entities/char_2009.gif) : :![[thin space (1/6-em)]](https://www.rsc.org/images/entities/char_2009.gif) 10 10 |
42.0 |
80![[thin space (1/6-em)]](https://www.rsc.org/images/entities/char_2009.gif) : :![[thin space (1/6-em)]](https://www.rsc.org/images/entities/char_2009.gif) 20 20 |
33.0 |
70![[thin space (1/6-em)]](https://www.rsc.org/images/entities/char_2009.gif) : :![[thin space (1/6-em)]](https://www.rsc.org/images/entities/char_2009.gif) 30 30 |
27.5 |
60![[thin space (1/6-em)]](https://www.rsc.org/images/entities/char_2009.gif) : :![[thin space (1/6-em)]](https://www.rsc.org/images/entities/char_2009.gif) 40 40 |
25.4 |
50![[thin space (1/6-em)]](https://www.rsc.org/images/entities/char_2009.gif) : :![[thin space (1/6-em)]](https://www.rsc.org/images/entities/char_2009.gif) 50 50 |
24.5 |
40![[thin space (1/6-em)]](https://www.rsc.org/images/entities/char_2009.gif) : :![[thin space (1/6-em)]](https://www.rsc.org/images/entities/char_2009.gif) 60 60 |
24.0 |
Self-cleaning effect
The self-cleaning performance was evaluated by simulating a phenomenon in which liquid droplets pick up solid particles when rolling off the surface. To identify the influence of the solid particle properties on the self-cleaning effect, two different types of solid particles were used, which included silicon carbide and Sudan Black B. Both had particle sizes in the 5–20 μm range. The fabric E3_144f was used for the evaluation of the self-cleaning effect using water, while specimen E7_144f was used for the self-cleaning effect using 10% isopropyl alcohol (AATCC test reagent). On both fabrics, the water shedding angle was less than 1°.0.5–0.8 g of solid particles were sprinkled over a fabric specimen that was fixed on a cradle. Then liquid droplets were precipitated on the fabric surface, tilting the cradle at an angle of 1°, in order to examine whether the dust particles were rolled off together with the liquid drops. Similarly to the shedding angle measurement, a self-cleaning effect was determined if liquid droplets rolled more than 2 cm away, with adhering solid particles. The self-cleaning process of picking up solid particles and removing them through the rolling off of the liquid drops was video-recorded.
Results and discussion
Influence of dual-scale roughness on wettability for liquids of varying surface tension
A super-repellent surface, on which liquid drops can easily roll off, can be protected from being tainted with liquid contaminants, even those with a lower surface tension than water, thus this type of material would be of great use in our everyday lives.The wettability of a liquid can be influenced by such factors as surface tension, viscosity, temperature and polarity. In this study, a mixed solution of water and isopropyl alcohol was used as a test reagent to compare the wettability of fabrics with different dual micro/nano-scale roughness. All other liquid properties except for surface tension were not considered in this work. Thus, it should be noted that as the liquid soil that we are exposed in our everyday life has varying degrees of viscosity and polarity as well as surface tension, the wettability test in this study can provide only limited usefulness with regards to the varied surface tension of liquids.
Table 4 shows the contact angles of liquids with different surface tensions on fabrics treated using plasma-etching and HMDSO-deposition. The results show that the contact angle was reduced with a decrease in the surface tension of the liquid. Plasma etching of 7 min or longer was required to exhibit repellency against the tested liquid down to 42 dyn cm−1, in which the solution droplets roll off the surface at the moment they are precipitated onto the surface. In a reagent with an isopropyl alcohol ratio of 20% and a surface tension of 33 dyn cm−1, the contact angle in film H (a film with HMDSO coating) was measured at 56.3°, while the fabric showed complete wetting 1–5 s after precipitation. For the liquid with a surface tension of 33 dyn cm−1, the fabric surface roughness seemed to enhance the wetting. Fig. 1 presents a liquid droplet on some fabric specimens.
| Code | U | H | E1 | E2 | E3 | E5 | E7 | E10 | E15 |
|---|---|---|---|---|---|---|---|---|---|
| (a) Water: 72 dyn cm −1 (ref. 22) | |||||||||
| Film | 70° (±1) | 98° (±2) | 126° (±2) | 134° (±1) | 150° (±2) | 155° (±3) | ≒180° | ≒180° | ≒180° |
| 36f | 115° (±3) | 140° (±1) | 152° (±1) | 161° (±3) | ≒180° | ≒180° | ≒180° | ≒180° | ≒180° |
| 72f | 108° (±3) | 141° (±1) | 150° (±5) | 166° (±1) | ≒180° | ≒180° | ≒180° | ≒180° | ≒180° |
| 144f | 99° (±4) | 144° (±2) | 158° (±3) | 168° (±1) | ≒180° | ≒180° | ≒180° | ≒180° | ≒180° |
![[thin space (1/6-em)]](https://www.rsc.org/images/entities/char_2009.gif) |
|||||||||
| (b) 2% isopropyl alcohol: 59 dyn cm −1 | |||||||||
| Film | 67° (±3) | 92° (±0) | 115° (±4) | 122° (±2) | 138° (±2) | 154° (±3) | ≒180° | ≒180° | ≒180° |
| 36f | 112° (±3) | 131° (±2) | 143° (±1) | 160° (±3) | 171° (±2) | ≒180° | ≒180° | ≒180° | ≒180° |
| 72f | 92° (±3) | 132° (±1) | 143° (±3) | 163° (±1) | 171° (±1) | ≒180° | ≒180° | ≒180° | ≒180° |
| 144f | 87° (±4) | 137° (±2) | 156° (±2) | 168° (±1) | 174° (±1) | ≒180° | ≒180° | ≒180° | ≒180° |
![[thin space (1/6-em)]](https://www.rsc.org/images/entities/char_2009.gif) |
|||||||||
| (c) 5% isopropyl alcohol: 50 dyn cm −1 | |||||||||
| Film | 62° (±3) | 81° (±3) | 111° (±3) | 116° (±1) | 126° (±1) | 146° (±4) | 171° (±1) | ≒180° | ≒180° |
| 36f | 111° (±1) | 126° (±2) | 138° (±2.8) | 148° (±4) | 169° (±2) | 171° (±2) | ≒180° | ≒180° | ≒180° |
| 72f | 78° (±3) | 128° (±3) | 142° (±1) | 150° (±3) | 171° (±1) | 173° (±1) | ≒180° | ≒180° | ≒180° |
| 144f | 51° (±4) | 130° (±3) | 148° (±3) | 159° (±4) | 172° (±2) | ≒180° | ≒180° | ≒180° | ≒180° |
![[thin space (1/6-em)]](https://www.rsc.org/images/entities/char_2009.gif) |
|||||||||
| (d) 10% isopropyl alcohol: 42 dyn cm −1 | |||||||||
| Film | 46° (±3) | 74° (±1) | 95° (±2) | 114° (±3) | 128° (±5) | 138° (±1) | 165° (±4) | ≒180° | ≒180° |
| 36f | 91° (±5) | 121° (±2) | 125° (±4) | 142° (±2) | 160° (±3) | 168° (±2) | 173° (±3) | ≒180° | ≒180° |
| 72f | 57° (±5) | 122° (±1) | 128° (±2) | 142° (±1) | 161° (±3) | 163° (±4) | ≒180° | ≒180° | ≒180° |
| 144f | 35° (±3) | 124° (±2) | 132° (±1) | 146° (±3) | 163° (±2) | 165° (±2) | 173° (±3) | ≒180° | ≒180° |
![[thin space (1/6-em)]](https://www.rsc.org/images/entities/char_2009.gif) |
|||||||||
| (e) 20% isopropyl alcohol: 33 dyn cm −1 | |||||||||
| Film | 18° (±8) | 56° (±6) | |||||||
| 36f, 72f, 144f | Wetting | ||||||||
 | ||
| Fig. 1 A liquid droplet (surface tension: 42 dyn cm−1) on fabric specimens: (a) E3_36f, (b) E3_72f, (c) E3_144f. 2% methylene blue was added in 10% isopropyl alcohol for visual observation. | ||
For a flat surface like a film, it is expected that the contact angle will decrease with a reduction in surface tension according to the Young’s model.9 According to the Wenzel model,25 if the contact angle at a flat surface (θe) is smaller than 90°, the surface roughness will contribute to reducing the contact angle. However, from the contact angles of the 5% and 10% isopropyl alcohol solution in Table 4, although θe of H_film was smaller than 90°, the fabric specimens 36f, 72f and 144f with increased roughness exhibited an increase in contact angle. The reason for the opposing results against expectations from the Wenzel model could be explained through the role of “re-entrant structures”.
According to the study by Tuteja et al.,4 a re-entrant structure can create a condition in which pocketed air can be formed, as long as the contact angle at a flat surface (θe) is greater than the re-entrant angle (ψ) presented in Fig. 2, no matter what θe is.
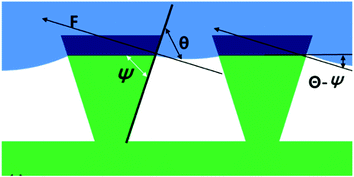 | ||
| Fig. 2 A schematic diagram of the re-entrant structure suggested by Tuteja et al.4 | ||
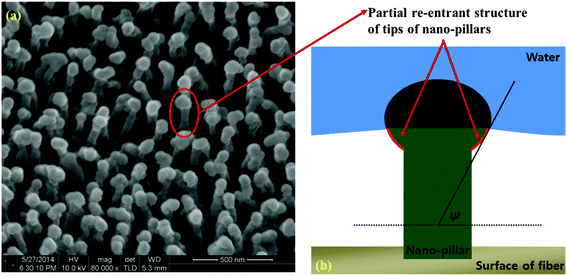
If the theory of “re-entrant structures” is to be applied to this study, it can be presumed that, as the contact angle θe of 10% isopropyl alcohol was measured as 73.5° at H_film, the non-wetting status could be maintained when ψ was smaller than 73.5°. In this study, nano-pillars stood in a vertical direction on the fiber surface, and there was a disparity in thickness between the tips and bottoms of these nano-pillars, which suggests the presence of re-entrant structures as suggested in Fig. 3 (ref. 22) and 4. The nano-pillar was formed then its length increased as the etching depth increased. Also, the tip of the pillar turned into the re-entrant structure as described by Tuteja et al., clearly as the etching time increased. Fig. 4 shows an enlarged image of a nano-pillar in a tilted image and an illustration of how the tips of the nano-pillars form a re-entrant angle.4
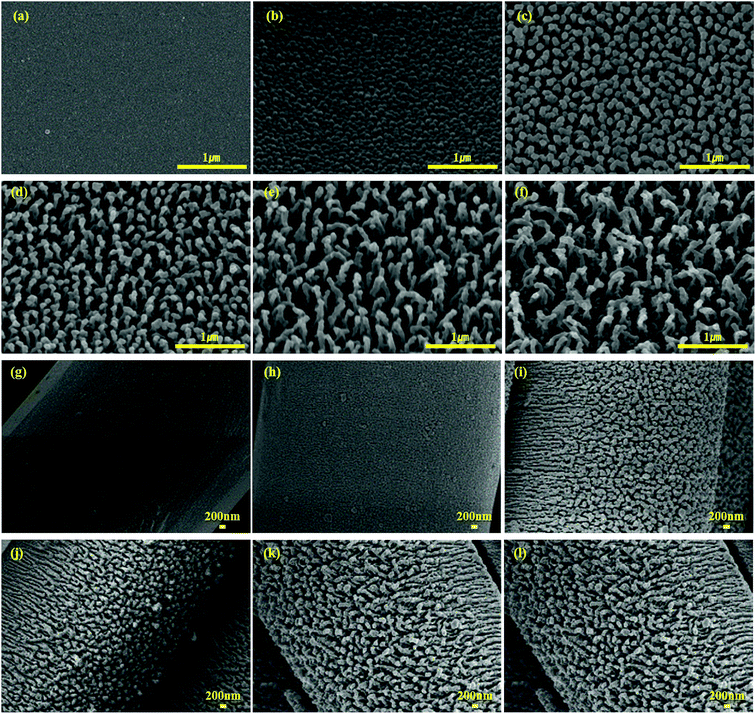 | ||
| Fig. 3 PET films and 144f treated using plasma treatment (a) H_film, (b) E1_film, (c) E3_film, (d) E5_film, (e) E7_film, (f) E10_film, (g) H_144f, (h) E1_144f, (i) E3_144f, (j) E5_144f, (k) E7_144f, (l) E10_144f (for a clearer observation of the cross-section of nano-pillars with etching time, the specimens were observed in the vertical direction at a 30° angled direction) [reprinted from authors’ earlier work, listed in ref. 22, with permission from ]. Reproduced with permission from SAGE Publications. | ||
The effect of dual scale roughness on superhydrophobicity
As a dual-structured surface structure has emerged as an influential factor in superhydrophobicity, a number of studies have been conducted on predicting the wettability of a liquid on a solid surface with a dual roughness structure.4–10,14–19The Cassie–Baxter model26 is based on the presumption that if a surface has a one-dimensional single structure, the solid fraction of water droplets on the surface structure has a significant influence on the wettability. However, as the importance of the influence of a dual scale structure on superhydrophobicity has been emphasized recently, there have been several attempts to use modified Cassie–Baxter models to predict the wettability of a surface with hierarchical dual scale roughness.
The study by Rahmawan et al.20 classified the wetting state into four types based on the assumption that the wettability on a micro-scale roughness surface and on a nano-roughness surface can change, respectively, depending on the Wenzel state and the Cassie–Baxter state.20 Among the four types of wetting state, the Cassie–Cassie state is a condition in which both the micro- and nano-scale pillars are not wetted; the Wenzel–Cassie state is a condition in which the micro-scale pillars are wetted, while the nano-scale pillars are not; the Cassie–Wenzel state is a condition in which the micro-scale pillars are not wetted, while the nano-scale pillars are; and the Wenzel–Wenzel state is a condition in which both the micro- and nano-scale pillars are wetted.20 The models in each state are demonstrated in the following.
cos![[thin space (1/6-em)]](https://www.rsc.org/images/entities/char_2009.gif) θcc = fmfn(cos θcc = fmfn(cos![[thin space (1/6-em)]](https://www.rsc.org/images/entities/char_2009.gif) θe + 1), Cassie–Cassie state θe + 1), Cassie–Cassie state |
cos![[thin space (1/6-em)]](https://www.rsc.org/images/entities/char_2009.gif) θwc = Rm{fn(cos θwc = Rm{fn(cos![[thin space (1/6-em)]](https://www.rsc.org/images/entities/char_2009.gif) θe + 1) − 1}, Wenzel–Cassie state θe + 1) − 1}, Wenzel–Cassie state |
cos![[thin space (1/6-em)]](https://www.rsc.org/images/entities/char_2009.gif) θcw = Rn{fm(cos θcw = Rn{fm(cos![[thin space (1/6-em)]](https://www.rsc.org/images/entities/char_2009.gif) θe + 1) − 1}, Cassie–Wenzel state θe + 1) − 1}, Cassie–Wenzel state |
cos![[thin space (1/6-em)]](https://www.rsc.org/images/entities/char_2009.gif) θww = RnRn θww = RnRn![[thin space (1/6-em)]](https://www.rsc.org/images/entities/char_2009.gif) cos cos![[thin space (1/6-em)]](https://www.rsc.org/images/entities/char_2009.gif) θe, Cassie–Wenzel state θe, Cassie–Wenzel state |
Though direct evidence is lacking to show that the contact of a liquid on the fabric surface follows the Cassie–Baxter model, we speculated that it follows the Cassie–Baxter state from the following phenomena. First, the contact angle on the treated surface was maintained as large as 140° (or greater) for longer than 5 min. This suggested that the liquid drop was held by entrapped air instead of being penetrated through nano-pillars or fiber interstices. Second, for the fabrics treated both using etching and HMDSO coating, the shedding angle of water was less than 10°, and this low shedding angle suggested that the contact area between the liquid and fabric surface was minimal, leading to the easy roll-off of liquid drops. From those observations, it was assumed that there exists entrapped air between the nano-pillars and fibers, and the wetting state follows the Cassie–Baxter model. To examine the influence of micro/nano-scale dual roughness on wettability, this study applied the equation of the Cassie–Cassie model suggested by Rahmawan et al.20 The solid fraction on the micro-scale roughness of a fabric (fm) was estimated as 0.22–0.28 from the following Cassie–Baxter eqn (1). That is, θCB was measured from the water contact angles on H_36f, H_72f, and H_144f; θe is measured from the water contact angle on H_film; and fm was estimated from eqn (1) with the measured θCB and θe. fm values for H_36f, H_72f, and H_144f were estimated as 0.28, 0.27 and 0.22 respectively.
cos![[thin space (1/6-em)]](https://www.rsc.org/images/entities/char_2009.gif) θCB = fm(cos θCB = fm(cos![[thin space (1/6-em)]](https://www.rsc.org/images/entities/char_2009.gif) θe + 1) − 1 θe + 1) − 1 | (1) |
Prediction of Cassie–Cassie contact angles for samples E1–E15 were made using the respective fm values for 36f, 72f, and 144f (Table 5). Also, the solid fraction on a nano-scale structure (fn) was calculated by using the following eqn (2) suggested by Cha et al.27 on the assumption that pillars of a column shape were distributed at an approximately uniform interval. The solid fraction ‘fn’ was calculated by substituting actual values measured through the SEM images of the film specimens for ‘s’ (thickness of nano-pillars) and ‘d’ (interval between nano-pillars).21
 | (2) |
| Code | Nano-pillar size (nm) | f n | f m | Predicted CA (°) from C–Ceq. | Measured CA (°) | |
|---|---|---|---|---|---|---|
| Diameter | Space | |||||
| 36f | ||||||
| E1 | 80.0 | 21.4 | 0.49 | 0.28 | 152.1 | 151.8 |
| E2 | 86.1 | 56.9 | 0.29 | 158.7 | 161.2 | |
| E3 | 71.4 | 78.3 | 0.18 | 163.2 | N/A | |
| E5 | 62.8 | 127.5 | 0.08 | 168.4 | N/A | |
| E7 | 61.8 | 161.9 | 0.06 | 170.3 | N/A | |
| E10 | 61.1 | 202.0 | 0.04 | 171.8 | N/A | |
| E15 | 59.5 | 284.0 | 0.02 | 173.9 | N/A | |
![[thin space (1/6-em)]](https://www.rsc.org/images/entities/char_2009.gif) |
||||||
| 72f | ||||||
| E1 | 80.0 | 21.4 | 0.49 | 0.27 | 152.7 | 150.4 |
| E2 | 86.1 | 56.9 | 0.29 | 159.2 | 165.7 | |
| E3 | 71.4 | 78.3 | 0.18 | 163.6 | N/A | |
| E5 | 62.8 | 127.5 | 0.08 | 168.7 | N/A | |
| E7 | 61.8 | 161.9 | 0.06 | 170.5 | N/A | |
| E10 | 61.1 | 202.0 | 0.04 | 172.0 | N/A | |
| E15 | 59.5 | 284.0 | 0.02 | 174.1 | N/A | |
![[thin space (1/6-em)]](https://www.rsc.org/images/entities/char_2009.gif) |
||||||
| 144f | ||||||
| E1 | 80.0 | 21.4 | 0.49 | 0.22 | 155.4 | 157.8 |
| E2 | 86.1 | 56.9 | 0.29 | 161.2 | 167.6 | |
| E3 | 71.4 | 78.3 | 0.18 | 165.2 | N/A | |
| E5 | 62.8 | 127.5 | 0.08 | 169.8 | N/A | |
| E7 | 61.8 | 161.9 | 0.06 | 171.4 | N/A | |
| E10 | 61.1 | 202.0 | 0.04 | 172.8 | N/A | |
| E15 | 59.5 | 284.0 | 0.02 | 174.6 | N/A | |
The reason that we used the film instead of a fabric in measuring the nano-pillar size is that (1) a film and a fabric made of the same polymer usually show a similar etching tendency, (2) nano-pillars on the flat film surface were thought to give a more accurate measurement of the nano-pillars due to the waviness of a fabric substrate.
In Table 5, fn of the dual roughness structure was calculated through the Cassie–Cassie model, and the wettability in terms of θcc was predicted. The solid fraction of the nano-scale structure (fn) gradually declined from 0.49 as the etching time was increased, and dropped to as low as 0.02 after 15 min of etching. The predicted contact angle was increased from 152° to 174° with the lapse of etching time. The actual measurement values were slightly higher than the predicted values; however, the results support the assumption that water droplets on a plasma-treated fabric were in the Cassie–Cassie state in which both the micro and nano-scale pillars were not wetted.
The reason that the actual measurement values were higher than the predicted values can be explained from the following. The calculation process of fn in the Cassie–Cassie equation was based on the assumption that nano pillars of a cylindrical column shape were distributed at a uniform interval. However, from the SEM observations, the thickness of the nano-pillars between the tip and the bottom differed (Fig. 4). The disparity in thickness between the tip and the bottom of the nano-pillars became larger as the etching time was prolonged. Therefore, as the etching time got longer, the tips of the nano-pillars formed were more like re-entrant structures, and these partially formed re-entrant structures caused a gap between the predicted and actually measured values.
Theoretical prediction of the wettability of low surface tension liquids (42 dyn cm−1)
To investigate the wettability of the test reagent whose surface tension is lower than water, the wetting states were analyzed by applying the same Cassie–Cassie and Cassie–Wenzel models. Table 6 shows the contact angle of 10% isopropyl alcohol predicted by the Cassie–Cassie and Cassie–Wenzel equations. fn, the solid fraction for nano-scale roughness in the Cassie–Cassie model was estimated from eqn (2) (Tables 5 and 6). rf, the roughness factor for nano-scale roughness in the Cassie–Wenzel model was estimated using eqn (3) following Wenzel’s definition.25,27 The estimated roughness factors fn and rf were used as inputs to calculate θcc (the contact angle predicted by the Cassie–Cassie model) and θcw (the contact angle predicted by the Cassie–Wenzel model) (Table 6). | (3) |
| Code | Nano-pillar size (nm) | f n | r f | Predicted CA (°) from C–Ceq. | Measured CA (°) | Predicted CA (°) from C–Weq. | ||
|---|---|---|---|---|---|---|---|---|
| Diameter | Height | Space | ||||||
| 36f | ||||||||
| E1 | 80.0 | 71.5 | 21.4 | 0.49 | 2.75 | 139.6 | 125 | 108.9 |
| E2 | 86.1 | 159.1 | 56.7 | 0.29 | 3.11 | 149.4 | 142 | 106.5 |
| E3 | 71.4 | 191.0 | 78.3 | 0.18 | 2.91 | 155.9 | 160 | 107.8 |
| E5 | 62.8 | 255.2 | 127.5 | 0.08 | 2.39 | 163.4 | 168 | 111.2 |
| E7 | 61.8 | 610.0 | 161.9 | 0.06 | 3.37 | 166.1 | 173 | 104.9 |
| E10 | 61.1 | 953.4 | 202.0 | 0.04 | 3.64 | 168.3 | N/A | 103.1 |
| E15 | 59.5 | 849.6 | 284.0 | 0.02 | 2.35 | 171.3 | N/A | 111.5 |
![[thin space (1/6-em)]](https://www.rsc.org/images/entities/char_2009.gif) |
||||||||
| 72f | ||||||||
| E1 | 80.0 | 71.5 | 21.4 | 0.49 | 2.75 | 140.7 | 128 | 111.0 |
| E2 | 86.1 | 159.1 | 56.7 | 0.29 | 3.11 | 150.2 | 142 | 208.8 |
| E3 | 71.4 | 191.0 | 78.3 | 0.18 | 2.91 | 156.6 | 161 | 110.0 |
| E5 | 62.8 | 255.2 | 127.5 | 0.08 | 2.39 | 163.8 | 163 | 113.3 |
| E7 | 61.8 | 610.0 | 161.9 | 0.06 | 3.37 | 166.5 | N/A | 107.2 |
| E10 | 61.1 | 953.4 | 202.0 | 0.04 | 3.64 | 168.6 | N/A | 105.5 |
| E15 | 59.5 | 849.6 | 284.0 | 0.02 | 2.35 | 171.5 | N/A | 113.6 |
![[thin space (1/6-em)]](https://www.rsc.org/images/entities/char_2009.gif) |
||||||||
| 144f | ||||||||
| E1 | 80.0 | 71.5 | 21.4 | 0.49 | 2.75 | 141.6 | 132 | 112.7 |
| E2 | 86.1 | 159.1 | 56.7 | 0.29 | 3.11 | 150.9 | 146 | 110.5 |
| E3 | 71.4 | 191.0 | 78.3 | 0.18 | 2.91 | 157.1 | 163 | 111.7 |
| E5 | 62.8 | 255.2 | 127.5 | 0.08 | 2.39 | 164.2 | 165 | 114.9 |
| E7 | 61.8 | 610.0 | 161.9 | 0.06 | 3.37 | 166.8 | 173 | 109.0 |
| E10 | 61.1 | 953.4 | 202.0 | 0.04 | 3.64 | 168.9 | N/A | 107.3 |
| E15 | 59.5 | 849.6 | 284.0 | 0.02 | 2.35 | 171.7 | N/A | 115.2 |
The actual contact angles of the specimens treated for 1 min and 2 min with plasma etching lay between the predicted values from the Cassie–Cassie and the Cassie–Wenzel models. Therefore, the wetting state on these surfaces appeared to be in a transitional state where the nano-pillars are partially wetted. After 3 min of etching, the actual contact angles were similar to or higher than the predicted contact angles from the Cassie–Cassie model. Thus, it seemed that if the aspect ratio of the nano-pillars was adequately increased, the wetting state could shift from the transitional state to the Cassie–Cassie state. The disparity between the actual measurements and the predicted values appeared after 7 min of plasma etching, probably due to the partial formation of re-entrant structures as was demonstrated earlier.
Self-cleaning effect using water
For the self-cleaning test, silicon carbide and Sudan Black B were employed as hydrophilic and hydrophobic model particles, respectively.28Fig. 5 shows the recorded images of the self-cleaning phenomenon using water droplets, which were captured at an interval of 0.32 s. Fig. 5(a) presents the images for the removal of silicon carbide, and Fig. 5(b) displays the removal of Sudan Black B. The fabric specimen used for the test was E3_144f which exhibited a shedding angle of less than 1° using water. Both silicon carbide and Sudan Black B particles were removed by the rolling off of water droplets, and the distance of the rolling off was greater than 3 cm. Nishimoto and Bhushan10 reported that when water droplets roll off a surface that is soiled with hydrophobic solid particles, water droplets usually fail to pick up the hydrophobic particles, leaving the solid particles on the surface. In other words, if the adhesion between a hydrophobic surface and hydrophobic particles is relatively stronger than that between water droplets and hydrophobic particles, the roll-off of hydrophobic soil particles can be limited. In contrast to such a theoretical argument, the experiment in this study showed that the removal of both hydrophilic (silicon carbide) and hydrophobic (Sudan Black B) soil particles was possible by the rolling off of water. This might be due to the significantly lowered work of adhesion, resulting from the reduced contact area between the soil particles and roughened fabric.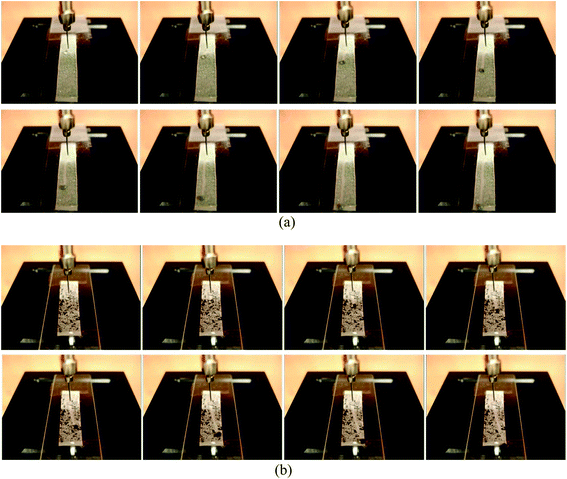 | ||
| Fig. 5 Self-cleaning effect using water on E3_144f: (a) silicon carbide particles, and (b) Sudan Black B particles. | ||
Self-cleaning effect using 10% isopropyl alcohol
Fig. 6 presents the video-recorded images of the self-cleaning phenomenon using 10% isopropyl alcohol, where solid particles were adsorbed and removed from the specimen E7_144f by the liquid drops. With 10% isopropyl alcohol, the removal of solid particles of silicon carbide and Sudan Black B was difficult. Although there was no solid particles left on the roll-off path of the liquid, there were no droplets that rolled more than 2 cm away. The average roll-off length for silicon carbide was 0.56 cm, while that for Sudan Black B was 0.36 cm. Based on the results, it can be presumed that liquid drops with a surface tension lower than water might be difficult to maintain in a spherical shape during the roll-off, and after picking up solid particles, the droplets could not roll off easily due to a lack of kinetic energy. In the meantime, the test with 10% isopropyl alcohol failed to observe any possible influence of the chemical properties – hydrophilic or hydrophobic – of soil particles on the self-cleaning effect.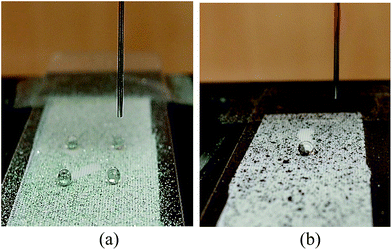 | ||
| Fig. 6 Images of the self-cleaning effect using 10% isopropyl alcohol on E7_144f: (a) silicon carbide particles, and (b) Sudan Black B particles. | ||
Conclusion
A super-repellent fabric was fabricated using plasma etching and HMDSO vapor deposition, and the influence of dual roughness in micro and nano-scale structures on the wettability was analyzed. To assess the wettability of the treated fabric, the contact angles were measured using a test reagent whose surface tension was controlled through mixing with isopropyl alcohol. The fabrics with dual-scale roughness showed a level of repellency with a contact angle larger than 160° against the test liquid whose surface tension was as low as 42 dyn cm−1 (10% isopropyl alcohol in aqueous solution).The water-wetting behavior of the treated fabrics with dual-scale roughness followed the Cassie–Cassie model, where both the micro-scale fibers and nano-scale pillars were not wetted. For the liquid with a surface tension of 42 dyn cm−1 (10% isopropyl alcohol), the wetting behavior of the 1–2 min etched fabrics followed the Cassie–Wenzel state, where only the nano-pillars were wetted; then as the aspect ratio of the nano-pillars was increased, it shifted to the Cassie–Cassie state. With the increased etching time, the actual contact angles measured were larger than those predicted using the Cassie–Cassie model, which may have resulted from the formation of partial re-entrant structures at the tips of the nano-pillars.
The self-cleaning effect was demonstrated for solid particles including silicon carbide and Sudan Black B that adhered on the treated fabric surface. Soiled particles adhered to water drops and rolled off from the surface at a tilting angle of 1°.
Future study is recommended to include various liquids with different viscosities and polarities, to lead to the development of a superomniphobic fabric that is repellent to most liquid pollutants with a wider range of properties.
Acknowledgements
This research was supported by Basic Science Research Program through the National Research Foundation of Korea (NRF) funded by the Korea government (MSIP) (No. 2015R1A2A2A03002760), and by BK21 Plus project of the National Research Foundation of Korea Grant funded by the Korean Government. The authors thank the Computational Science Research Center of the Korea Institute of Science and Technology (KIST) for making the plasma equipment available for this study.References
- S. Wang and L. Jiang, Adv. Mater., 2007, 19, 3423–3424 CrossRef CAS.
- H. Lee and J. Owens, Superhydrophobic Superoleophobic Woven Fabrics. Advances in Modern Woven Fabrics Technology, 2011 Search PubMed.
- M. Ma and R. M. Hill, Curr. Opin. Colloid Interface Sci., 2006, 11, 193–202 CrossRef CAS.
- A. Tuteja, W. Choi, G. H. Mckinley, R. E. Cohen and M. Frubner, MRS Bull., 2008, 33, 752–758 CrossRef CAS.
- A. Tuteja, W. Choi, J. Marbry, G. H. Mckinley and R. E. Cohen, Proc. Natl. Acad. Sci. U. S. A., 2008, 105, 18200–18205 CrossRef CAS PubMed.
- A. Tuteja, W. Choi, M. Ma, J. Marbry, S. A. Mazzella, G. C. Rutledge, G. H. Mckinley and R. E. Cohen, Science, 2007, 318, 1618–1622 CrossRef CAS PubMed.
- R. Saraf, H. J. Lee, S. Michielesen, J. Owens, C. Willis, C. Stone and E. Wilusz, J. Mater. Sci., 2011, 46, 5751–5760 CrossRef CAS.
- S. Herminghaus, Europhys. Lett., 2000, 52, 165–170 CrossRef.
- T. Young, Philos. Trans. R. Soc. London, 1805, 95, 65–87 CrossRef.
- S. Nishimoto and B. Bhushan, RSC Adv., 2013, 3, 671–690 RSC.
- P. G. Degennes, Rev. Mod. Phys., 1985, 57, 827–863 CrossRef CAS.
- J. Li, Z. Zhang, J. Xu and C. P. Wong, Self-Cleaning Materials—Lotus Effect Surfaces, in Kirk-Othmer Encyclopedia of Chemical Technology, John Wiley & Sons, Inc, 2000 Search PubMed.
- W. Barthlott and C. Neinhuis, Planta, 1997, 202, 1–8 CrossRef CAS.
- K. Autumn, Y. A. Liang, S. T. Hsieh, W. Zesch, W. P. Chan, T. W. Kenny, R. Fearing and R. T. J. Full, Nature, 2000, 405, 681–685 CrossRef CAS PubMed.
- M. J. Hancock, K. Sekeroglu and M. C. Demirel, Adv. Funct. Mater., 2012, 22, 2223–2234 CrossRef CAS PubMed.
- S. Sethi, L. Ge, L. Ci, P. M. Ajayan and A. Dhinojwala, Nano Lett., 2008, 8, 822–825 CrossRef CAS PubMed.
- N. A. Patankar, Langmuir, 2004, 20, 8209–8213 CrossRef CAS PubMed.
- B. Bhushan and Y. C. Jung, Ultramicroscopy, 2007, 107, 1033–1041 CrossRef CAS PubMed.
- K. Koch, B. Bhushan, Y. C. Jung and W. Barthlott, Soft Matter, 2009, 5, 1386–1393 RSC.
- Y. Rahmawan, M. W. Moon, K. S. Kim, K. R. Lee and K. Y. Suh, Langmuir, 2009, 26, 484–491 CrossRef PubMed.
- S. Kwon, T. J. Ko, E. Yu, J. Kim, M. W. Moon and C. H. Park, RSC Adv., 2014, 4, 45442–45448 RSC.
- S. Park, J. Kim and C. H. Park, Text. Res. J., 2016 DOI:10.1177/0040517515627169.
- S. Zanini, C. Riccardi, M. Orlandi, P. Esena, M. Tontini, M. Milani and V. Cassio, Surf. Coat. Technol., 2005, 200, 953–957 CrossRef CAS.
- Aqueous Liquid Repellency: Water/Alcohol Solution Resistance Test 22-2005. 2009: technical manual of the American Association of Textile chemists and colorists.
- R. N. Wenzel, Ind. Eng. Chem., 1936, 28, 988–994 CrossRef CAS.
- A. Cassie and S. Baxter, Trans. Faraday Soc., 1944, 40, 546–551 RSC.
- T. G. Cha, J. W. Yi, M. W. Moon, K. R. Lee and H. Y. Kim, Langmuir, 2010, 26, 8319–8326 CrossRef CAS PubMed.
- B. Bhushan, Y. Jung and K. Koch, Langmuir, 2009, 25, 3240–3248 CrossRef CAS PubMed.
| This journal is © The Royal Society of Chemistry 2016 |

