A label-free fluorescent probe for Hg2+ based on boron- and nitrogen-doped photoluminescent WS2†
Bo Feng*,
Xiaojia Liu,
Yizhi Zheng,
Qian Xiao,
Na Wu and
Suiping Wang*
College of Chemical Engineering, Xiangtan University, Xiangtan 411105, Hunan Province, China. E-mail: fengbo@xtu.edu.cn; fengbo5460@hotmail.com; Fax: +86 731 58298172; Tel: +86 731 58298259
First published on 11th May 2016
Abstract
The air-stable doping of transition-metal dichalcogenides is important in enabling a wide range of optoelectronic and electronic devices while exploring basic material properties. In this work, we develop for the first time a simple, low-cost synthesis route to preparing boron-and-nitrogen-doped WS2 (B, N-WS2) nanosheets. Bulk WS2, a prototypical transition-metal chalcogenide material, is an indirect band-gap semiconductor with negligible photoluminescence. The obtained B, N-WS2 nanosheets exhibited enhanced fluorescence. The B, N-WS2 nanosheets can be used as a green and easy sensing platform for the label-free detection of Hg2+ because of the high sensitivity and selectivity toward Hg2+. Detection can also be easily accomplished through a rapid, one-step (within 1 min) operation, with a limit as low as 23 nM (S/N = 3).
1. Introduction
Heavy metal ion pollution has become a critical worldwide issue for years because of severe risks to human health and the environment.1 Mercury ion has been recognized as one of the most toxic transition-metal ions in the world by the United States Environment Protection Agency.2 Hg2+ has been demonstrated to be able to easily pass through skin, respiratory, and gastrointestinal tissues into the human body and damage the central nervous and endocrine systems,3 thereby raising serious environmental and health concerns. These health and environmental problems of the mercury(II) ion have prompted the development of efficient, rapid, facile, and applicable methods for the sensitive and selective assay of mercury(II) ions. Therefore, a convenient and rapid method for the analysis of Hg2+ ions is highly desirable. Fluorescence-based mercury(II)-ion detection has attracted considerable interest because of its simple operation, high sensitivity, and adaptability for in-field measurement. Recently, numerous studies have been reported for the detection of these ions.4–8 So far, a wide variety of fluorescent probes have been developed, including fluorescent dye organic molecules, noble metal nanoclusters and metal-based quantum dots (MQDs) etc. Zhang et al.9 described a novel rhodamine-based fluorescent chemosensor as an “off–on” fluorescent probe for the detection of Hg2+ in aqueous samples. Lin et al.10 demonstrated the use of lysozyme type VI-stabilized gold nanoclusters (LysVI-AuNCs) for the detection of Hg2+ based on fluorescence quenching. Zhou et al.11 developed carbon nanodots as fluorescence probes for rapid, sensitive, and label-free detection of Hg2+. Such fluorescent probes, however, suffer from photobleaching of fluorescent dye, expensive cost of noble metals, or toxicity of MQDs, limiting their widespread applications.Over the past two decades, two-dimensional (2D) transition-metal dichalcogenides (TMDs) have garnered considerable attention from scientists, leading to wide-ranging and diversified technological applications because of their unusual properties.12–15 TMDs are MX2 type compounds, where M is a transition metal belonging to groups IV, V, and VI, and X is a chalcogen, such as S, Se, and Te.16–18 For bulk-layered TMDs, strong intralayer covalent M–X bonds exist, while weak van der Waals interactions connect the adjacent layers, which could be cleaved to few-layer nanosheets. The properties of 2D TMDs are found to be advantageous in other branches of science, such as biosensors and nanomedicine, taking advantage of large surface area, good biocompatibility, fluorescence, electrical conductivity, and rapid heterogeneous electron transfer.19,20 TMDs, typically MoS2 and WS2, are the most important grapheme-like two-dimensional layered materials. WS2 has been the subject of substantial interest because the band gap is well matched to the solar spectrum.21 WS2 can act as an efficient photoconductive layer in photovoltaic devices and photoelectrochemical solar cells.22 The main advantage of WS2 is corrosion prevention, as phototransitions involve nonbonding d–d orbitals of W atoms.23 WS2 is a quasi-two-dimensional compound, with covalently bonded S–metal–S sheets held by van der Waals forces. In addition, the unique combinations of structural, electronic, catalytic, mechanical, and related properties of the material can offer superiority in applications of biosensors and nanomedicine for achieving detection, diagnosis, and therapy with high sensitivity, specificity, and accuracy. Heteroatom doping can drastically alter the electronic characteristics of TMDs, thus resulting in unusual properties and related applications. Ultra-thin, ultra-small, defect, and doped WS2 prepared by different researchers have shown excellent applications in semiconductors and fluorescence materials.24,25
For the first time in this study, we report a facile and low-cost synthetic strategy to prepare fluorescent nanosheets of B, N-WS2 by doping WS2 with boron and nitride using the doping method to change the band gap of WS2. Boron and nitrogen atoms were incorporated in WS2 by co-annealing with boric acid and melamine. The as-prepared samples were demonstrated as a highly effective fluorescent-sensing platform for label-free, sensitive, and effective Hg2+ detection with a detection limit of as low as 23 nM. The entire detection process can be completed within 1 min. The proposed design is simple to prepare and exhibits low background interference, high sensitivity, and ultrafast response. This work successfully demonstrates that the introduction of boron and nitrogen elements into ultrathin WS2 nanosheets for enhanced fluorescence properties is feasible through a facile and general preparation strategy. This study may open up a potential approach toward designing more efficient TMD-based biosensors and fluorescence material.
2. Experimental section
2.1 Materials
Hg(Ac)2, Fe(NO3)2, Fe(NO3)3, Cu(NO3)2, CaCl2, LiNO3, NaNO3, KNO3, Zn(Ac)2, Mg(NO3)2, Ni(NO3)2, Pb(NO3)2, Mn(NO3)2, Ba(NO3)2, and CoCl2 were purchased from Aladdin Ltd. (Shanghai, China). All reagents are of analytical grade and were used as received without further purification. Double-distilled water was used throughout the experiments.2.2 Characterizations
Fluorescent emission spectra were recorded on a F-7000 spectrofluorometer (Hitachi, Japan). Ultraviolet-visible (UV-vis) spectra were recorded with a UV-1800 spectrophotometer (Shimadzu, Japan). The morphology of products was investigated by scanning electron microscopy (SEM, Hitachi S-4800, Japan) at 5.0 kV accelerating voltage. X-ray diffraction (XRD) analysis was carried out on a BRUKER D8-ADVANCE X-ray diffractometer by using Cu (40 kV, 40 mA) radiation. Raman spectra were obtained using a laser confocal Raman spectrometer (LABRAM-010) in the range of 300 cm−1 to 2000 cm−1. Transmission electron microscopy (TEM) images were obtained using a JEM-3010 (JEOL-3010, Japan). Metrology X-ray photoelectron spectroscopy (XPS) was carried out using Kα 1063 type with focused monochromatized Al Kα radiation (1486.6 eV).2.3 Synthesis of B, N-WS2
In a typical synthesis, bulk WS2 (0.5 g) was thoroughly mixed with a solution of boric acid (1 g) and melamine (1 g) in anhydrous ethanol (100 mL) by ultrasonic dispersion for 1 h. The mixture was dried at 80 °C, subsequently heated to 400 °C in N2 atmosphere at a heating rate of 5 °C min−1, and maintained for 2 h. The sample was cooled to room temperature to obtain the B, N-WS2 powder. In a typical run, 10 mg of B, N-WS2 powder was added to 100 mL of deionized water. After ultrasonic dispersion for 2 h, the precipitate was removed by centrifugation at 2000 rpm for 3 min, and the clear supernatant extract was prepared for analysis.2.4 Detection of Hg ions
Hg ions were detected at room temperature in aqueous solution. Hg aqueous solutions at different concentrations, together with other metal ion solutions, were freshly prepared before use. To evaluate the sensitivity towards Hg2+, we added different concentrations of Hg2+ into the as-prepared supernatant of B, N-WS2. The mixed solutions were equilibrated for 2 min before spectral measurements. Photoluminescence (PL) spectra were recorded by operating a fluorescence spectrophotometer at 280 nm excitation wavelength.3. Results and discussion
3.1 Characterizations of B, N-WS2
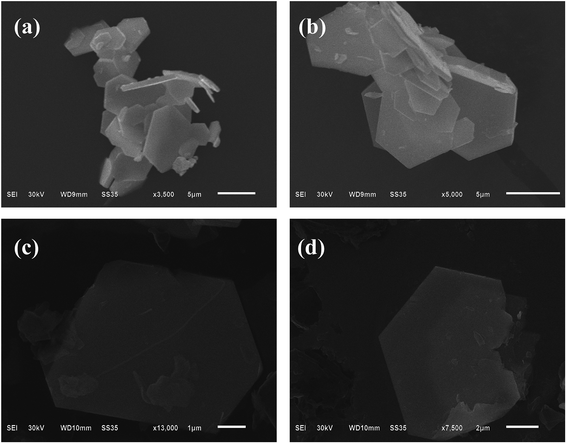
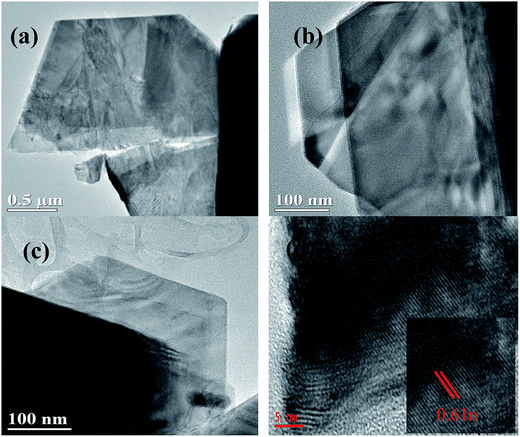
The morphologies of the as-prepared B, N-WS2 were characterized by SEM and TEM. Fig. 1(a) and (b) display the SEM image of bulk WS2. The SEM image indicates that bulk WS2 is solidly agglomerated at approximately several micrometers in size and exhibit the accumulation of large structures. Meanwhile B, N-WS2 did not retain the original morphology of bulk WS2 after the doping process. In contrast, a thin-layer structure is shown in Fig. 1(c) and (d), demonstrating that boron- and nitrogen-doped WS2 two-dimensional layered ultrathin nanosheets have been successfully prepared after doping and ultrasonication.TEM was carried out to further analyze the layer structure of B, N-WS2. Fig. 2(a) shows the image of B, N-WS2, which possesses a layer structure at the micrometer scale. Ultrathin structure can be seen clearly in Fig. 2(b) and (c). The inset of Fig. 2(d) shows the high resolution transmission electron microscopy (HRTEM) image of B, N-MoS2, with the (002) crystal plane spacing of 0.62 nm of the lattice. The result fits well with the XRD result. Fig. 2 indicates that the layered nanosheets are successfully prepared.
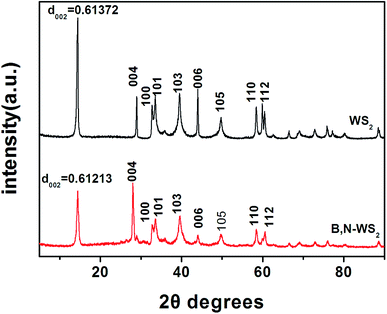
In addition, the crystalline structure of bulk WS2 and B, N-WS2 were determined by powder XRD (Fig. 3). The peaks at 14.3°, 28.9°, 32.7°, 33.5°, 39.5°, 44.0°, 58.4°, 59.9°, and 60.4° correspond to the (002), (004), (100), (101), (103), (006), (105) (110), and (112) reflections of bulk WS2 (indexed by Chem. Mater., vol. 12, no. 5, 2000), respectively. For B, N-WS2, the peaks at 14.4°, 28.9°, 32.8°, 33.5°, 39.7°, 44.0°, 58.3°, 59.8°, and 60.5°correspond to the (002), (004), (100), (101), (103), (006), (105), (110), and (112) reflections, respectively. Compared with bulk WS2, the d spacing of B, N-WS2 decreases from 0.61372 nm to 0.61213 nm, indicating that B and N were doped into the WS2 structure.
XPS was conducted to analyze the chemical states of W and S in the bulk WS2 and B, N-WS2 samples (Fig. 4). According to the full survey spectra in Fig. 4(a), the elements W, S, C, and O are found in all samples. However, B and N are found on the B, N-WS2 sample, indicating that B and N were successfully doped into WS2. The W 4f doublet peak energies 32.75 eV (W 4f7/2) and 34.9 eV (W 4f5/2), and S 2p double peak energies 162.55 (S 2p3/2) and 163.8 eV (S 2p1/2) are identified in the spectra. The binding energies are in good agreement with the reported values for WS2 samples.19 The peaks corresponding to the S 2p3/2 and S 2p1/2 similar to the bulk WS2 sample. However, compared with the bulk WS2 sample, the XPS spectrum of B, N-WS2 shows W 4f peaks are shifting toward higher binding energies at 33.35 and 35.8 eV, indicating that boron and nitrogen elements are successfully doped into WS2. These results agree with the EDS result of the B, N-WS2 sample (ESI, Fig. S1†).
 | ||
| Fig. 4 XPS spectra of bulk WS2 and B, N-WS2. The full formation elements XPS survey spectra (a), high-resolution XPS analysis for W 4f (b) and S 2p peaks (c). | ||
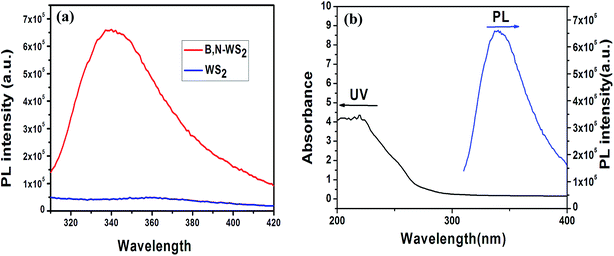
Fig. 5(a) shows the PL emission spectra of B, N-WS2 and bulk WS2 at the same concentration and excitation at 280 nm. Notably, the fluorescence of the bulk WS2 dispersion can almost be ignored. However, the B, N-WS2 dispersion shows a strong PL emission peak centered at 343 nm, indicating that the nanosheets are fluorescent. Fig. 5(b) shows the UV-vis absorption and PL emission spectra of B, N-WS2 dispersion in water. The UV-vis spectrum shows an absorption peak at 220 nm. The dispersion exhibits a strong PL emission peak centered at 343 nm when excited at 280 nm, indicating that the B, N-WS2 nanosheet exhibits strong fluorescence.
The luminescence quantum yield and emission lifetime of B, N-WS2 have been estimated. Fluorescence quantum yield of the peptide sensor was measured using quinine sulfate (QY = 0.427 in water) as the standard. The quantum yield was calculated as the follow equation:
3.2 Label-free and highly selective detection of Hg2+ ions with B, N-WS2
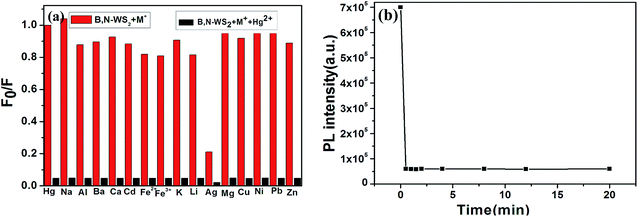
To evaluate the selectivity of this sensing system, we examined the PL intensity changes in the presence of representative metal ions under identical conditions. Fig. 6(a) shows the PL quenching results of B, N-WS2 in the presence of Na+, Al3+, Ba2+, Ca2+, Cd2+, Fe3+, Fe2+, Hg2+, K+, Li+, Ag+, Mg2+, Cu2+, Ni2+, Pb2+ and Zn2+ (50 μM). As shown in Fig. 6(a), evident PL quenching was observed upon the addition of Hg2+. We found that among the tested ions only Ag+ can quench the fluorescence of B, N-WS2 nanosheets and may interfere with the Ag+ detection. Fortunately, this issue can be circumvented by using Cl− as chelating agents for Ag+ ions and the results was shown in ESI Fig. S3.† The addition of Ag+ ions into the B, N-WS2 mixture in the presence of chelating agents has no effect on the detection of Hg2+. Moreover, no tremendous decrease was observed by addition of these metal ions into the system.Fluorescence quenching kinetics was also studied. Fig. 6(b) presents the time-dependent PL spectra of B, N-WS2 dispersion after the addition of Hg2+. Only 1 min was required to complete the reaction between B, N-WS2 and Hg2+, and no fluorescence change was observed within the following 12 h. All these observations indicate that the fluorescence of B, N-WS2 was completely quenched within seconds upon adding Hg2+ and that detection is ultrafast.
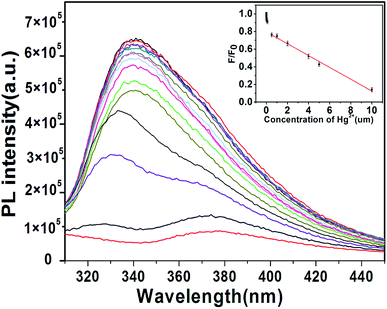
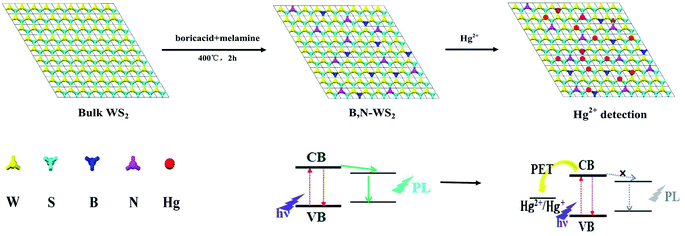
Aside from selectivity, sensitivity is another important parameter in evaluating the performance of a sensing system. Therefore, the PL intensity changes with different concentrations of Hg2+ were studied to evaluate the sensitivity of the sensing system in this study. Fig. 7 shows the PL spectra of the B, N-WS2 solution with different concentrations of Hg2+. The result indicates that the PL intensity of the mixture is sensitive to Hg2+ concentration and decreases with the increase in Hg2+ concentration. The introduction of Hg2+ into the dispersion leads to significant decrease in fluorescence intensity, indicating that Hg2+ can effectively quench the fluorescence of B, N-WS2 nanosheets. The interaction between Hg (soft donor) and sulfur atom (soft acceptor) is extremely strong.26,27 Interaction is believed to be able to bring the atoms into close proximity. Given that the redox potential of Hg2+/Hg+ lies between the conduction band (CB) and valence band (VB) of B, N-WS2, photoinduced electron transfer from the CB to the complex Hg2+ occurs, leading to fluorescence quenching (Scheme 1).
The inset in Fig. 7 shows the dependence of F/F0 on the concentration of Hg2+. F0 and F represent the fluorescence intensities of B, N-WS2 at 343 nm in the absence and presence of Hg2+, respectively. A good linear correlation was obtained over the concentration range of 1 μM to 10 μM. The detection limit was estimated to be 23 nM at a signal-to-noise ratio (S/N) of 3. The detection limit has been compared to the other methods. Table S2† compares the sensing performance of different fluorescent probes for Hg2+, showing that our sensing system exhibits superior sensitivity over previously reported sensing systems.
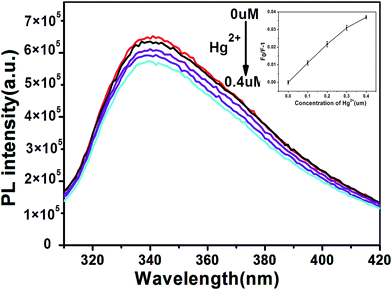
To demonstrate the practical use of the proposed, we performed a study to determine Hg2+ concentrations in tap water samples. As shown in Fig. 8, PL intensity decreases with increased concentration of Hg2+ from 0 μM to 0.4 μM. The calibration curve for determining Hg2+ in tap water was obtained by plotting the values of F0/F − 1 versus the concentrations of Hg2+ (Fig. 8, inset). The sensing system can distinguish between tap water spiked with 0.1 μM. In addition, the samples were also analyzed by cold vapor atomic absorption spectrometry (CV-AAS) as shown in Table S3.† The results suggest that the sensor is likely to be capable of practical Hg2+ detection upon further development. The proposed design is simple to prepare and exhibits low background interference, high sensitivity, and ultrafast response.
4. Conclusions
We successfully developed a simple method for the preparation of B, N-doped WS2 with boric acid and melamine as boron and nitrogen sources, respectively. The as-synthesized B, N-WS2 exhibited enhanced fluorescence in comparison with undoped WS2 and utilized as a highly efficient fluorescence sensor for selective detection of Hg2+. The detection is rapid and ultrasensitive, with an extremely low detection limit of 23 nM (S/N = 3). The present study is important because it demonstrates an economic, stable, and environment-friendly route toward the production of B, N-WS2 for rapid, highly selective, and sensitive optical detection of Hg2+ for the first time. This method may open up a potential approach for designing more efficient TMD-based biosensors and fluorescence materials.Acknowledgements
This work is supported by National Natural Science Foundation of China (31270988, 31401577), National Undergraduate Innovational Experimentation Program (201310530007), Scientific Research Fund of Hunan Provincial Education Department (13B120), China Postdoctoral Science Foundation (2014M562118) and Hunan Provincial Natural Science Foundation of China (2015JJ2133, 13JJ9004).References
- M. B. Gumpu, S. Sethuraman, U. M. Krishnan and J. B. B. Rayappan, Sens. Actuators, B, 2015, 213, 515–533 CrossRef CAS.
- S. Ando and K. Koide, J. Am. Chem. Soc., 2011, 133, 2556–2566 CrossRef CAS PubMed.
- J. Gutknecht, J. Membr. Biol., 1981, 61, 61–66 CrossRef CAS.
- H. Huang, J. J. Lv, D. L. Zhou, N. Bao, Y. Xu, A. J. Wang and J. J. Feng, RSC Adv., 2013, 3, 21691–21696 RSC.
- A. N. Liang, L. Wang, H. Q. Chen, B. B. Qian, B. Ling and J. Fu, Talanta, 2010, 81, 438–443 CrossRef CAS PubMed.
- Y. M. Guo, Z. Wang, H. W. Shao and X. Y. Jiang, Carbon, 2013, 52, 583–589 CrossRef CAS.
- Y. R. Zhu, H. Li, B. B. Shi, W. J. Qu, Y. M. Zhang, Q. Lin, H. Yao and T. B. Wei, RSC Adv., 2014, 4, 61320–61323 RSC.
- J. Hou, J. Li, J. Sun, S. Ai and M. Wang, RSC Adv., 2014, 4, 37342–37348 RSC.
- D. Zhang, M. Wang, C. C. Wang, M. Li, Y. Ye and Y. F. Zhao, J. Fluoresc., 2013, 23, 1045–1052 CrossRef CAS PubMed.
- Y. H. Lin and W. L. Tseng, Anal. Chem., 2010, 82, 9194–9200 CrossRef CAS PubMed.
- L. Zhou, Y. Lin, Z. Huang, J. Ren and X. Qu, Chem. Commun., 2012, 48, 1147–1149 RSC.
- J. Xie, H. Zhang, S. Li, R. Wang, X. Sun, M. Zhou, J. Zhou, X. W. Lou and Y. Xie, Adv. Mater., 2013, 25, 5807–5813 CrossRef CAS PubMed.
- X. Xu, C. S. Rout, J. Yang, R. Cao, P. Oh, H. S. Shin and J. Cho, J. Mater. Chem. A, 2013, 1, 14548–14554 CAS.
- D. Jariwala, V. K. Sangwan, L. J. Lauhon, T. J. Marks and M. C. Hersam, ACS Nano, 2014, 8, 1102–1120 CrossRef CAS PubMed.
- D. J. Li, U. N. Maiti, J. Lim, D. S. Choi, W. J. Lee, Y. Oh, G. Y. Lee and S. O. Kim, Nano Lett., 2014, 14, 1228–1233 CrossRef CAS PubMed.
- A. K. Geim and I. V. Grigorieva, Nature, 2013, 499, 419–425 CrossRef CAS PubMed.
- M. Xu, T. Liang, M. Shi and H. Chen, Chem. Rev., 2013, 113, 3766–3798 CrossRef CAS PubMed.
- M. Chhowalla, H. S. Shin, G. Eda, L. J. Li, K. P. Loh and H. Zhang, Nat. Chem., 2013, 5, 263–275 CrossRef PubMed.
- M. Pumera and A. H. Loo, TrAC, Trends Anal. Chem., 2014, 61, 49–53 CrossRef CAS.
- X. Yang, J. Li, T. Liang, C. Ma, Y. Zhang, H. Chen, N. Hanagata, H. Su and M. Xu, Nanoscale, 2014, 6, 10126–10133 RSC.
- A. Jäger-Waldau, M. C. Lux-Steiner, G. Jäger-Waldau and E. Bucher, Appl. Surf. Sci., 1993, 70, 731–736 CrossRef.
- Y. Zhou, J. Dong and H. Li, RSC Adv., 2015, 5, 66852–66860 RSC.
- G. Kline, K. Kam, D. Canfield and B. A. Parkinson, Sol. Energy Mater., 1981, 4, 301–308 CrossRef CAS.
- P. C. Yen, H. P. Hsu, Y. T. Liu, Y. S. Huang and K. K. Tiong, J. Phys.: Condens. Matter, 2004, 16, 6995–7005 CrossRef CAS.
- P. C. Yen, Y. S. Huang and K. K. Tiong, J. Phys.: Condens. Matter, 2004, 16, 2171–2180 CrossRef CAS.
- Y. Guo, L. Zhang, S. Zhang, Y. Yang, X. Chen and M. Zhang, Biosens. Bioelectron., 2015, 63, 61–71 CrossRef CAS PubMed.
- H. Gonçalves, P. A. S. Jorge, J. R. A. Fernandes and J. C. G. Esteves da Silva, Sens. Actuators, B, 2010, 145, 702–707 CrossRef.
Footnote |
| † Electronic supplementary information (ESI) available. See DOI: 10.1039/c5ra27327g |
| This journal is © The Royal Society of Chemistry 2016 |

