
Sodium ion battery anode properties of designed graphene-layers synthesized from polycyclic aromatic hydrocarbons†
Taichi Hayakawa,
Yosuke Ishii* and
Shinji Kawasaki*
Department of Materials Science and Engineering, Nagoya Institute of Technology, Gokiso-cho, Showa-ku, Nagoya 466-8555, Japan. E-mail: ishii.yosuke@nitech.ac.jp; kawasaki.shinji@nitech.ac.jp; Fax: +81-52-735-5221; Tel: +81-52-735-5221
First published on 19th February 2016
Abstract
Structurally designed graphene-layers were synthesized by fusing two kinds of poly-aromatic hydro carbons: coronene and pentacene. Na ion battery anode properties were investigated for the obtained amorphous carbons. It was found that both coronene and pentacene based materials had high reversible capacities (ca. 100 mA h g−1). Na ion storage mechanisms for the two carbon samples were investigated by ex situ XRD and NMR measurements.
Introduction
Owing to their high energy densities, lithium ion batteries (LIBs) have been widely used as energy storage devices for several small electronic devices such as mobile phones, laptop computers and so on since they entered the market in 1991.1 Recently it has also become possible to use LIBs for large machines (e.g. electric vehicles).2 For such purpose, we need much more lithium metal resources. However, since the geographical distribution of lithium resources is limited, we face a cost problem. Sodium ion batteries (SIBs) are of great interest to realize lithium-free energy storage.3–6 Although, graphite has been widely used as anode material for LIBs, graphite anode cannot be used for SIBs. This is because low stage graphite intercalation compounds are hardly ever produced for sodium, which is probably due to the difference in ionic size and ionization potential between lithium and sodium.7–9 So far, SIB negative electrode properties of several kinds of carbon materials have been studied. It was reported that some kinds of hard carbons can reversibly adsorb and desorb Na ions.10–20 However, the detailed mechanism of Na ion storage in the hard carbons has not been clarified yet, mainly because the complicated structures of such hard carbons prevent their structural investigation. Therefore, in order to investigate the storage mechanism, we need amorphous carbons whose structural units have specific structural features. Here, we prepared amorphous carbon materials prepared by fusing treatments of two kinds of polycyclic aromatic hydrocarbons (PAHs): coronene and pentacene. As shown in Fig. 1, by using PAHs as starting materials, we can control the structure of graphene-like molecules which are structural units of the amorphous carbons produced by thermal polymerization of PAHs.21–24 Using the structure controlled carbon samples, we performed ex situ X-ray diffraction (XRD) and nuclear magnetic resonance (NMR) measurements to investigate the sodium ion intercalation mechanism. | ||
| Fig. 1 Thermal polymerization reaction of pentacene and coronene molecules. | ||
Experimental
We purchased a reagent-grade coronene and pentacene powder samples. The powder sample of 30 mg was sealed in an evacuated silica glass tube, and heat-treated at several temperatures (400, 500, 600, 700 °C) for 15 h.Mass spectrum measurements were conducted using a laser desorption/ionization time-of-flight (LDI-TOF) mass spectrometer (JEOL JMS-S3000) equipped with a 349 nm-wavelength UV laser as ionization source. The mass spectrometer was operated in positive-ion detection mode. The m/z scales of obtained spectra were externally calibrated with the decomposition peak positions of polyethylene glycol (PEG).
The XRD measurements of the purified samples were performed on a Rigaku Miniflex diffractometer. The incident X-ray wavelength was Cu Kα (λ = 0.154 nm). We also observed photoluminescence spectra of the purified samples using JASCO FP8600 spectrometer at room temperature. The excitation light used in the present study was xenon lamp monochromatic light (λ = 350 nm).
For electrochemical measurements of fused PAH samples, we used poly-vinylidene difluoride (PVDF) as a binder (fused PAH sample![[thin space (1/6-em)]](https://www.rsc.org/images/entities/char_2009.gif) :PVDF = 9:1). We fabricated a half-cell where sodium metal block was used as counter electrode. Cathode and anode are separated by porous-polymer sheet (Celgard #2500). 0.5 M NaClO4 dissolved in 1:1 vol% ethylene carbonate and diethyl carbonate mixture was used as an electrolyte. Charge/discharge measurements at a constant current were performed on a Toyo System TOSCAT-3200 galvanostat.
:PVDF = 9:1). We fabricated a half-cell where sodium metal block was used as counter electrode. Cathode and anode are separated by porous-polymer sheet (Celgard #2500). 0.5 M NaClO4 dissolved in 1:1 vol% ethylene carbonate and diethyl carbonate mixture was used as an electrolyte. Charge/discharge measurements at a constant current were performed on a Toyo System TOSCAT-3200 galvanostat.
In order to know the Na ion storage sites, we performed ex situ 23Na solid state NMR measurements of the fused PAH samples discharged (Na ion inserted) at several discharge potentials. We stopped the discharge experiment at a specific potential and took out the sample from the test cell in an Ar dry box. To remove Na ions included in electrolyte, the sample was washed by diethyl carbonate and dried in a vacuum room. A mixture of the dried sample and KBr powder sample was inserted in a ZrO2 rotor. NMR measurements were performed on a JNM-ECA600II (600 MHz, 14.1 T) with rotating rate of 6 kHz. Chemical shift was calibrated by 1 M NaCl aqueous solution.
Results and discussion
Fig. 2(a) and (b) show LDI-TOF-mass spectra of fused PAH samples obtained by heat-treatments at 600 °C of pentacene and coronene, respectively. For convenience, the pentacene and coronene samples heat-treated at 600 °C are abbreviated as FP600 and FC600, respectively. As demonstrated in our previous reports, it was confirmed by mass spectroscopy measurements that fused pentacenes can be obtained by the present heat-treatment.23,24 Peak bands observed around m/z = 550, 810, 1090, and 1360 are attributed to pentacene-dimer, trimer, tetramer, and pentamer, respectively. We should note that the obtained sample seems contain some amount of incompletely dehydrogenated polymers. The details were discussed in our previous paper.24 Fig. 2(b) shows that fused coronenes can also be obtained. Sharp peaks observed at m/z = 596, 892, 1188, and 1484 can be attributed to coronene-dimer, trimer, tetramer, and pentamer, respectively. The peak positions were good agreement with the positions of ideally polymerized coronene as shown in Fig. 1 (C24nH8n+4, n = 1, 2, 3…). For coronene, significant change was not observed in mass spectrum for the samples treated at temperatures higher than 600 °C (see Fig. S1†). This does not indicate that polymerization of PAH does not proceed at higher temperature. Rather, it is probably because ionization of higher order polymers is not easy. Therefore, it should be noted that the intensities of mass spectrum do not correspond to the compositions of the polymers especially for higher order polymers. | ||
| Fig. 2 LDI-TOF-mass spectra of obtained (a) FP600 and (b) FC600. | ||
As shown in Fig. 2, the obtained fused PAH samples are mixtures of several kinds of polymers of PAHs. However, in the case of coronene, we managed to obtain a single phase of dicoronylenes (coronene dimers) using the following procedure. After first heat-treatment at 500 °C, we transferred the sample in one side of a sealed glass tube and heated the sample side at 400 °C with keeping the other side at the room temperature (25 °C). Coronene monomers which are not fused by the first heat-treatment at 500 °C sublimed and were deposited at the cold side. The glass tube was then broken open in an Ar dry box and sublimed coronene monomers were removed. We sealed the remained sample in a glass tube again and heated the sample side at 600 °C. By this treatment, dicoronylenes are gathered at the cold side. The mass spectrum and XRD pattern of the obtained dicoronylene sample are shown in Fig. S2 and S3(a),† respectively. The observed XRD pattern is in a good agreement with the reported pattern of di-coronene crystal (Fig. S3(b)†).25 Since dicoronylene crystal emits very bright red light under low energy UV irradiation, it has attracted much interest. So far, the practical use of dicoronylene crystal was very difficult because complicated organic chemical procedure was required to obtain dicoronylene crystal.26,27 However, it was shown in the present study that dicoronylene crystal can be obtained just by a two-step heat-treatment. Fig. S4† shows the photo-luminescence spectrum of the obtained dicoronylene crystal. Compared to the PL spectrum of coronene crystal, the peak position of dicoronylene crystal shifted toward higher wave length side.
Next, we discuss the Na ion battery electrode properties of FP600 and FC600. It was found that both FP600 and FC600 can adsorb and desorb Na ions reversibly, although large irreversible capacities were observed in the 1st cycle. As shown in Fig. 3, discharge plateaus at around 0.8 V were observed for both samples. The plateau corresponds to the irreversible-decomposition reactions of electrolyte on carbon sample surface or defects sites, namely solid-electrolyte interphase (SEI) formation. However, we could not perform quantitative discussion for the defect sites from the structural analysis data obtained in this study. The reversible capacities of FP600 and FC600 after 2nd cycle are almost the same (ca. 100 mA h g−1). However, the shapes of charge–discharge curves of the two samples are quite different. Upon examining the 2nd cycle discharge curves of the two samples, a slope change at about 0.8 V was observed for FP600, while for FC600 the change was observed at about 0.3 V. This indicates that compared to FC600, Na ion insertion into FP600 occurs at higher potentials. Such potential difference should be due to the difference of Na ion storage mechanism. Three major storage systems should be considered for carbon samples derived from PAHs: (1) intercalation between graphene layers, (2) formation of ion clusters in pores, (3) grafting on the edge of carbon six-member ring. It is known that grafting occurs for the carbon atoms bonding with hydrogen atoms. Therefore, we should analyse hydrogen contents of FP600 and FC600. As shown in table, since H/C of FP600 is almost the same as that of FC600, which means that other storage sites might lead to the difference between the shapes of discharge curves of two samples.
 | ||
| Fig. 3 Galvanostatic charge–discharge curves of (A) FP600 and (B) FC600. In the measurements, current density was set to 25 mA g−1. | ||
In order to investigate Na ion intercalation between graphene layers, we performed ex situ XRD measurements for the discharged samples at specific discharge potentials. As shown in Fig. 4, since no sharp peaks were observed for the two samples before discharging, we can treat them as a kind of amorphous carbons having low crystallinity. The broad peaks observed at around 26°, which correspond to 002 diffraction of graphite crystal, gives information of interlayer distance of graphene-like structure. Although both peaks of the two samples are broad, the peak of FC600 is rather sharper and observed at higher angle side than that of FP600. In this paper we will refer to the d-value calculated from the peak position of the broad peak at around 26° as d002. The d002 value of FC600 is close to that of graphite crystal. On the other hand, since the d002 of FP600 is quite large, the interaction between graphene layers should be weak. The XRD patterns of the two samples change with decreasing discharge potential. In the case of FC600, the peak position of 002 diffraction peak did not change with potential. However, it was shown that the peak intensity drastically decreases from 0.3 V. It indicates that some kind of disorder is induced in the layer structure at 0.3 V. The disorder is probably caused by Na ion intercalation between graphene layers. On the other hand, in the case of FP600, the peak position of 002 diffraction shifted toward lower angle side with decreasing potential. As shown in Fig. 4, slight shift was observed at 0.5 V and great shift was observed at 0.3 V and 0.1 V. These peak shifts of course indicate the enlarging of the distances of graphene-like structure. Although the peak intensity decreased with discharge potential for both FP600 and FC600, the degree of the decrease of FP600 is much smaller than that of FC600. The polymerization pattern of pentacenes should be quite different from that of coronene molecules. As we previously reported, pentacenes polymerize into ribbon-like structures and the formed rectangular graphene layers might be stacked.24 The interaction between layers is not very strong and the mean interlayer distance is quite large. Therefore, Na ions can be inserted into FP600 at relatively high potential without destroying the layer structure. On the other hand, in the case of coronene, plane-like polymerization as pentacenes do is not possible because the fusing points are restricted. Dimer of coronenes has a gourd-like shape as shown in Fig. 1. Therefore, the stacked layers of polymerized coronenes do not have the structural flexibility needed for in-plane distortion. This would be the reason why FC600 loses the layer stacking structure by Na ion insertion.
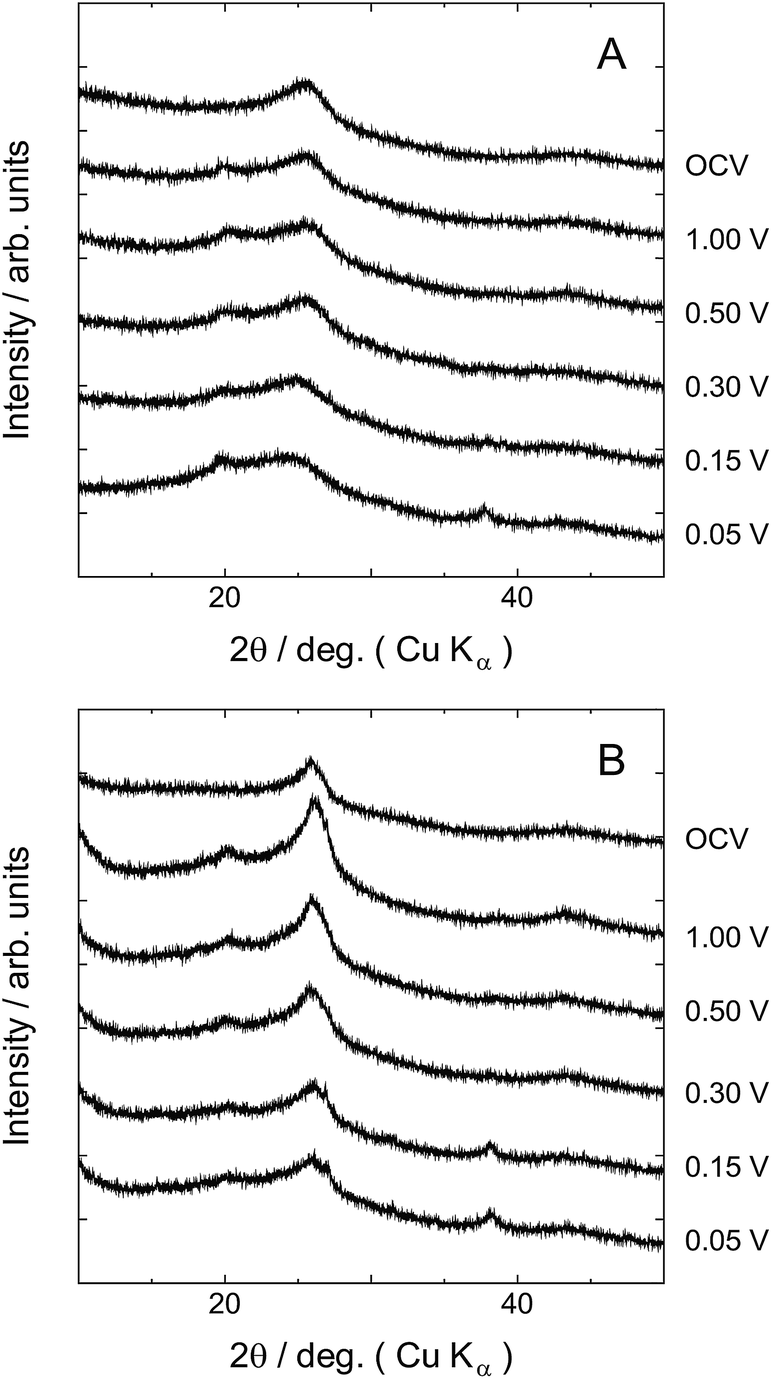 | ||
| Fig. 4 Ex situ XRD patterns of (A) FP600 and (B) FC600. | ||
We also performed ex situ NMR measurements for the discharged samples so as to know electronic states of the stored Na ions. As shown in Fig. 5A(a) and B(a), similar spectra were observed for FP600 and FC600 samples discharged to 1 V. Sharp peaks observed at about −8 ppm on both spectra are signals from NaBr included in KBr matrix. We can use this signal as an internal standard for chemical shift. Besides this sharp peak, very broad peaks having peak position of −3 ppm were observed. The broad peak should correspond to Na ions included in SEIs. For the sample discharged to 0.001 V, we observed very different NMR patterns for FP600 and FC600 (see Fig. 5A(b) and B(b)). A broad peak at about −2 ppm was observed for FP600 while the peak position of FC600 is about 10 ppm higher. It should be noted that no peaks corresponding to Na metal or Na ion clusters were observed in the higher chemical shift region for any of the two samples. The reason why the chemical shift of Na ion in FC600 is 10 ppm higher than that of FP600 would be explained as follows. The difference in chemical shifts would be due to difference of interaction between Na ions and host carbons. The interaction for Na ions into graphene layers of FP600 should be weak, because the interlayer distance is very large. By contrast, we can assume a stronger interaction between Na ions and host graphene layers of FC600 that has smaller interlayer distance. In this case, some content of charge transfer from host carbon to Na ions should occur. This would be the reason for higher chemical shift of FC600. Next, we should point out another possibility for the chemical shift difference: Na ion clustering storage. As shown in Table 1, although FC600 has a much smaller d002 compared to FP600, its density is considerably smaller than that of FP600. This indicates that FC600 has a larger number of closed pores than FP600. If Na ions are stored in such pores as clusters, NMR signal should be observed in higher chemical shift region. In that case, the difference in pore structures can explain the observed chemical shift. However, it is known that the chemical shift for clustering storage is usually much higher than the observed chemical shift (ca. 10 ppm). Therefore, it is reasonable that the different chemical interaction between individual Na ions and host carbons would lead to the difference in chemical shift. For a more detailed discussion, further experimental data concerning the electronic states of the stored Na ions (e.g. XAFS data) are required.
 | ||
| Fig. 5 Ex situ NMR spectra of (A) FP600 and (B) FC600, measured at (a) 1 V and (b) 0.001 V. | ||
| H/C ratio | Density (g cm−3) | Surface area (m2 g−1) | d002 (nm) | |
|---|---|---|---|---|
| FP600 | 0.302 | 0.84 | 10 | 0.344 |
| FC600 | 0.315 | 0.67 | 02 | 0.338 |
Conclusions
In this paper, two types of carbon materials having different graphene layer structure were successfully prepared by the simple thermal dehydrogenation–polymerization reaction of pentacene and coronene molecules. Although reversible Na-ion storage capacities were of almost the same value (ca. 100 mA h g−1), the shape of charge–discharge profiles was quite different between FP600 and FC600. In order to discuss the detailed ion storage mechanisms, ex situ XRD and NMR measurements were performed in this study. The results of XRD measurements showed that Na intercalation reaction with enlarging of the adjacent graphene layers mainly occurs below 0.3 V. We also found that the intercalation voltage was highly changed with the interlayer distance of adjacent graphene layers: the intercalation voltage of the FP600, which has larger d002 than FC600, was much higher than that of the FC600 sample.Acknowledgements
The authors thank to Yashima Environment Technology Foundation, Toukai Foundation for Technology, TEPCO Memorial Foundation, Tatematsu Foundation and JSPS KAKENHI Grant number 26410238 for their financial support to the present study.References
- J. M. Tarascon and M. Armand, Nature, 2001, 414, 359–367 CrossRef CAS PubMed.
- E. M. Erickson, C. Ghanty and D. Aurbach, J. Phys. Chem. Lett., 2014, 5, 3313–3324 CrossRef CAS PubMed.
- V. Palomares, P. Serras, I. Villaluenga, K. B. Hueso, J. Carretero-Gonzalez and T. Rojo, Energy Environ. Sci., 2012, 5, 5884–5901 CAS.
- S.-W. Kim, D.-H. Seo, X. Ma, G. Ceder and K. Kang, Adv. Energy Mater., 2012, 2, 710–721 CrossRef CAS.
- N. Yabuuchi, K. Kubota, M. Dahbi and S. Komaba, Chem. Rev., 2014, 114, 11636–11682 CrossRef CAS PubMed.
- T. Matsushita, Y. Ishii and S. Kawasaki, Mater. Express, 2013, 3, 30–36 CrossRef CAS.
- M. Kawaguchi, K. Ohnishi, K. Yamada and Y. Muramatsu, J. Electrochem. Soc., 2010, 157, P13–P17 CrossRef CAS.
- K. Yamada, H. Ishikawa, C. Kamiwaki and M. Kawaguchi, Electrochemistry, 2015, 83, 452–458 CrossRef CAS.
- W. Wan and H. Wang, Int. J. Electrochem. Sci., 2015, 10, 3177–3184 CAS.
- D. A. Stevens and J. R. Dahn, J. Electrochem. Soc., 2000, 147, 1271–1273 CrossRef CAS.
- P. Thomas and D. Billaud, Electrochim. Acta, 2002, 47, 3303–3307 CrossRef CAS.
- R. Alcántara, P. Lavela, G. F. Ortiz and J. L. Tirado, Electrochem. Solid-State Lett., 2005, 8, A222–A225 CrossRef.
- S. Komaba, W. Murata, T. Ishikawa, N. Yabuuchi, T. Ozeki, T. Nakayama, A. Ogata, K. Gotoh and K. Fujiwara, Adv. Funct. Mater., 2011, 21, 3859–3867 CrossRef CAS.
- K. Tang, L. Fu, R. J. White, L. Yu, M.-M. Titirici, M. Antonietti and J. Maier, Adv. Energy Mater., 2012, 2, 873–877 CrossRef CAS.
- M. Dahbi, N. Yabuuchi, K. Kubota, K. Tokiwa and S. Komaba, Phys. Chem. Chem. Phys., 2014, 16, 15007–15028 RSC.
- W. Luo, C. Bommier, Z. Jian, X. Li, R. Carter, S. Vail, Y. Lu, J.-J. Lee and X. Ji, ACS Appl. Mater. Interfaces, 2015, 7, 2626–2631 CAS.
- Y. Li, S. Xu, X. Wu, J. Yu, Y. Wang, Y.-S. Hu, H. Li, L. Chen and X. Huang, J. Mater. Chem. A, 2015, 3, 71–77 CAS.
- T. Chen, Y. Liu, L. Pan, T. Lu, Y. Yao, Z. Sun, D. H. C. Chua and Q. Chen, J. Mater. Chem. A, 2014, 2, 4117–4121 CAS.
- V. G. Pol, E. Lee, D. Zhou, F. Dogan, J. M. Calderon-Moreno and C. S. Johnson, Electrochim. Acta, 2014, 127, 61–67 CrossRef CAS.
- K.-l. Hong, L. Qie, R. Zeng, Z.-q. Yi, W. Zhang, D. Wang, W. Yin, C. Wu, Q.-j. Fan, W.-x. Zhang and Y.-h. Huang, J. Mater. Chem. A, 2014, 2, 12733–12738 CAS.
- L. B. Roberson, J. Kowalik, L. M. Tolbert, C. Kloc, R. Zeis, X. Chi, R. Fleming and C. Wilkins, J. Am. Chem. Soc., 2005, 127, 3069–3075 CrossRef CAS PubMed.
- J. Cai, P. Ruffieux, R. Jaafar, M. Bieri, T. Braun, S. Blankenburg, M. Muoth, A. P. Seitsonen, M. Saleh, X. Feng, K. Mullen and R. Fasel, Nature, 2010, 466, 470–473 CrossRef CAS PubMed.
- Y. Ishii, T. Sakashita, S. Kawasaki, H. Kato and M. Takatori, Mater. Express, 2011, 1, 36–42 CrossRef CAS.
- Y. Ishii, H. Song, H. Kato, M. Takatori and S. Kawasaki, Nanoscale, 2012, 4, 6553–6561 RSC.
- R. Goddard, M. W. Haenel, W. C. Herndon, C. Krueger and M. Zander, J. Am. Chem. Soc., 1995, 117, 30–41 CrossRef CAS.
- M. Zander and W. Franke, Chem. Ber., 1958, 91, 2794–2797 CrossRef CAS.
- H. J. Lempka, S. Obenland and W. Schmidt, Chem. Phys., 1985, 96, 349–360 CrossRef CAS.
Footnote |
| † Electronic supplementary information (ESI) available. See DOI: 10.1039/c6ra00955g |
| This journal is © The Royal Society of Chemistry 2016 |