DOI:
10.1039/C6RA01079B
(Paper)
RSC Adv., 2016,
6, 37591-37599
DNA induced aggregation of stem bromelain; a mechanistic insight
Received
13th January 2016
, Accepted 8th April 2016
First published on 11th April 2016
Abstract
Negatively charged species such as nucleic acids have commonly been found to be associated with the proteinaceous deposits in the tissues of patients with amyloid diseases. Numerous studies have demonstrated that various environmental and intracellular factors affect the fibrillation property of proteins, by accelerating the process of assembly. Thus in the present study, the effect of calf thymus DNA (CT-DNA) on stem bromelain, a proteolytic phytoprotein, is investigated at pH 2.0, using multiple approaches that include turbidity measurements, Rayleigh light scattering, dye binding assay (ThT and ANS), far-UV circular dichroism, dynamic light scattering fluorescence microscopy and transmission electron microscopy. Large sized β-sheet aggregates of SB are found in the presence of CT-DNA at pH 2.0. The propensity for aggregation concomitantly increases with increasing concentration of CT-DNA (0–100 μM) and levels off at higher concentration of CT-DNA (beyond 100 μM). Isothermal titration calorimetric results confirmed that an electrostatic interaction between positively charged SB at pH 2.0 and the negatively charged phosphate group of CT-DNA is the probable mechanism behind aggregate formation. However, the hydrophobic interaction between CT-DNA and SB cannot be neglected. The survival of aggregates even after treatment with DNase indicates that intact CT-DNA is not necessarily required for SB aggregation.
1 Introduction
Proteins misfolding and subsequent aggregation are a hallmark of a number of clinical disorders including Alzheimer's, Parkinson's, Huntington's disease, type II diabetes and many others.1,2 Different proteins and peptides generate morphologically similar amyloid fibrils under carefully chosen conditions.3 Generally, a higher aggregation propensity of protein was observed when they are present in a partially folded state produced due to harsh conditions such as low pH, high temperature and moderate concentration of organic solvents.4,5 But, it is not yet clear whether the native state of proteins, a partially folded or totally folded state leads to amyloid fibril development. However, it is believed that exposure of hydrophobic patches may promote the intermolecular interactions and consequently conformational changes may be responsible for aggregation. Further, structurally different aggregates, amorphous aggregates or amyloid fibrils, are formed as a result of different aggregation pathway acquired under different conditions due to different conformational changes.6–8 In spite of the dissimilarity in conformation of the proteins, all amyloid fibrils share common morphological features.9,10 It has been observed that a large number of intracellular and extracellular factors affect the fibrillation property of proteins. Negatively charged nucleic acid has been found associated with proteinaceous deposits in the tissue of patients of amyloid disease. Though enormous investigation and comprehensive details describes the mechanism of protein aggregation, but still there is no real cure for such type of devastating diseases.
Stem bromelain [EC 3.4.22.32], a proteolytic enzymes obtained from Ananas comosus is a widely accepted phytotherapeutical drug member of the bromelain family.11 Like other cysteine proteases stem bromelain belongs to α + β protein class.12 It is widely accepted therapeutic drug due to its broad medicinal application such as anti-inflammatory effects for the treatment of angina pectoris, bronchitis and sinusitis. It also helps in adsorption of drugs principally antibiotics, analgesic and anti-tuberculosis activity.13 It has its application in oncology, odontology and a wide range of sports injuries due to rare chances of side effects. Anti-metastasis and anti-inflammatory activities of SB are independent of its proteolytic activity, however pleiotrophic effects in stem bromelain originate from its unusual ability to traverse membranes.14,15 It has been reported that stem bromelain exhibits partially folded state at pH 2.0, characterized by disrupted tertiary contacts and exposed hydrophobic surfaces.16 These partially folded intermediates are more prone to aggregate as they have less ordered conformation and more exposed hydrophobic surfaces.17
DNA interacts with various compounds like metal ions, either by intercalation or groove binding.18 Besides, nucleic acids also interact with different amyloid peptides (like prions, beta amyloid and tau protein) and thus modulate their aggregation behavior.19 In many cases they generally stimulate fibrillation process and induce structural changes from alpha helical to beta sheet isoform by forming stable complexes. Various studies revealed that nucleic acid act as allosteric effectors of PrP amyloidogenesis or act as an efficient polyanionic scaffold catalyst to misfold the cellular PrP into a scrapie-like conformer.20–24 In addition, RNA molecules may have a stimulatory role in the pathogenesis of prion proteins.25 However, another finding revealed conformational switch of engineered RepA-WH1, a bacterial protein that show some analogies to nucleic acid promoted amyloidosis.26 DNA also leads to aggregation of superoxide dismutase that is responsible for pathogenesis of amyotrophic lateral sclerosis under acidic conditions.27 Since, conditions that are required to induce aggregation vary with protein to protein, we use an appropriate pH condition based on proteins pI. In the present study, we attempted to monitor the effect of calf thymus DNA on SB at pH 2.0, by using a combination of various spectroscopic and microscopic techniques. Moreover, we demonstrated that CT-DNA can induce aggregation in SB SB with fibrillar morphology.
2 Materials and methods
2.1 Materials
Stem bromelain (SB) EC 3.4.22.32 lot no. B4882, Calf thymus DNA (CT-DNA), ANS (1-anilino-8-naphthalene sulfonate) and ThT (thioflavin T) were purchased from Sigma-Aldrich Chemical Co., St. Louis, MO, USA. All other reagents used were of analytical grade.
2.2 Sample preparation
To avoid complications due to autocatalysis, stem bromelain was dissolved in 20 mM sodium phosphate buffer (pH 7.4) containing sodium tetrathionate (5 mM) and subjected to size-exclusion chromatography followed by dialysis.28 Buffer (pH 2.0) was prepared with Gly–HCl and filtered with 0.45 μM Millipore Millex-HV PDVF filter. The concentration of protein and CT-DNA were determined spectrophotometrically using specific extinction coefficient E280 nm1% = 20.1 on Perkin Elmer Lambda 25 UV-Visible spectrophotometer.29 The molecular mass of protein was taken as 23![[thin space (1/6-em)]](https://www.rsc.org/images/entities/char_2009.gif) 800 Da.30 CT-DNA stock solution was prepared in 20 mM Gly–HCl buffer pH 2.0. To check the purity of CT-DNA solution absorbance ratio A260/A280 was recorded. No further purification was required since the attenuation ratio was between 1.8 and 1.9. DNA concentration was determined on Perkin Elmer Lambda 25 UV-Visible spectrophotometer using average molar extinction coefficient value of 6600 M−1 cm−1 of a single nucleotide at 260 nm.31 All solutions were filtered through 0.45 μm syringe filter.
800 Da.30 CT-DNA stock solution was prepared in 20 mM Gly–HCl buffer pH 2.0. To check the purity of CT-DNA solution absorbance ratio A260/A280 was recorded. No further purification was required since the attenuation ratio was between 1.8 and 1.9. DNA concentration was determined on Perkin Elmer Lambda 25 UV-Visible spectrophotometer using average molar extinction coefficient value of 6600 M−1 cm−1 of a single nucleotide at 260 nm.31 All solutions were filtered through 0.45 μm syringe filter.
2.3 pH determination
pH was measured by Mettler Toledo Seven Easy pH meter (model S20) using Expert “Pro3 in 1” type electrode. The least count of the pH meter was 0.01 pH unit.
2.4 Protein charge determination
The charge on stem bromelain at pH 2.0 was calculated using the program protein calculator v3.4.
2.5 Turbidity measurements
For turbidity measurements, stem bromelain (5 μM) in absence and presence of varying concentration of CT-DNA (0–120 μM) were monitored by UV absorbance at 350 nm using JascoV-660 double beam UV-Vis spectrophotometer in 1 cm cuvette path length. Prior to turbidity measurements, all sampled were incubated overnight.
2.6 Rayleigh light scattering (RLS) measurements
Rayleigh light scattering of SB (5 μM) in the absence and presence of varying concentration of CT-DNA (0–120 μM) were carried out using a Shimadzu RF 5301 PC fluorescence spectrofluorometer equipped with a water circulator (Julabo Eyela) at 25 °C. Protein samples were excited at 350 nm and spectra were recorded from 300 to 400 nm. The DNA samples without protein were considered as the control. All the samples were incubated for 24 h prior to measurements.
2.7 ThT fluorescence spectroscopic measurements
Thioflavin T (ThT) was dissolved in distilled water, filtered and then its concentration was determined using a molar extinction coefficient of E412 nm = 36![[thin space (1/6-em)]](https://www.rsc.org/images/entities/char_2009.gif) 000 M−1 cm−1 at 412 nm.32 Protein samples (5 μM) in absence and presence of CT-DNA (0–100 μM) were incubated in 1
000 M−1 cm−1 at 412 nm.32 Protein samples (5 μM) in absence and presence of CT-DNA (0–100 μM) were incubated in 1![[thin space (1/6-em)]](https://www.rsc.org/images/entities/char_2009.gif) :
:![[thin space (1/6-em)]](https://www.rsc.org/images/entities/char_2009.gif) 2 molar ratio of protein to ThT for 30 min at 25 °C in dark. The bound ThT was excited at 440 nm and spectra were recorded from 450 to 600 nm. The excitation and emission slit widths were fixed at 5 nm. Proper controls were taken in consideration.
2 molar ratio of protein to ThT for 30 min at 25 °C in dark. The bound ThT was excited at 440 nm and spectra were recorded from 450 to 600 nm. The excitation and emission slit widths were fixed at 5 nm. Proper controls were taken in consideration.
2.8 ANS fluorescence assay
A stock solution of ANS was prepared in distilled water and its concentration was determined using molar extinction coefficient, EM = 5000 M−1 cm−1 at 350 nm.33 For ANS binding experiment, SB (5 μM) in absence and presence of varying concentration of CT-DNA (0–100 μM) were incubated at pH 2.0 for 24 h. Further these samples were incubated with 20 fold molar excess of ANS for 30 min in dark. The excitation wavelength for ANS fluorescence was set at 380 nm and the emission spectra were taken in the range of 400–600 nm. Both the excitation and emission slits were set at 5 nm.
2.9 Circular dichroism spectroscopic measurements
Circular dichroic (CD) measurements were performed to monitor secondary structural changes of SB in the presence of CT-DNA. JASCO spectropolarimeter (J-815) was used for circular dichroic measurements using quartz cell with 0.1 cm path length. The temperature was controlled using Peltier Thermostat with Multitech water circulator and instrument was calibrated with D-10-camphorsulfonic acid. SB (5 μM) was taken for all far UV CD measurements. Spectra were obtained in the range of 190–250 nm and each spectrum was average of two scans. Scan speed of 100 nm min−1, data pitch 1 nm and response time of 1 s were used for spectra collection. All spectra were smoothed by the Savitzky–Golay method with 25 convolution width. Prior to the measurements, all the samples were incubated for 24 h. The results were expressed as MRE (Mean Residual Ellipticity) in degree cm2 per dmol and MRE was calculated using the following equation.34
where, θobs is the observed ellipticity in millidegree, n is the number of amino acid residues, l is the length of light path in cm, the cell in cm and Cp is the molar concentration of protein. The α-helical content was calculated using the following equation.
where MRE208 nm corresponds to the observed MRE value.
2.10 Dynamic light scattering measurements
The aggregation behavior changes at different CT-DNA concentration were determined by DLS measurements. DLS experiments were performed on a Dynamic Pro-TC-04 dynamic light scattering instrument (Protein solutions, Wyatt technology, Santa Barbara, CA) equipped with a temperature controlled microsampler that monitors the scattered light at 90 °C to the excitation. SB samples (40 μM) were incubated with increasing concentration of CT-DNA over 24 h at pH 2.0. The protein to CT-DNA ratio (1![[thin space (1/6-em)]](https://www.rsc.org/images/entities/char_2009.gif) :
:![[thin space (1/6-em)]](https://www.rsc.org/images/entities/char_2009.gif) 20) was unaltered throughout the DLS measurements. Prior to DLS measurements, all samples were filtered through a 0.22 μM pore size microfilter (Whatman International, Maidstone UK). At least 20 measurements were performed for each sample. The data were analyzed by Dynamic 6.10.0.10 software at optimized resolution. The hydrodynamic radii (Rh) and polydispersity (Pd) were determined using Stokes–Einstein relationship.
20) was unaltered throughout the DLS measurements. Prior to DLS measurements, all samples were filtered through a 0.22 μM pore size microfilter (Whatman International, Maidstone UK). At least 20 measurements were performed for each sample. The data were analyzed by Dynamic 6.10.0.10 software at optimized resolution. The hydrodynamic radii (Rh) and polydispersity (Pd) were determined using Stokes–Einstein relationship.
where Rh is the hydrodynamic radius, k is the Boltzmann constant, T is the absolute temperature, η is solvent viscosity and D, is the diffusion coefficient.35
2.11 Fluorescence microscopic measurements
Amyloid species obtained upon incubation of SB (5 μM) at pH 2.0 in presence of CT DNA (100 μM) were assessed by using ThT as an amyloid specific fluorescence probe. Samples were incubated in 1![[thin space (1/6-em)]](https://www.rsc.org/images/entities/char_2009.gif) :
:![[thin space (1/6-em)]](https://www.rsc.org/images/entities/char_2009.gif) 2 molar ratio of protein to ThT for 30 min at 25 °C in dark and then placed on a glass slide and covered with a cover slip. For ThT excitation and emission, Z stacking was done in the FITC channel. Images were acquired using a Carl Zeiss imager equipped with 20×, 40× or 63× (oil) objective magnification. Final images were captured with American digital camera attached with microscope.
2 molar ratio of protein to ThT for 30 min at 25 °C in dark and then placed on a glass slide and covered with a cover slip. For ThT excitation and emission, Z stacking was done in the FITC channel. Images were acquired using a Carl Zeiss imager equipped with 20×, 40× or 63× (oil) objective magnification. Final images were captured with American digital camera attached with microscope.
2.12 Transmission electron microscopic measurements
Transmission electron micrograph of SB (5 μM) in presence of CT-DNA (100 μM) was collected on JEOL 2100F transmission electron microscope (TEM) operating at an accelerating voltage of 200 kV. Protein sample incubated with different concentrations of DNA was applied to copper grids (200 mesh) covered by carbon-coated formvar film. Excess of fluid was removed after 2 min, and then negatively stained with 2% (w/v) uranyl acetate. The samples on grids then were air-dried and viewed under electron microscope.
2.13 Isothermal titration calorimetric measurements
The binding energetic of SB and CT-DNA was measured using VP-ITC titration micro-calorimeter from Microcal (Northampton, MA). Before titration experiment, all samples were degassed appropriately on a Thermovac. The sample cell was loaded with SB (25 μM) prepared in buffer of pH 2.0, and the reference cell contained respective buffer. Further, multiple injections of 10 μL of CT-DNA (2.6 mM), prepared in pH 2.0 buffer were injected into sample cell containing SB. Duration of each injection was 20 s with an interval of 180 s between successive injections. Stirring speed and reference power were set to 307 rpm and 16 μcal s−1 respectively. Heat of dilutions for CT-DNA were determined in control experiments, and subtracted from the integrated data before curve fitting. The heat signals obtained from ITC were integrated using Origin 7.0 software supplied by Micro Cal Inc.
3 Results and discussion
3.1 Net charge on stem bromelain
The total charge at pH 2.0 on stem bromelain was found to be +22.9 as determined by Protein Calculator v3.4. The nature of charge agrees well with the result expected as an outcome of the fact that below its pI, SB acquires positive charges all other protein possess.
3.2 Turbidity measurements
Turbidity of samples at 350 nm is a measure of insoluble aggregates and gives an idea of the extent of aggregation in the solution. The turbidity at 350 nm was monitored in SB samples in absence and presence of CT-DNA. SB at pH 2.0 in presence of increasing concentration of CT-DNA exhibited an exponential increase in turbidity up to 100 μM after which it leveled off (Fig. 1). However, when CT-DNA and SB were incubated individually at pH 2.0, no increase in turbidity was observed. This indicates the formation of SB aggregates in presence of CT-DNA at pH 2.0. The chances of aggregation of CT-DNA and SB alone at pH 2.0 were negated by insignificant turbidity values (Fig. 1). Proteins acquire net positive charge below its pI, that results in electrostatic repulsion between charge moieties, leading to partial unfolding of proteins with exposed hydrophobic patches. In such system aggregation occurs due to neutralization of positive charges. The SB aggregates in presence of CT-DNA at pH 2.0 is due to the interaction of negatively charged phosphate groups of CT-DNA with positively charged partially folded intermediates of SB, which possess exposed hydrophobic residue. Further, on interaction with CT-DNA rate of aggregate formation accelerated which is due to charge neutralization of SB followed by hydrophobic collapse. Aggregation of the protein–CT-DNA complex at pH 2.0 has also been reported for the zinc superoxide dismutase–DNA system.27 However, to further confirm the presence of protein aggregation, Rayleigh scattering measurements were performed.
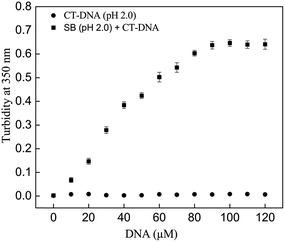 |
| | Fig. 1 Turbidity at 350 nm of SB in absence and presence of varying concentration of CT-DNA (0–120 μM) at pH 2.0. | |
3.3 Rayleigh light scattering measurements
Rayleigh light scattering at 350 nm is another parameter to measure the extent of aggregation due to increase in size and number of aggregates. Thus, the change in light scattering was monitored in SB at pH 2.0 in absence and presence of varying CT-DNA concentration. As can be observed in Fig. 2, steep rise in light scattering intensity was observed up to 100 μM CT-DNA and no further increase was observed thereafter. However, control samples (SB and CT-DNA incubated separately at pH 2.0), revealed insignificant values of light scattering. This indicates that the CT-DNA induces the aggregation of SB at pH 2.0 and thus results further support findings from turbidity measurements.
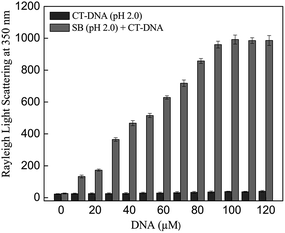 |
| | Fig. 2 Rayleigh light scattering at 350 nm of SB in the absence and presence of varying concentration of CT-DNA (0–120 μM) at pH 2.0. | |
3.4 ThT fluorescence spectroscopic measurements
ThT, a standard fluorescent dye, produces a marked enhancement in fluorescence intensity upon binding to amyloid structures.36 Thus, to predict the nature of aggregates, ThT fluorescence intensity measurements of SB (pH 2.0) were performed in the absence and presence of CT-DNA. The results were in good agreement with the light scattering data (Table 1). Fig. 3A and B represents ThT fluorescence intensity at 485 nm and ThT fluorescence spectra of SB in absence and presence of CT-DNA respectively. The aggregation did not occur in SB at pH 2.0 (control samples). It may be due to the fact that at pH 2.0, protein exists in a partially unfolded conformation with exposed hydrophobic patches and positively charged residues.16 The charged residues may prevent aggregation because of the electrostatic repulsion between positively charge residues of protein molecules. Insignificant binding of ThT was observed with CT-DNA alone at various concentrations (Fig. 3A). This observation is in accordance with the finding that ThT show binding with G-quadruplexes structure of DNA but it has no significant binding with the other forms of DNA i.e. ssDNA, dsDNA and triplex DNA.37,38 Therefore, we have also checked the binding of ThT with CT DNA alone to rule out the ThT fluorescence of CTDNA and ThT complex. However, addition of CT-DNA induces the fibril formation process in SB at pH 2.0. The fibril formation increases with increase in CT-DNA concentration as can be observed from increase in ThT fluorescence intensity (Fig. 3A). This suggests that protein and DNA interact with each other and form amyloid fibrils.
Table 1 Spectroscopic properties of SB at different conditions
| Conditions |
RLS350 nm |
FI485 nm |
Turbidity350 nm |
| SB (pH 2.0) |
25.71 ± 3.2 |
4.26 ± 1.2 |
0.003 ± 0.01 |
| CT-DNA (pH 2.0) |
38.63 ± 2.61 |
27.9 ± 2.1 |
0.009 ± 0.01 |
| SB (pH 2.0) + 50 μM CT-DNA |
515.2 ± 13.25 |
72.3 ± 5.32 |
0.424 ± 0.01 |
| SB (pH 2.0) + 100 μM CT-DNA |
991.3 ± 21.21 |
195.72 ± 6.95 |
0.617 ± 0.03 |
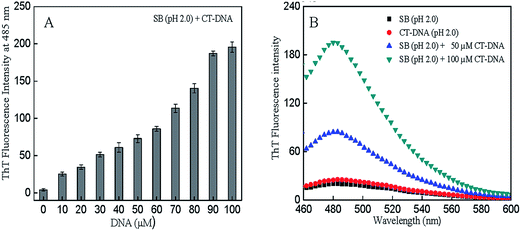 |
| | Fig. 3 (A) ThT fluorescence intensity of SB at 485 nm at varying concentration of CT-DNA (0–100 μM) at pH 2.0. (B) ThT fluorescence spectra of SB (pH 2.0) in the absence and presence of 50 μM and 100 μM CT-DNA. | |
3.5 ANS binding measurements
1-Anilino-naphtalene 8-sulfonic acid (ANS) is a fluorescent dye that is extensively used as a probe for presence of exposed hydrophobic patches or cavities on proteins.39 Presence of aggregates cause greater exposure of hydrophobic patches where large number of ANS molecules could bind and yield significant increase in fluorescence intensity.40 The concentration-dependent effects of CT-DNA on SB at pH 2.0 were evident in the ANS fluorescence assay as shown in Fig. 5A. SB in presence of CT-DNA produced an increase in intensity with concomitant blue shift of 14 nm that indicates formation of aggregates (Fig. 4A and B). Besides, ANS fluorescence spectra obtained for controls do not show any noticeable fluorescence intensity thus negating the chances of aggregation.
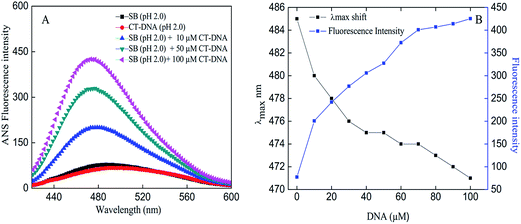 |
| | Fig. 4 (A) ANS fluorescence spectra of SB in absence and presence of varying concentrations of CT-DNA at pH 2.0. (B) Changes in emission maxima (λmax) and fluorescence intensity of SB as a function of varying CT-DNA concentration. | |
3.6 Far-UV CD measurements to monitor secondary structural changes in stem bromelain
The changes in the secondary structure of SB in presence of increasing concentration of CT-DNA were monitored by far-UV CD spectroscopy as it is highly sensitive to ascertain in secondary structure conformation. Native state (pH 7.4) of SB exhibited two minima centered on 208 and 222 nm that are characteristic of alpha helical structure.41,42 The spectra of SB (pH 2.0) showed a decrease in MRE value at respective minima as compared to native state of protein (pH 7.4). This indicates loss of secondary structure at pH 2.0. The percent α-helical content value of SB at pH 7.4 is 14.5% that reduces to 6.12% at pH 2.0. This confers retention of about 42% of the native like structure of SB at pH 2.0 that supports the formation of characteristic PFI as reported earlier.3 With increasing CT-DNA concentration, peak at 208 nm became disappeared and a single minima at 218 nm was obtained, that points toward prominent acquisition of β-sheet structure (Fig. 5). This clearly indicates that these conformations with prominent beta-sheet structure are amyloids in nature as reported in literature.43,44 Furthermore, the β-sheet content increases with increasing concentration of CT-DNA as summarized in Table 2.
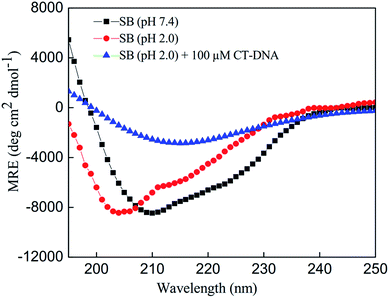 |
| | Fig. 5 Far-UV CD spectra of SB at pH 7.4, and in absence and presence of CT-DNA at pH 2.0. | |
Table 2 Secondary structure properties of SB at different concentration of CT-DNA
| Properties |
pH 7.4 |
10 μM CT-DNA |
50 μM CT-DNA |
100 μM CT-DNA |
| % α |
14.52 |
11.62 |
8.94 |
6.01 |
| % β |
6.51 |
7.83 |
10.63 |
15.30 |
| % RC |
78.97 |
80.55 |
80.43 |
78.69 |
3.7 Dynamic light scattering measurements
The change in hydrodynamic radii of the aggregated species was monitored by DLS as it is capable of unbiased analysis of size distribution of particle.45 It is well known that during amyloid formation the size of protein molecules increases due to complex formation, between additives and protein molecules.46 The Rh of SB at pH 7.4 was found to be 2.3 nm (Fig. 6A). However, slight increase in hydrodynamic radii (3.2 nm) was observed at pH 2.0 (Fig. 6B). This increase in Rh is due to partial unfolding of SB at pH 2.0. When SB was incubated with increasing concentration of CT-DNA at pH 2.0, the Rh was found to increase. However, smaller aggregates were observed at lower concentration of CT-DNA after 24 h of incubation. This indicates the formation of complex between SB and CT-DNA at pH 2.0. In the presence of CT-DNA (50 μM), SB showed existence of different species with hydrodynamic radii ranging from 2.7–175.8 nm, whereas aggregates with hydrodynamic radii of 178.6 nm were observed at 100 μM CT-DNA (Fig. 6C and D). Further, the broadening of DLS peak with polydispersity (a parameter of homogeneity) > 40% in the presence of CT-DNA is attributed to the formation of species of heterogeneous size.35 However, native protein has <15% polydispersity that confirms the existence of protein in homogeneous monomeric population (Table 3).
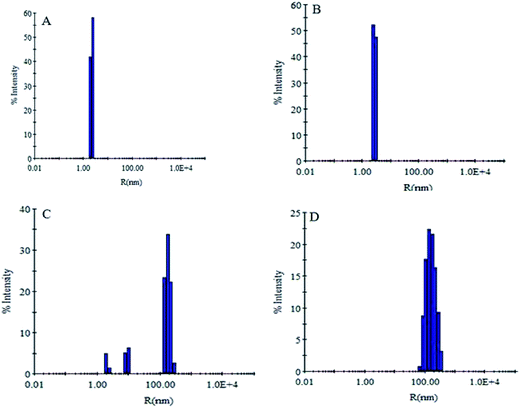 |
| | Fig. 6 Dynamic light scattering measurements in the absence and presence of CT-DNA. (A) SB at (pH 7.4), (B) SB at pH 2.0, (C) SB (pH 2.0) + 50 μM CT-DNA, (D) SB (pH 2.0) + 100 μM CT-DNA. | |
Table 3 Hydrodynamic radii and polydispersity of SB with varying concentration of CT-DNA
| Conditions |
Rh (nm) |
Pd (%) |
| (A) SB (pH 7.4) |
2.3 ± 0.1 |
11.4 ± 1.2 |
| (B) SB (pH 2.0) |
3.2 ± 0.3 |
11.7 ± 1.4 |
(C) SB (pH 2.0) + CT-DNA (1![[thin space (1/6-em)]](https://www.rsc.org/images/entities/char_2009.gif) : :![[thin space (1/6-em)]](https://www.rsc.org/images/entities/char_2009.gif) 50) 50) |
2.7 ± 0.2, 9.6 ± 1.1 |
10.6 ± 1.1, 11.6 ± 1.2 |
| 175.8 ± 2.28 |
20.2 ± 1.8 |
(D) SB + CT-DNA (1![[thin space (1/6-em)]](https://www.rsc.org/images/entities/char_2009.gif) : :![[thin space (1/6-em)]](https://www.rsc.org/images/entities/char_2009.gif) 100) 100) |
178.6 ± 3.24 |
38.8 ± 2.2 |
3.8 Morphology of fibrils as examined by fluorescence microscopy and transmission electron microscopy
Fluorescence microscopy is one of the most widely used methods to investigate the complex formation process and to study the topology of protein aggregates (ordered or unordered). To examine the CT-DNA induced aggregation in SB at pH 2.0, fluorescence microscopic images were taken. The SB at pH 7.4 and pH 2.0 did not form any aggregates (Fig. 7A and B respectively), while large number of fibrils was observed following incubation with CT-DNA at pH 2.0 (Fig. 7C). The morphology of fibrils was also determined by transmission electron microscopy (TEM). In TEM images, no aggregated species could be observed in sample containing SB alone at pH 7.4 and pH 2.0 (Fig. 7D and E) whereas fibrillar structure (similar to that observed in fluorescence microscopy) was observed in protein samples at pH 2.0 incubated with CT-DNA (Fig. 7F). Initially at low concentration of CT-DNA, SB shows fibrils, smaller in size that further progressed into mature fibrils at higher concentration of CT-DNA.
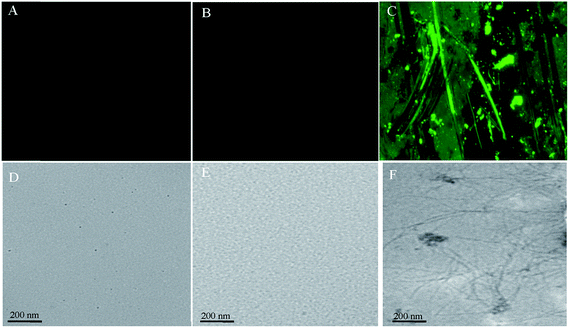 |
| | Fig. 7 Fluorescence microscopic images for (A) native SB (pH 7.4) (B) SB (pH 2.0) (C) SB (pH 2.0) + 100 μM CT-DNA, and transmission electron microscopic images for (D) native SB (pH 7.4) (E) SB (pH 2.0) (F) SB (pH 2.0) + 100 μM CT-DNA. | |
3.9 Mode of interaction between SB and CT-DNA as investigated by isothermal titration calorimetric (ITC) measurements
ITC measurements were performed to gain an insight into the type of interactions between SB and CT-DNA. The binding isotherms obtained were best fitted by single binding site model and obtained thermodynamic parameters are compiled in Table 4. The binding constant (K) was found to be 2.18 × 10⁴ M−1 which indicates the moderate binding between CT-DNA and SB. Furthermore, from the sign of enthalpy changes (ΔH°) and entropy changes (ΔS°), the forces involved in binding of CT-DNA to SB can be predicted.47 Negative ΔH° and positive ΔS° are indicative of involvement of electrostatic interaction in the binding of CT-DNA to SB at pH 2.0. However, due to positive ΔS° hydrophobic interaction cannot be negated. Moreover, the negative ΔG° also suggests the interaction to be spontaneous. To further confirm the involvement of electrostatic interaction, the binding constant of SB to CT-DNA was calculated in the presence of equimolar NaCl to CT-DNA. The decrease observed in value of binding constants confirms the involvement of electrostatic interaction at pH 2.0 because the decrease may occur due to competitive interaction of NaCl ions to SB.48,49 It is established that CT-DNA irreversibly unwinds at pH 2.0 and exposes more phosphate groups. SB is positively charged at pH 2.0 and thus the chances of its interaction with negatively charged accessible phosphate groups of unwind CT-DNA are fair and is probable mechanism that leads to aggregation. Thus, the negatively charged groups is likely to contribute significantly the formation of aggregates in vitro as reported for the heparin and mAcP interaction.50,51
Table 4 Thermodynamic parameters obtained by isothermal titration calorimetric measurements of SB with CT-DNA
| Ligand |
Thermodynamic parameters |
Values |
| CT-DNA |
K (M−1) |
2.18 × 10⁴ ± 5.18 × 10³ |
| ΔH (kcal mol−1) |
−1.74 ± 0.05 |
| TΔS (kcal mol−1) |
3.99 |
| ΔG (kcal mol−1) |
−5.78 |
| CT-DNA + NaCl |
K (M−1) |
3.48 × 10³ ± 2.05 × 10³ |
| ΔH (kcal mol−1) |
−1.28 ± 0.03 |
| TΔS (kcal mol−1) |
3.6 |
| ΔG (kcal mol−1) |
−4.81 |
3.10 Intact CT-DNA is not necessarily required for aggregation
The fibrillar assembly of SB was analyzed to ascertain whether they survive on digestion with DNase. It is easily explored by multiple approaches like Rayleigh light scattering, ThT fluorescence spectroscopy, far UV-CD spectroscopy, and transmission electron microscopy. The aggregated assembly of SB and CT-DNA (0–100 μM) was treated with DNase and the obtained results are shown in Fig. 8A and B. The scattering and ThT fluorescence intensity of DNase treated aggregated assembly shows similar trend as of untreated CT-DNA (0–100 μM) with SB; however, the values are lower for former. Similarly, far UV-CD experiment revealed that DNase treated aggregated assembly shows similar secondary structure as of untreated CT-DNA (0–100 μM) with SB as shown in Fig. 8C. Furthermore, Fig. 8D shows unaltered amyloid fibers after digestion with DNase as visualized in TEM image. Results show that aggregates survive even after treatment with DNase that may indicate intact CT-DNA is not necessary for aggregation.
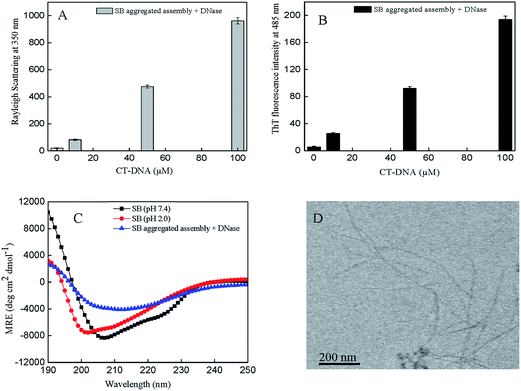 |
| | Fig. 8 Aggregated assembly of SB treated with DNase (A) Rayleigh light scattering (B) ThT fluorescence intensity at 485 nm (C) far-UV CD spectra and (D) transmission electron microscopic image. | |
4 Conclusion
Negatively charged species like DNA is found associated with the proteinaceous deposits in the tissues of patients suffering from amyloid diseases. Thus in presence of CT-DNA, we examined the aggregation behavior of SB, a model protein that exists as partially folded state at pH 2. Results conclude that at pH 2, SB undergoes conformational changes and acquires PFI state, which converts into fibrillar structure upon incubation with CT-DNA. However, initially fibrils are smaller in size that further progressed into mature fibrils at higher concentration of CT-DNA. It is due to electrostatic interaction between negatively charged phosphate groups of CT-DNA to the positively charged residues in SB. Thus, negatively charged groups generally enhance the protein aggregation. Existence of aggregates even after treatment with DNase indicates that intact CT-DNA is not necessarily required for aggregation. The implication of this work is the formation of DNA accelerated protein inclusions that can be utilized as therapeutic treatment to avoid accumulation of toxic protein oligomers.
Acknowledgements
Facilities provided by I. B. U, Aligarh Muslim University are gratefully acknowledged. MZ and SN are highly thankful to UGC, New Delhi, for financial assistance in the form of UGC-MANF-SRF and JRF fellowship respectively. NZ is highly thankful to UGC for financial assistance in the form of post doctoral fellowship. RHK is thankful to DST for project number SR/SO/BB-0018/2011.
References
- K. Ono, R. Takahashi, T. Ikeda, M. Mizuguchi, T. Hamaguchi and M. Yamada, Biochim. Biophys. Acta, Mol. Basis Dis., 2014, 1842, 646–653 CrossRef CAS PubMed.
- L. Huang, X. Liu, B. Cheng and K. Huang, Arch. Biochem. Biophys., 2015, 568, 46–55, DOI:10.1016/j.abb.2015.01.007.
- A. Qadeer, E. Ahmad, M. Zaman, M. W. Khan, J. M. Khan, G. Rabbani, K. F. Tarique, G. Sharma, S. Gourinath, S. Nadeem, G. Badr and R. H. Khan, Arch. Biochem. Biophys., 2013, 540(1–2), 101–116, DOI:10.1016/j.abb.2013.10.015.
- M. Bhattacharya, N. Jain and S. Mukhopadhyay, J. Phys. Chem. B, 2011, 115(14), 4195–4205, DOI:10.1021/jp111528c.
- S. M. Loveday, J. Su, M. A. Rao, S. G. Anema and H. Singh, Biomacromolecules, 2011, 12(10), 3780–3788, DOI:10.1021/bm201013b.
- V. Militello, V. Vetri and M. Leone, Biophys. Chem., 2003, 105(1), 133–141 CrossRef CAS PubMed.
- Z. Gazova, K. Siposova, E. Kurin, P. Mucaji and M. Nagy, Proteins, 2013, 81(6), 994–1004, DOI:10.1002/prot.24250.
- V. Vetri and V. Militello, Biophys. Chem., 2005, 113(1), 83–91 CrossRef CAS PubMed.
- C. M. Dobson, Nature, 2003, 426(6968), 884–890 CrossRef CAS PubMed.
- V. Vetri, C. Canale, A. Relini, F. Librizzi, V. Militello, A. Gliozzi and M. Leone, Biophys. Chem., 2007, 125(1), 184–190 CrossRef CAS PubMed.
- S. Mahajan, V. Chandra, S. Dave, R. Nanduri and P. Gupta, J. Infect. Dis., 2012, 206, 366–376 CrossRef CAS PubMed.
- B. Ahmad, T. A. Shamim, S. K. Haq and R. H. Khan, J. Biochem., 2007, 141(2), 251–259 CrossRef CAS PubMed.
- K. Aichele, M. Bubel, G. Deubel, T. Pohlemann and M. Oberringer, Naunyn-Schmiedeberg's Arch. Pharmacol., 2013, 386(10), 853–863, DOI:10.1007/s00210-013-0890-z.
- J. Seifert, R. Ganser and W. Brendel, Z. Gastroenterol., 1979, 17(1), 1–8 CAS.
- V. Grabovac and A. Bernkop-Schnurch, Int. J. Pharm., 2006, 326(1–2), 153–159 CrossRef CAS PubMed.
- S. K. Haq, S. Rasheedi and R. H. Khan, Eur. J. Biochem., 2002, 269(1), 47–52 CrossRef CAS PubMed.
- Z. Qin, D. Hu, M. Zhu and A. L. Fink, Biochemistry, 2007, 46(11), 3521–3531 CrossRef CAS PubMed.
- M. Yamada, S. Hara, T. Yamada, F. Katagiri, K. Hozumi and M. Nomizu, Biopolymers, 2014, 102(6), 465–472, DOI:10.1002/bip.22571.
- D. Cherny, W. Hoyer, V. Subramaniam and T. M. Jovin, J. Mol. Biol., 2004, 344(4), 929–938 CrossRef CAS PubMed.
- Y. Cordeiro, F. Machado, L. Juliano, M. A. Juliano, R. R. Brentani, D. Foguel and J. L. Silva, J. Biol. Chem., 2001, 276(52), 49400–49409 CrossRef CAS PubMed.
- B. Macedo, T. A. Millen, C. A. Braga, M. P. Gomes, P. S. Ferreira, J. Kraineva, R. Winter, J. L. Silva and Y. Cordeiro, Biochemistry, 2012, 51(27), 5402–5413 CrossRef CAS PubMed.
- L. M. Lima, Y. Cordeiro, L. W. Tinoco, A. F. Marques, C. L. Oliveira, S. Sampath, R. Kodali, G. Choi, D. Foguel, I. Torriani, B. Caughey and J. L. Silva, Biochemistry, 2006, 45(30), 9180–9187 CrossRef CAS PubMed.
- G. P. Noble, D. J. Walsh, M. B. Miller, W. S. Jackson and S. Supattapone, Biochemistry, 2015, 54(5), 1180–1187, DOI:10.1021/bi501495j.
- N. R. Deleault, B. T. Harris, J. R. Rees and S. Supattapone, Proc. Natl. Acad. Sci. U. S. A., 2007, 104(23), 9741–9746 CrossRef CAS PubMed.
- N. R. Deleault, R. W. Lucassen and S. Supattapone, Nature, 2003, 425(6959), 717–720 CrossRef CAS PubMed.
- R. Giraldo, S. Moreno-Diaz de la Espina, M. E. Fernandez-Tresguerres and F. Gasset-Rosa, Prion, 2011, 5(2), 60–64 CrossRef CAS PubMed.
- W. Jiang, Y. Han, R. Zhou, L. Zhang and C. Liu, Biochemistry, 2007, 46(20), 5911–5923 CrossRef CAS PubMed.
- S. Dave, S. Mahajan, V. Chandra, H. K. Dkhar, Sambhavi and P. Gupta, Arch. Biochem. Biophys., 2010, 499(1–2), 26–31, DOI:10.1016/j.abb.2010.05.005.
- T. Murachi, Methods Enzymol., 1970, 19, 273–284 Search PubMed.
- A. Ritonja, A. D. Rowan, D. J. Buttle, N. D. Rawlings, V. Turk and A. J. Barrett, FEBS Lett., 1989, 247(2), 419–424 CrossRef CAS PubMed.
- P. Kumar, B. Baidya, S. K. Chaturvedi, R. H. Khan, D. Manna and B. Mondal, Inorg. Chim. Acta, 2011, 376, 264–270 CrossRef CAS.
- M. Biancalana and S. Koide, Biochim. Biophys. Acta, 2010, 1804, 1405–1412 CrossRef CAS PubMed.
- A. Qadeer, G. Rabbani, N. Zaidi, E. Ahmad, J. M. Khan and R. H. Khan, PLoS One, 2012, 7(11), e50633, DOI:10.1371/journal.pone.0050633.
- Q. Xiao, S. Huang, Z. D. Qi, B. Zhou, Z. K. He and Y. Liu, Biochim. Biophys. Acta, 2008, 1784(7–8), 1020–1027, DOI:10.1016/j.bbapap.2008.03.018.
- S. K. Chaturvedi, E. Ahmad, J. M. Khan, P. Alam, M. Ishtikhar and R. H. Khan, Mol. BioSyst., 2015, 11(1), 307–316, 10.1039/c4mb00548a.
- M. R. Krebs, E. H. Bromley and A. M. Donald, J. Struct. Biol., 2005, 149(1), 30–37 CrossRef CAS PubMed.
- D. Luo and Y. Mu, J. Phys. Chem. B, 2015, 119(15), 4955–4967, DOI:10.1021/acs.jpcb.5b01107.
- V. Gabelica, R. Maeda, T. Fujimoto, H. Yaku, T. Murashima, N. Sugimoto and D. Miyoshi, Biochemistry, 2013, 52(33), 5620–5628, DOI:10.1021/bi4006072.
- A. Hawe, M. Sutter and W. Jiskoot, Pharm. Res., 2008, 25(7), 1487–1499, DOI:10.1007/s11095-007-9516-9.
- M. V. Khan, G. Rabbani, E. Ahmad and R. H. Khan, Int. J. Biol. Macromol., 2014, 70, 606–614, DOI:10.1016/j.ijbiomac.2014.07.027.
- R. Bhattacharya and D. Bhattacharyya, Biochim. Biophys. Acta, 2009, 1794(4), 698–708, DOI:10.1016/j.bbapap.2008.12.019.
- S. Dave, H. K. Dkhar, M. P. Singh, G. Gupta, V. Chandra, S. Mahajan and P. Gupta, Int. J. Biochem. Cell Biol., 2010, 42(6), 938–947, DOI:10.1016/j.biocel.2010.02.004.
- M. Suzuki, K. Yokoyama, Y. H. Lee and Y. Goto, Biochemistry, 2011, 50(47), 10390–10398, DOI:10.1021/bi2010619.
- J. Kardos, A. Micsonai, H. Pal-Gabor, E. Petrik, L. Graf, J. Kovacs, Y. H. Lee, H. Naiki and Y. Goto, Biochemistry, 2011, 50(15), 3211–3220, DOI:10.1021/bi2000017.
- M. Zaman, E. Ahmad, A. Qadeer, G. Rabbani and R. H. Khan, Int. J. Nanomed., 2014, 9, 899–912, DOI:10.2147/ijn.s54171.
- K. N. Liu, H. Y. Wang, C. Y. Chen and S. S. Wang, Amino Acids, 2010, 39(3), 821–829, DOI:10.1007/s00726-010-0536-0.
- P. D. Ross and S. Subramanian, Biochemistry, 1981, 20(11), 3096–3102 CrossRef CAS PubMed.
- N. Zaidi, S. Nusrat, F. K. Zaidi and R. H. Khan, J. Phys. Chem. B, 2014, 118(46), 13025–13036, DOI:10.1021/jp501515g.
- A. A. Thoppil, R. Sharma and N. Kishore, Biopolymers, 2008, 89(10), 831–840, DOI:10.1002/bip.21021.
- A. Qadeer, M. Zaman and R. H. Khan, Biochemistry, 2014, 79(8), 785–796, DOI:10.1134/s0006297914080069.
- J. M. Khan, A. Qadeer, S. K. Chaturvedi, E. Ahmad, S. A. Rehman, S. Gourinath and R. H. Khan, PLoS One, 2012, 7(1), e29694, DOI:10.1371/journal.pone.0029694.
|
| This journal is © The Royal Society of Chemistry 2016 |
Click here to see how this site uses Cookies. View our privacy policy here. ![[thin space (1/6-em)]](https://www.rsc.org/images/entities/char_2009.gif) 800 Da.30 CT-DNA stock solution was prepared in 20 mM Gly–HCl buffer pH 2.0. To check the purity of CT-DNA solution absorbance ratio A260/A280 was recorded. No further purification was required since the attenuation ratio was between 1.8 and 1.9. DNA concentration was determined on Perkin Elmer Lambda 25 UV-Visible spectrophotometer using average molar extinction coefficient value of 6600 M−1 cm−1 of a single nucleotide at 260 nm.31 All solutions were filtered through 0.45 μm syringe filter.
800 Da.30 CT-DNA stock solution was prepared in 20 mM Gly–HCl buffer pH 2.0. To check the purity of CT-DNA solution absorbance ratio A260/A280 was recorded. No further purification was required since the attenuation ratio was between 1.8 and 1.9. DNA concentration was determined on Perkin Elmer Lambda 25 UV-Visible spectrophotometer using average molar extinction coefficient value of 6600 M−1 cm−1 of a single nucleotide at 260 nm.31 All solutions were filtered through 0.45 μm syringe filter.
![[thin space (1/6-em)]](https://www.rsc.org/images/entities/char_2009.gif) 000 M−1 cm−1 at 412 nm.32 Protein samples (5 μM) in absence and presence of CT-DNA (0–100 μM) were incubated in 1
000 M−1 cm−1 at 412 nm.32 Protein samples (5 μM) in absence and presence of CT-DNA (0–100 μM) were incubated in 1![[thin space (1/6-em)]](https://www.rsc.org/images/entities/char_2009.gif) :
:![[thin space (1/6-em)]](https://www.rsc.org/images/entities/char_2009.gif) 2 molar ratio of protein to ThT for 30 min at 25 °C in dark. The bound ThT was excited at 440 nm and spectra were recorded from 450 to 600 nm. The excitation and emission slit widths were fixed at 5 nm. Proper controls were taken in consideration.
2 molar ratio of protein to ThT for 30 min at 25 °C in dark. The bound ThT was excited at 440 nm and spectra were recorded from 450 to 600 nm. The excitation and emission slit widths were fixed at 5 nm. Proper controls were taken in consideration.
![[thin space (1/6-em)]](https://www.rsc.org/images/entities/char_2009.gif) :
:![[thin space (1/6-em)]](https://www.rsc.org/images/entities/char_2009.gif) 20) was unaltered throughout the DLS measurements. Prior to DLS measurements, all samples were filtered through a 0.22 μM pore size microfilter (Whatman International, Maidstone UK). At least 20 measurements were performed for each sample. The data were analyzed by Dynamic 6.10.0.10 software at optimized resolution. The hydrodynamic radii (Rh) and polydispersity (Pd) were determined using Stokes–Einstein relationship.
20) was unaltered throughout the DLS measurements. Prior to DLS measurements, all samples were filtered through a 0.22 μM pore size microfilter (Whatman International, Maidstone UK). At least 20 measurements were performed for each sample. The data were analyzed by Dynamic 6.10.0.10 software at optimized resolution. The hydrodynamic radii (Rh) and polydispersity (Pd) were determined using Stokes–Einstein relationship.![[thin space (1/6-em)]](https://www.rsc.org/images/entities/char_2009.gif) :
:![[thin space (1/6-em)]](https://www.rsc.org/images/entities/char_2009.gif) 2 molar ratio of protein to ThT for 30 min at 25 °C in dark and then placed on a glass slide and covered with a cover slip. For ThT excitation and emission, Z stacking was done in the FITC channel. Images were acquired using a Carl Zeiss imager equipped with 20×, 40× or 63× (oil) objective magnification. Final images were captured with American digital camera attached with microscope.
2 molar ratio of protein to ThT for 30 min at 25 °C in dark and then placed on a glass slide and covered with a cover slip. For ThT excitation and emission, Z stacking was done in the FITC channel. Images were acquired using a Carl Zeiss imager equipped with 20×, 40× or 63× (oil) objective magnification. Final images were captured with American digital camera attached with microscope.


![[thin space (1/6-em)]](https://www.rsc.org/images/entities/char_2009.gif) :
:![[thin space (1/6-em)]](https://www.rsc.org/images/entities/char_2009.gif) 50)
50)![[thin space (1/6-em)]](https://www.rsc.org/images/entities/char_2009.gif) :
:![[thin space (1/6-em)]](https://www.rsc.org/images/entities/char_2009.gif) 100)
100)


