Infiltration of VOPcPhO into porous alumina template grown by in situ method
Muhammad Zharfan Mohd Halizana,
Abdullah Haaziq Ahmad Makinudina and
Azzuliani Supangat*b
aDepartment of Physics, Faculty of Science, University of Malaya, 50603 Kuala Lumpur, Malaysia
bLow Dimensional Materials Research Centre, Faculty of Science, University of Malaya, 50603 Kuala Lumpur, Malaysia. E-mail: azzuliani@um.edu.my; Fax: +60 379674146; Tel: +60 192682768
First published on 22nd March 2016
Abstract
In this study, the fabrication of in situ anodic alumina template (AAO) directly onto glass substrate is realized by varying stirring speeds and molarity of phosphoric acid. Porous alumina template is used to infiltrate vanadyl 2,9,16,23-tetraphenoxy-29H,31H-phthalocyanine (VOPcPhO) prior to formation of the alumina:VOPcPhO nanocomposite. VOPcPhO was observed to fully infiltrate the template with excess formation of the VOPcPhO layer on top of the porous template after lengthy immersion of 6 h. Uniformity and density of pore size, and available pores, can be respectively tuned by varying the stirring speeds (0–300 rpm) and the molarity of the pore widening agent (0–10% of phosphoric acid). Rounded-sphere pore shapes observed with the higher transparency template were correlated with stirring speed at 100 and 200 rpm. At these speeds, the template's pore size and pore density are highly homogeneous. Changing molarity of phosphoric acid as a pore widening agent affected pore size and density. The occurrence of merging pores was observed upon increasing agent molarity to 10%, which was unlikely at the lower molarity of 5% phosphoric acid. Optical properties of alumina:VOPcPhO nanocomposites that were identified via characterization of UV-vis, photoluminescence (PL) and Raman spectroscopies support successful infiltration of VOPcPhO. Alumina:VOPcPhO nanocomposite has the ability to absorb light at longer wavelengths and photons are emitted by the nanocomposite at respective energies.
Introduction
For the past decade, various methods to fabricate high-quality porous templates such as anodic aluminium oxide (AAO) have been comprehensively studied to generate the diverse dimensions of nanomaterials employed in optoelectronic devices.1 The AAO template is widely exploited due to its potential to produce high-quality nanochannels and its capability in producing nanoscale composites.2 The template method is relatively low cost, results in highly uniform nanoscale output, provides facile control of the production process and has a high-aspect ratio structures for pore size throughout the process.3 The templating method has an advantage over other techniques in production of high-aspect ratio structures in larger areas.The AAO template can be commercially or traditionally obtained depending on final product usage. Commercial templates have been extensively used in producing novel nanostructured materials. However, this template's suitability only applies for the standalone formation, due to its poor structural controllability. Researchers have fabricated home-made AAO templates via an anodization process. To date, three types of electrolyte (sulfuric acid, phosphoric acid and oxalic acid) have been used under diverse conditions of voltage, temperature, etching and anodization time in fabricating the home-made template.4,5 Home-made templates can be either fabricated from the aluminium foil or aluminium film that integrates the use of no substrate or with substrate, respectively. In situ template growth would have to integrate the use of substrate in order to produce the standing porous template with good adhesion properties. In situ grown templates could benefit the bottom-up fabrication of devices with no transfer process during fabrication. Unlike commercial or home-made templates synthesized from aluminium foil, templates grown directly on substrate are hassle-free.
Substrates such as glass, indium tin oxide (ITO) and silicon have been used as an excellent base due to their abilities to tune their adhesion properties to the evaporated aluminium film.3,6,7 These substrates are used as electrodes in optoelectronic devices such as light-emitting diodes, solar cells and laser diodes.8 In addition, the integration of substrate in template fabrication may ease the deposition of desired aluminium thickness, the final length and diameter of nanostructured materials.3,9 To deposit an aluminium layer onto these substrates, a thermal evaporation technique has been used with aluminum film prepared via this technique ranging from 100 nm to 5.5 μm in thickness.8,10 The thermal evaporation technique has a metal deposition advantage over the DC sputtering method. The thermal evaporation technique can be less costly and cause less damage to film when compared to the latter technique. In previous works, a thicker aluminum layer (1 μm to 0.25 mm) has been deposited and anodized to produce AAO template.11,12
In situ template growth may facilitate production of nanocomposites by infiltrating the guest material into the nanopores. Dissolution of the template by chemical etching can be done if the porous template is solely used for replication purposes. However, the porous template (host) can be incorporated with the infiltrated guest materials for nanocomposite production and further bottom-up fabrication of optoelectronic devices. Infiltrating a guest material such as vanadyl 2,9,16,23-tetraphenoxy-29H,31H-phthalocyanine (VOPcPhO) into a porous template would direct formation of the nanocomposite that can be employed in organic optoelectronics devices. VOPcPhO is highly soluble in numerous types of organic solvents, which makes it the most reliable of metal phthalocyanine organic solutions.13 Various nanostructure-based organic and inorganic materials such as nanowires, nanoparticles, nanorods, nanotubes, nanopods, nanoflowers, and nanocomposites have been synthesized via a template method.14–18 In the present study, nanocomposites containing porous alumina template and VOPcPhO are fabricated onto glass substrate, and its optical properties of infiltrated VOPcPhO are then elaborated to study nanocomposite uniformity.
Anodization using stirring has been reported,12,19 while application of a pore-widening technique by using 5 wt% H3PO4 has also been established.8 To our knowledge, the effects of stirring on the AAO template in sulfuric acid and usage of other H3PO4 molarities have not yet been studied. Therefore, the diverse fabrication parameters for porous alumina templates, and especially stirring speed and pore-widening molarity, are documented in this work. To ensure achievement of desired template structures, various anodization techniques involving two- and four-step techniques are introduced,5,20,21 while a single-step method is employed in our study to complement aluminium thickness.
Experimental
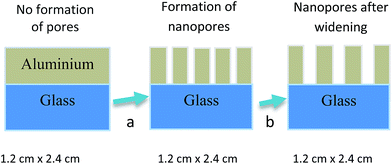
Prior to evaporation of the aluminium film, the glass substrate was first cleaned with liquid soap and placed in an ultrasonic cleaner. Then acetone and ethanol were used for further cleaning before rinsing the film in distilled water. Glass substrate was then used in the aluminium deposition process with the deployment of 20 V. In the anodization process, platinum mesh and aluminium-coated glass acted as a counter-electrode and anode, respectively. A one-step anodization technique with a pore enlargement method was applied to construct an anodic aluminium oxide (AAO) template (Fig. 1). The anodization process was performed at 10 °C with 0.3 M sulfuric acid (electrolyte) placed within the bath circulator. Stirring speeds of 0, 50, 100, 200 and 300 rpm were applied during the anodization process. The anodized samples were then immersed for 15 min in 5% phosphoric acid at 30 °C for pore widening. For further morphological analysis, AAO templates that underwent the 100 rpm stirring speed will undergo additional pore-widening treatment by varying phosphoric acid molarity (0, 5 and 10 wt%).Vanadyl 2,9,16,23-tetraphenoxy-29H,31H-phthalocyanine (VOPcPhO) was purchased and used without further purification. VOPcPhO was dissolved in chloroform to make a 5 mg mL−1 solution concentration before use for infiltration of the AAO template. Infiltration was accomplished by the wetting process (6 h immersion). Morphological properties of porous alumina template and AAO:VOPcPhO nanocomposite were characterized by field emission scanning electron microscopy (FESEM) (SU 8000, Hitachi, Japan), while optical properties were obtained via UV-vis spectroscopy (Lambda 750, PerkinElmer, Waltham, USA), photoluminescence and Raman spectroscopy (Renishaw, Gloucestershire, UK).
Results and discussion
Anodization process
Fig. 2a and b show the current (mA) versus time (s) graph during anodization for stirring and no stirring, respectively. Similar shapes of the graph obtained during the stirring process are reported by N. Taşaltın et al.,22 except that sulphuric acid was used in this work instead of oxalic acid. In addition, the current reactions occurred more rapidly. This could be due to thinner aluminium used in the present work, which enabled faster anodization. Initially, the current rapidly declines due to formation of an aluminium oxide barrier on the aluminium surface. A small increase in current indicates production of pores at random locations. Self-organizing of pores may be indicated by the constant current while a decrease in current may be due to the penetration of pores in the glass substrate. Fig. 2b shows that the current gradually decreases between 0 and 5 s of anodization until it achieves a steady decrement at 3 mA. The current started to decrease, which may have been due to aluminium film oxidation. An individual crack may have formed during this stage, and gradually moved through the barrier layer randomly. These cracks then acted as nucleation sites for pore construction. Formation of self-organized pores is initiated where structural composition is dominated by alumina (Al2O3). The steady reduction of current supported the steady penetration process of pores into the alumina layer, most likely facilitated by stirring process. Anodizing current is highly related to the movement of oxygen molecules (originating from acid), which processes ions with oxygen (O2 or OH−). These ions move through the barrier layer (situated at the bottom of pores) into the oxide layer interface with the occurrence of outward drift by Al3+ ions across the oxide structure. When formation of the oxide layer is sufficient, ion diffusion becomes limited and the diffusion path become more lengthy along the porous layer.18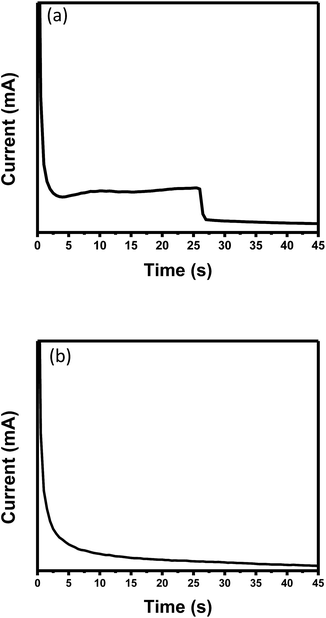 | ||
| Fig. 2 Graph of current versus time during anodization process for (a) stirring and (b) no stirring. | ||
Synthesis of porous alumina and alumina:VOPcPhO nanocomposite
Fig. 3a–e shows the FESEM images of the AAO template that underwent pore widening in 5% phosphoric acid at stirring speeds of 0, 50, 100, 200 and 300 rpm, respectively. Comparing these four stirring speeds with the one without stirring, huge differences in the shape of pores are detected. Three shapes-hexagonal, rounded, and elongated-pores were observed by (1) not stirring the electrolyte (0 rpm); (2) stirring at 50, 100, and 200 rpm; and (3) stirring at 300 rpm, respectively. The AAO template that fabricated without any stirring produced a bigger pore size compared to templates that underwent stirring. Although the no-stir AAO template produced a bigger pore size, its homogeneity was inconsistent. Throughout the template surfaces, pores are likely to enlarge, which leads to formation of thin-walled pores. Some become larger than others due to the combination of two or more pores. The stirring process contributes to better dispersion of the electrolyte by disturbing the static solution. However, the speed of stirring has a significant effect on nanopore formation. Between 50 and 200 rpm, uniform formation of pores with smaller diameter and thicker walls was observed. As shown by the plot profile (inset), stirring speed between 50 and 200 rpm led to improved homogeneity and pore density as well as smaller pore size. This observation has led to the assumption that at a certain point (saturation), the pore stops expanding to avoid any recombination of two or more pores during anodization, which then create a thinner wall. Despite greater homogeneity of pores at higher stirring speeds, a further increase in speed to 300 rpm resulted in adverse formations. The plot profile for 300 rpm shows less pore homogeneity across the template. Instead of forming a uniform pore size, the AAO template had elongated-like pore shapes of incomplete anodization on its surface. The elongated-like shape results from a gap between the cracked alumina layers of poor transformation from the film to the pore structure.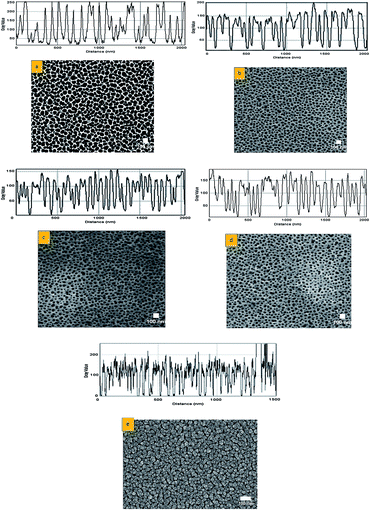 | ||
| Fig. 3 FESEM images of AAO template with 5% of phosphoric acid (widening) at stirring speed of (a) 0 rpm, (b) 50 rpm, (c) 100 rpm, (d) 200 rpm, and (e) 300 rpm. (Outset is a plot profile.) | ||
In a closed system where only a small amount of heat is allowed to escape, the stirring effect could provide exceptional temperature uniformity. The excellent temperature consistency is due to the creation of kinetic energy originating from the stirring movement. Due to movement within the electrolyte solution, the kinetic energy will then be converted into thermal energy and thus satisfies the conservation of energy principle. The stirring process during anodization can slightly increase the local temperature of electrolyte acid and thus further increase the anodization rate (oxide dissolution and formation) and produce the smaller, more abundant (higher density) and homogeneous nanopore array. At 300 rpm, the stirring is very much faster, which causes the negative hydrogen ion from the electrolyte to fully attack the aluminium film. As reported elsewhere,18 500 and 800 rpm stirring speeds have been used in the anodization process to produce unvarying nanopore structures. However, these speeds are applied on aluminium film of 0.25 mm thickness in a multi-step anodization process in which the fully complete anodization process is achieved.
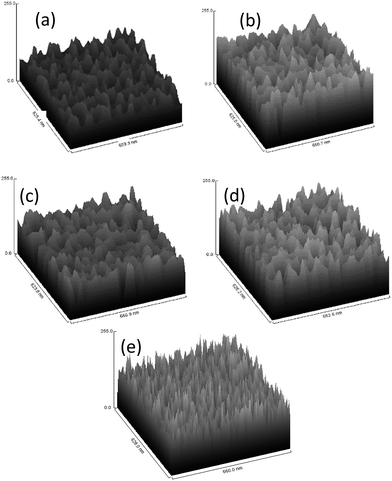
Fig. 4a–e shows a 3-dimensional (3D) surface plot of AAO template with 5% of phosphoric acid (widening) at stirring speeds of 0, 50, 100, 200 and 300 rpm, respectively. The size of the analysed surface area was approximately 628 nm × 660 nm. These 3D surface plot graphs provide information on possible thickness but not on quantitative surface roughness. Upon examining these 3D graphs, confirmation of the formation of porous structures from all parameters can be deduced. The only difference shown among these surface plots is the opening pore, which represents its pore size. Upon comparison of 0 and 300 rpm, identical opening pores are likely at 50, 100 and 200 rpm stirring speeds. This observation is supported by the top view of FESEM images and plot profiles. In addition, a large difference in surface plot properties between no stirring and stirring at 300 rpm is observed. With no stirring, the opening is larger than in the sample stirred at 300 rpm, which may be considered as a saturation point for formation of desired pores. During the stirring process, perturbation of the static solution (electrolyte) occurs via dispersion of ions. The stirring rate affects dispersion of electrolyte ions (O2− or OH−) to be transported to the anode surface. At 50 to 200 rpm, ions get well dispersed across the samples. However, at 300 rpm and higher, collisions between ions occur vigorously, which leads to lower ion dispersion across the samples. Lower availability of ions may reduce pre density. In addition, at 300 rpm, the greater stirred force will be exerted to ions that are about to start to act upon the sample. Consequently, these ions have easily been washed away before reaching the sample.
In this work, the AAO templates that produced the most uniformity can be obtained using an extremely thin (∼100 nm) layer from a single anodization step. Sulka has reported on the production of AAO templates with high uniformity using thicker aluminium foil (0.25 mm) and a two-step method.18 Although a high-uniformity template using a thin aluminium layer of 200 nm has been reported, the process was implemented using the four-step method.3 In the current work, pore morphology of pore is slightly less well-ordered due to absence of multi-step anodization and a much shorter anodization period.23 In addition, the thinner aluminium can be the factor that contributes to the less well-ordered morphology.11
A stirring speed of 100 rpm was chosen for further synthesis of porous alumina with diverse pore-widening parameters due to its capability in producing uniform structured pores. Fig. 5a–c shows FESEM images and plot profiles of the AAO template at a stirring speed of 100 rpm with no pore widening, widening in 5% phosphoric acid and widening in 10% phosphoric acid, respectively. As expected, the porous alumina with no pore widening treatment presents irregular pore sizes with elongated-like pores. This formation is comparable to the porous alumina that synthesized at 300 rpm of 5% phosphoric acid pore-widening treatment. Both stirring speed and pore-widening treatment play essential roles in producing the porous alumina template. Rounded-sphere pores are unlikely to be formed when the highest stirring speed or lowest molarity of phosphoric acid is applied. No pore-widening treatment led to non-expansion of nucleated pores. Fig. 6a–c shows the 3D surface plots of the porous alumina template with no pore widening, widening in 5% phosphoric acid and widening in 10% phosphoric acid, respectively. The 3D surface plots support the formation of porous structures displayed in the top view of FESEM images.
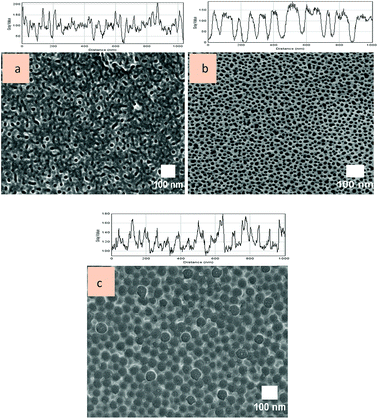 | ||
| Fig. 5 FESEM images of AAO template at stirring speed of 100 rpm with (a) no pore widening, (b) widening in 5% phosphoric acid and (c) widening in 10% phosphoric acid. (Outset is a plot profile.) | ||
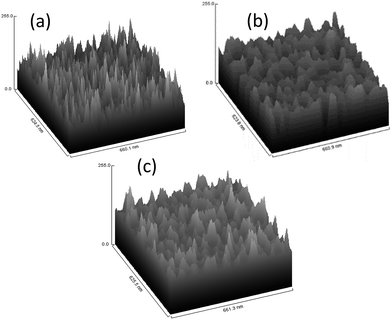 | ||
| Fig. 6 Surface plot of AAO template at stirring speed of 100 rpm with (a) no pore widening, (b) widening in 5% phosphoric acid and (c) widening in 10% phosphoric acid. | ||
Fig. 7a shows the top-view FESEM image of the alumina:VOPcPhO nanocomposite with the inset showing the plot profile. Infiltration of VOPcPhO is done onto the porous alumina that was synthesized based on the 100 rpm stirring speed parameter and 5% phosphoric acid. As expected, the top surface (morphology) of the nanocomposite was different from the top surface of porous alumina. This is due to the successful infiltration of VOPcPhO into the porous alumina arrays. No rounded-sphere pores were detected in the top surface of the nanocomposite apart from its undulating top surface. The undulating surface most probably originated from formation of the VOPcPhO layer on top of the porous alumina surface. Infiltration and thin-layer formation of VOPcPhO are supported by the cross-section view of the FESEM image shown in Fig. 7b. The FESEM image shows the infiltrated VOPcPhO between the pores with a thin layer of VOPcPhO on top of it. This brings us to fabrication of the alumina:VOPcPhO nanocomposite with the thickness of porous alumina and VOPcPhO layer on top of it at approximately 85 and 95 nm, respectively. It is clear that two different regions of brighter and darker, which correspond to alumina and VOPcPhO, respectively, were successfully created. As reported elsewhere,24,25 VOPcPhO solution is capable for infiltration into nanopores with pore size between 20 and 200 nm. There is no doubt that the VOPcPhO infiltration occurred in the porous alumina with pore size between 10 and 60 nm as synthesized in the present study. However, due to the lengthy immersion time of 6 h, an excess layer of VOPcPhO was created, which brings total thickness of VOPcPhO inside the porous arrays (85 nm) and its top layer (95 nm) to approximately 180 nm. Fig. 7c shows the 3D surface plot of alumina:VOPcPhO nanocomposite in which its dissimilarity to the porous alumina template's morphological properties is observed. This observation confirmed theorizing about having VOPcPhO as a capable guest material to wet pore walls for higher surface tension. VOPcPhO solution with a concentration of 5 mg mL−1 underwent a flow into a closed-end channel. A particular phenomenon considered necessary for understanding nanoscale fluid transport is capillary filling (CF) of the nanochannel. This process has been studied for open capillaries that are in contact with a liquid bath at one channel end. Under this condition, CF happens with capillary force action of viscous drag. In a sufficiently long channel, CF was first done by a fast density increase due to accommodation of molecules on the inner pore surface with unbinding of the meniscus. After that, the meniscus is accelerated towards the pore opening.26 It can be predicted that a similar mechanism of fluid mechanics has occurred during VOPcPhO infiltration into the pores.
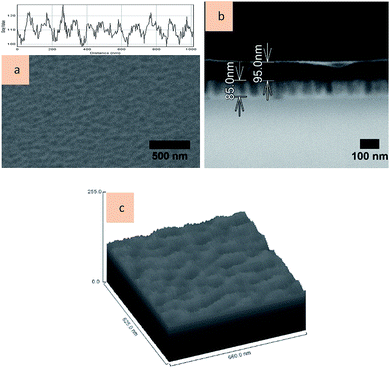 | ||
| Fig. 7 FESEM images of AAO:VOPcPhO nanocomposite in (a) top view and (b) cross-section view. (c) Surface plot of AAO:VOPcPhO nanocomposite. | ||
Fig. 8a presents a bar chart of pore sizes for the porous alumina template that does not undergo stirring with the mode at 30 nm and counts at 164 per area. Total pore counts are 560 with the mean of its diameter size recorded to be 50.34 ± 17.63 nm. The porous alumina template obtained from the stirring speed of 50 rpm (Fig. 8b) shows higher homogeneity of structured pores when compared to the one without stirring. As stirring speed increases to 100 rpm (Fig. 8c), the pore size is almost similar; however, it is very dense with more counts per area. The pore size mode is 20.0 ± 9.56 nm with counts per area at 608 and total pores available are 1540 counts. Porous alumina template that was synthesized by stirring at 200 rpm almost had the same pore size as the former, although a slightly lower homogeneity of pores was observed (Fig. 8d). Porous alumina template with no stirring can produce a larger pore size despite having non-homogenous pore sizes. In contrast, the template that produced higher pore counts per unit area resulted in decreased size. Fig. 8e presents similar pore sizes and pore counts per unit area as Fig. 8c since they underwent a similar anodization parameter process. Fig. 8f depicts the pore distribution of the template with 10% phosphoric acid in the pore-widening treatment. With the higher concentration of acid, the largest pore size of 40 nm can be formed with the counts per unit area at 292. The reason for the largest formation of pore size is the occurrence of individual pores merging with neighbouring pores. A higher molarity of phosphoric acid can contribute to higher availability of hydrogen ions and molecules. Therefore, the reaction rate to form the pore is increased, with more area being attacked by hydrogen ions and molecules to construct bigger pores.3 Except for 300 rpm and no stirring, pore diameter and pattern obtained are comparable to pores obtained by Zhuo et al.8 However, smaller pores available in the present work resulted from use of sulphuric acid rather than oxalic acid.27
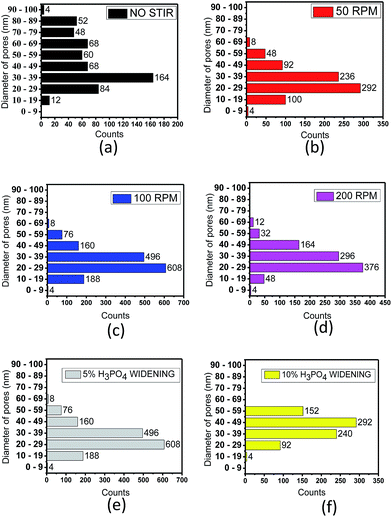 | ||
| Fig. 8 Chart distribution of template with pore diameter of (a) 0 rpm, (b) 50 rpm, (c) 100 rpm, (d) 200 rpm, (e) widening in 5% phosphoric acid and (f) widening in 10% phosphoric acid. | ||
Optical characteristics of porous alumina and alumina:VOPcPhO nanocomposite
Fig. 9a demonstrates the transmission spectra of glass and porous alumina template of different stirring speeds deposited onto glass. As demonstrated in the spectra, glass with no deposition of alumina, depicts 100% of transmittance which is used as reference. Zaghdoudi et al. reported that glass substrate has 100% transmittance value,10 while the shape of graphs obtained are comparable with those of Zhuo et al.8 Porous alumina templates obtained by stirring speed between 50 and 200 rpm had transmittance between 45% and 85%; the 200 rpm stirring speed produced a higher transparency template. Meanwhile, the porous alumina template fabricated with no stirring showed the lowest transmittance percentage of 28%. The highest transparency presented by the template without stirring has many determinants of its morphological properties. As mentioned earlier, the no-stirring template has a wider pore size distribution (10–90 nm) than the template with stirring. The range of pore size distribution for the template with stirring was 10–60 nm. Due to variations in pore size, light interference order and light absorption will be higher. The less transparent porous alumina template of larger pore size variations can cause higher absorption by the available acid radical and aluminium remains7 since the template has not undergone the annealing treatment. The refractive index of glass, ns, was calculated using eqn (1),8 while other samples' refractive indexes were calculated using the Manifacier method. For the porous alumina template of no stirring, 50, 100 and 200 rpm, a refractive index of 3.86, 3.76, 3.38 and 2.94, respectively, was reported, while a refractive index for the glass substrate used in this study is 1.15. Since the sample of 0 rpm has low homogeneity of porous structures, it possesses fewer pores compared to stirred samples. Therefore, it has the lowest transmittance. In a perfect transmittance situation, electron vibrations will be passed on to neighbouring atoms through the bulk of the material and reemitted on the opposite side of the object. However, in our work, the light wavelength has undergone Rayleigh scattering due to the presence of nanochannel structures. A no-stirred sample possessed the highest Rayleigh scattering. This is due to variation in pore size between 10 and 90 nm. Furthermore, low homogeneity of pores will further reduce scattering all over the sample structure. The stirred samples have lower Rayleigh scattering since their pore structures are more homogenous in diameter. These are the reasons for the stirred sample's higher transmittance value compared to the no-stirred one.| ns = 1/Ts + (1/Ts2 − 1)1/2 | (1) |
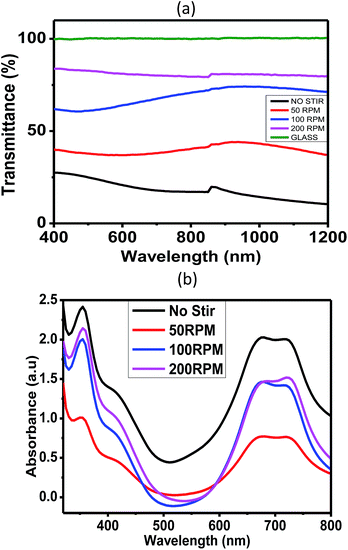 | ||
| Fig. 9 (a) Effects of stirring speed on transmittance of porous alumina and (b) UV-vis absorption spectra of alumina:VOPcPhO nanocomposites. | ||
Fig. 9b shows the UV-vis absorption spectra of infiltrated VOPcPhO. The first peak corresponds to the B-band while the two latter peaks correspond to the Q-band. As tabulated in Table 1, stirring speeds of 100 rpm were correlated with red-shifted peaks at 355 and 721 nm, which correspond to the B-band and 2nd Q-band, respectively, while 200 rpm was shown to be red-shifted at 683 nm of its 1st Q-band. However, the highest light absorption when being infiltrated with VOPcPhO was shown for the template that did not undergo stirring. This phenomenon could be the outcome of a wider distribution of pore diameters from 10 to 100 nm. VOPcPhO is able to infiltrate the template that possesses diverse pore sizes, which in turn absorb more photons. Despite having the highest light absorption, the template with no stirring showed blue-shifting at 354, 677, and 715 nm when infiltrated with VOPcPhO. This observation proved that VOPcPhO infiltrated into various pore sizes (10–100 nm) halted the π–π* transition.28 Interdependency among photon absorption, π–π* transition and template architecture is likely.
| Bands/stirring speeds | 0 rpm | 50 rpm | 100 rpm | 200 rpm |
|---|---|---|---|---|
| B-band | 354 nm | 354 nm | 355 nm | 354 nm |
| 1st Q-band | 677 nm | 678 nm | 679 nm | 683 nm |
| 2nd Q-band | 715 nm | 718 nm | 721 nm | 720 nm |
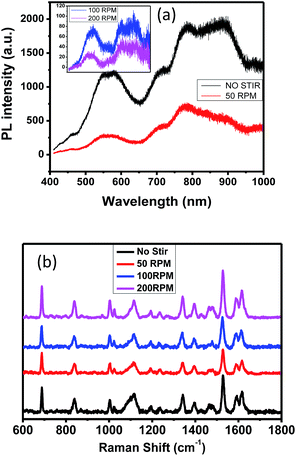
Fig. 10a shows the photoluminescence (PL) spectra of alumina:VOPcPhO nanocomposites were plotted at 400–1000 wavelengths. Photoluminescence is a process in which light is emitted by any form of material due to the photon absorption. To satisfy the PL process, peaks that obtained in PL spectra should exhibit the longer wavelength than peaks that obtained in UV-vis absorption spectra. Table 2 shows the PL peaks of all parameters that obviously corresponded to respective UV-vis absorption spectra. Three PL peaks, from 577–585 nm, to 787–794 nm, to 883–885 nm, are assigned to the B-band (354–355 nm), 1st Q-band (677–683 nm) and 2nd Q-band (715–721 nm) of UV-vis, respectively. During the PL process, molecules that originated from alumina and VOPcPhO interact with the visible light. These molecules then are energized to the excited state because of excess energy obtained from the light interaction. To experience the relaxation process, these molecules subsequently jump down to the lower energy state and emit photons in the process. Such photons comprise the difference in energy levels between the two states involved in the transition. The quenching effect was observed in nanocomposites fabricated from the porous alumina template synthesized at stirring speeds of 100 and 200 rpm, which exhibited a better photo-induced charge transfer.
| PL peaks (nm) | |||
|---|---|---|---|
| 0 rpm | 50 rpm | 100 rpm | 200 rpm |
| 578 | 577 | 585 | 579 |
| 787 | 788 | 794 | 793 |
| 883 | 883 | 885 | 884 |
In addition, the red-shifts shown at the B-band and 2nd Q-band via the 100 rpm and red shifted at the 1st Q-band shown by 200 rpm of UV-vis absorption spectra are correlated with the red-shifts shown in their PL spectra. This characteristic is highly significant for sensor fabrication and production. Fig. 10b shows the Raman spectra of alumina:VOPcPhO nanocomposites for all parameters. Nanocomposites have exhibited similar Raman shifts, although with different intensities. Assignments and changes in wavenumbers are presented in Table 3. Alumina:VOPcPhO nanocomposite that fabricated from the template of 100 rpm has shown similarity in its Raman shifts at 687, 1003, 1024, 1193, 1236, 1341, 1464, 1528, 1591 and 1616 cm−1 with VOPcPhO nanotubes that have been reported elsewhere.24 The other Raman shifts at 838 and 1113 cm−1 are similar to those of VOPcPhO thin film. These Raman shifts could be due to the VOPcPhO thin-film layer on top of the infiltrated VOPcPhO. There are two Raman shifts at 1395 and 1479 cm−1 that have not been reported for VOPcPhO, which could be drawn from the contribution of alumina.
| Raman shift (cm−1) | Assignments | |||
|---|---|---|---|---|
| 0 rpm | 50 rpm | 100 rpm | 200 rpm | |
| 686 | 687 | 687 | 687 | Macrocycle breathing |
| 838 | 838 | 838 | 838 | Macrocycle stretching |
| 1002 | 1003 | 1003 | 1003 | Benzene ring breathing |
| 1024 | 1024 | 1024 | 1029 | C–H bending |
| 1113 | 1113 | 1113 | 1113 | |
| 1192 | 1192 | 1193 | 1193 | |
| 1232 | 1231 | 1236 | 1232 | |
| 1339 | 1339 | 1341 | 1342 | Pyrrole stretching |
| 1395 | 1395 | 1395 | 1396 | Ring stretching |
| 1464 | 1464 | 1464 | 1469 | |
| 1479 | 1477 | 1479 | 1479 | |
| 1527 | 1528 | 1528 | 1528 | Pyrrole stretching |
| 1590 | 1588 | 1591 | 1591 | C![[double bond, length as m-dash]](https://www.rsc.org/images/entities/char_e001.gif) C stretching C stretching |
| 1615 | 1616 | 1616 | 1616 | |
Conclusions
The fabrication of porous alumina template on glass substrate via the single-step anodization technique and later infiltrated by VOPcPhO was successfully realized. Instead of hexagonal nanoporous shapes as normally produced by anodization, nanoporous rounded-sphere shapes were the most common form. The stirring or without stirring process can affect uniformity and homogeneity of pore size and density. In addition to the stirring treatment, pore widening treated in different molarities of phosphoric acid can lead to changes in morphology. Optical properties suggested that porous alumina template synthesized from higher stirring speeds improves transmittance and refractive index. Infiltration of VOPcPhO into the template was proven by observation of its morphological and optical properties. Alumina:VOPcPhO nanocomposite has potential to be employed in sensor applications.Acknowledgements
The authors would like to acknowledge the University of Malaya for project funding under the University Malaya Research Grant (RP026C-15AFR); the University of Malaya High Impact Research Grant UM-MoE (UM.S/625/3/HIR/MoE/SC/26); and the Ministry of Education Malaysia for project funding under the Fundamental Research Grant Scheme (FP046-2015A).References
- Y. Li, M. Guo, M. Zhang and X. Wang, Mater. Res. Bull., 2009, 44, 1232–1237 CrossRef CAS.
- A. Drury, S. Chaure, M. Kröll, V. Nicolosi, N. Chaure and W. J. Blau, Chem. Mater., 2007, 19, 4252–4258 CrossRef CAS.
- M.-P. Houng, W.-L. Lu, T.-H. Yang and K.-W. Lee, J. Nanomater., 2014, 2014, 130716 Search PubMed.
- L. Shen, M. Ali, Z. Gu, B. Min, D. Kim and C. Park, Korean J. Chem. Eng., 2013, 30, 221–227 CrossRef CAS.
- F. Li, L. Zhang and R. M. Metzger, Chem. Mater., 1998, 10, 2470–2480 CrossRef CAS.
- K. Rana, G. Kucukayan-Dogu and E. Bengu, Appl. Surf. Sci., 2012, 258, 7112–7117 CrossRef CAS.
- G. Peitao, X. Zhilin, X. Yiyu, H. Caihua and Z. Lixin, Appl. Surf. Sci., 2011, 257, 3307–3312 CrossRef.
- H. Zhuo, F. Peng, L. Lin, Y. Qu and F. Lai, Thin Solid Films, 2011, 519, 2308–2312 CrossRef CAS.
- K. P. Musselman, G. J. Mulholland, A. P. Robinson, L. Schmidt-Mende and J. L. MacManus-Driscoll, Adv. Mater., 2008, 20, 4470–4475 CrossRef CAS.
- W. Zaghdoudi, M. Gaidi and R. Chtourou, J. Mater. Eng. Perform., 2013, 22, 869–874 CrossRef CAS.
- M. S. Sander and L. S. Tan, Adv. Funct. Mater., 2003, 13, 393–397 CrossRef CAS.
- G. Sulka and K. Parkoła, Electrochim. Acta, 2007, 52, 1880–1888 CrossRef CAS.
- F. Aziz, M. Sayyad, Z. Ahmad, K. Sulaiman, M. Muhammad and K. S. Karimov, Phys. E, 2012, 44, 1815–1819 CrossRef CAS.
- Y. Piao and H. Kim, J. Nanosci. Nanotechnol., 2009, 9, 2215–2233 CrossRef CAS PubMed.
- G. Sklar, K. Paramguru, M. Misra and J. LaCombe, Nanotechnology, 2005, 16, 1265 CrossRef CAS.
- B. Chen, Q. Xu, X. Zhao, X. Zhu, M. Kong and G. Meng, Adv. Funct. Mater., 2010, 20, 3791–3796 CrossRef CAS.
- X. Wang and G.-R. Han, Microelectron. Eng., 2003, 66, 166–170 CrossRef CAS.
- G. D. Sulka and W. J. Stępniowski, Electrochim. Acta, 2009, 54, 3683–3691 CrossRef CAS.
- G. D. Sulka and K. G. Parkoła, Thin Solid Films, 2006, 515, 338–345 CrossRef CAS.
- S.-K. Hwang, S.-H. Jeong, H.-Y. Hwang, O.-J. Lee and K.-H. Lee, Korean J. Chem. Eng., 2002, 19, 467–473 CrossRef CAS.
- Y. K. Hong, B. H. Kim, D. I. Kim, D. H. Park and J. Joo, RSC Adv., 2015, 5, 26872–26877 RSC.
- N. Taşaltın, S. Öztürk, N. Kılınç, H. Yüzer and Z. Z. Öztürk, Appl. Phys. A: Mater. Sci. Process., 2009, 95, 781–787 CrossRef.
- C.-H. Lai, C.-W. Chang and T.-Y. Tseng, Thin Solid Films, 2010, 518, 7283–7286 CrossRef CAS.
- A. H. A. Makinudin, M. S. Fakir and A. Supangat, Nanoscale Res. Lett., 2015, 10, 1–8 CrossRef PubMed.
- A. Kamarundzaman, M. S. Fakir, A. Supangat, K. Sulaiman and H. Zulfiqar, Mater. Lett., 2013, 111, 13–16 CrossRef CAS.
- D. Schneider, R. Valiullin and P. A. Monson, Langmuir, 2014, 30, 1290–1294 CrossRef CAS PubMed.
- S. K. Hwang, H. Y. Hwang and K. H. Lee, Korean J. Chem. Eng., 2002, 19, 467–473 CrossRef CAS.
- A. Supangat, A. Kamarundzaman, N. A. Bakar, K. Sulaiman and H. Zulfiqar, Mater. Lett., 2014, 118, 103–106 CrossRef CAS.
| This journal is © The Royal Society of Chemistry 2016 |

