Facile room temperature synthesis of metal–organic frameworks from newly synthesized copper/zinc hydroxide and their application in adsorptive desulfurization
Wencong Xua,
Gang Li*a,
Weigang Lia and
Haojie Zhangb
aState Key Laboratory of Fine Chemicals, School of Chemical Engineering, Dalian University of Technology, Dalian, 116024, China. E-mail: liganghg@dlut.edu.cn
bCAS Key Laboratory of Low-Carbon Conversion Science and Engineering, Shanghai Advanced Research Institute (SARI), Chinese Academy of Sciences (CAS), Shanghai, 201210, China
First published on 11th April 2016
Abstract
Four metal–organic framework (MOF) materials were synthesized via the newly prepared copper or zinc hydroxides with two different organic ligands under ultrasonic conditions at room temperature. The products were characterized by powder X-ray diffraction patterning, scanning electron microscopy, thermal gravimetric analysis and nitrogen adsorption–desorption. The successful synthesis of the MOFs herein highlights the possibilities of producing other MOFs conveniently and efficiently via this method. In addition, the MOFs were used as the adsorbents to remove DBT from liquid fuel after activation, which showing comparable desulfurization performance with conventional MOFs gained via batch solvothermal or hydrothermal method. This means well applying potential of the facile synthesized MOFs.
1. Introduction
Metal–organic frameworks (MOFs),1 built from organic linkers and inorganic metal nodes, have attracted intense interest from researchers for their applications in gas storage, separation, catalysis, biomedicine and so on.2 So far, MOF materials are constantly synthesized via batch solvothermal or hydrothermal method.3 However, the preparation usually takes a long reaction time, sometimes up to several days, which is depending upon the particular synthesis conditions such as amount and type of solvent, reaction temperature and concentration.4 In order to simplify the reaction step and reduce the reaction time, various methods have been developed, such as ultrasonic,5–9 microwave10–14 and mechanochemical.15–18 In spite of the significant advances achieved in this field, there is still a critical need for the development of high-rate and high-quality synthesis of MOFs materials environmentally friendly.Recently, a few reports have demonstrated some approaches to achieve these goals. Kim et al.19 synthesized crystal size and phase controlled Cu–BTC (namely HKUST-1 or Cu3(BTC)2, BTC = 1,3,5-benzenetricarboxylic) with a high rate using a continuous-flow microreactor-assisted solvothermal system. Na et al.20 also reported a high-quality method for the synthesis of Cu–BTC via a facile and environmental route in water at room temperature. Majano et al.21 used a remarkable approach to produce MOFs from copper hydroxide aqueous ethanol slurries with a particle size of 800 nm to 1 μm, and the scale up of Cu–BTC was also well studied. However, the possibility of synthesizing other MOFs using this direct formation method has not been reported.
As environmental pollutants sulfur compounds in fuel oils are major concern due to their exhaust gases containing SOx, which not only contribute to acid rain but are also harmful to human health.22 Compared with traditional industrial process for sulfur removal—hydrodesulfurization (HDS), adsorption desulfurization (ADS) is considered as one of the most promising processes due to some advantages, such as mildly operating conditions and no need for hydrogen or oxygen.23 MOFs are emerging class of adsorbents, which show significant adsorptive amounts of sulphur. However, most of the MOFs are prepared by using organic solvents containing metal salts and organic acidic groups at relatively high temperature for a long time. These will limit their application.
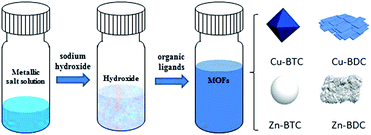
Herein, four kinds of MOFs (Cu–BTC, Cu–BDC, Zn–BTC, Zn–BDC) are synthesized from newly prepared copper or zinc hydroxide with two different organic ligands (Fig. 1). The formation time of each MOF varies from 5 minutes to 2 hours under ultrasonic at room temperature. It is the first time to synthesize Cu–BDC, Zn–BTC and Zn–BDC via metal hydroxide. This process shows relatively convenient and time-saving advantages compared with the previously reported synthesis by using metal salts and organic solvents at high temperature and with long reaction time. Furthermore, as described herein, the successful syntheses of Cu–BDC, Zn–BTC and Zn–BDC provide possibilities for synthesizing other MOFs via this method. Finally, they are used for sulfur removal to explore the possibility of using these MOFs as efficient adsorbents.
2. Experimental
2.1 Chemicals
Copper nitrate (Cu(NO3)2·3H2O, AR, Damao), zinc nitrate (Zn(NO3)2·6H2O, AR, Damao), 1,3,5-benzenetricarboxylic acid (H3BTC, 99%, J&K), 1,4-dicarboxybenzene (H2BDC, 99%, Wokai), sodium hydroxide (NaOH, AR, Bodi), dibenzothiophene (DBT, 99%, Acros), N,N-dimethylformamide (DMF, AR, Fuyu), ethanol (EtOH, AR, Damao), octane (AR, Bodi) and methanol (AR, Bodi) are all obtained from suppliers and used without any further purification.2.2 Preparation of MOFs
The newly synthesized copper hydroxide was prepared by adding NaOH aqueous solution (1.0 mol l−1, 1.65 ml) into Cu(NO3)2·3H2O aqueous solution (0.20 g, 0.8 mmol, dissolved in 1.5 ml deionized water). Cu–BTC was synthesized by mixing a H3BTC (0.1739 g, 0.8 mmol) ethanol (3.8 ml) solution into the newly synthesized copper hydroxide under ultrasonic treatment for 5, 10, 30, 60, 120 minutes at room temperature through the reaction: Cu(OH)2 + H3BTC → Cu3(BTC)2 + H2O. The colour changed from light blue to dark blue quickly. The blue sample was washed thoroughly with ethanol and dried at 100 °C overnight. Cu–BDC was synthesized under the same conditions as those for Cu–BTC, except that organic ligand was H2BDC and ethanol was replaced by DMF. It was interesting to find that the colour of the newly synthesized copper hydroxide was dark blue and there was some associated black precipitation. We deem that some copper hydroxides may decompose during the ultrasonic process. But finally the precipitation disappeared and the mixture converted into Cu–BDC completely as the reaction went on. In the synthesis of Zn–BTC, firstly, a NaOH methanol solution was prepared by adding NaOH particles (0.1075 g, 2.6 mmol) into methanol (1 ml). Then it was mixed with a DMF (6 ml) solution of Zn(NO3)2·6H2O (0.4 g, 1.3 mmol) and a uniform suspension was gained via ultrasonic treatment. After that 6 ml H3BTC (0.1883 g, 0.9 mmol) DMF solution was added into the newly synthesized zinc hydroxide solution under ultrasonic irradiation for 5 minutes to 2 hours at room temperature. The obtained white crystals were isolated by filtration, washed with DMF and then dried at 150 °C under vacuum for 12 hours. Zn–BDC was synthesized with the same conditions as those for Zn–BTC, except that the organic linker was replaced by H2BDC. Zn–BDC with different molar ratio of Zn![[thin space (1/6-em)]](https://www.rsc.org/images/entities/char_2009.gif) :
:![[thin space (1/6-em)]](https://www.rsc.org/images/entities/char_2009.gif) BDC
BDC![[thin space (1/6-em)]](https://www.rsc.org/images/entities/char_2009.gif) :
:![[thin space (1/6-em)]](https://www.rsc.org/images/entities/char_2009.gif) DMF were gained for 1 hour by adding different amounts of DMF. After being washed with DMF, the products were isolated by filtration and dried at 150 °C under vacuum for 12 hours.
DMF were gained for 1 hour by adding different amounts of DMF. After being washed with DMF, the products were isolated by filtration and dried at 150 °C under vacuum for 12 hours.
2.3 Characterization
The crystalline structure of the four MOFs was investigated by powder X-ray diffraction (PXRD) recorded on a Rigaku D/Max 2400 diffractometer employing Cu Kα radiation run at 40 kV and 100 mA with a scan speed of 8° min−1 and a step size of 0.02°. Scanning electron microscopy (SEM) was used to investigate the morphologies with a Field Emission Scanning Electron Microscopy (Nova NanoSEM 450). Thermal gravimetric analysis (TGA) was carried out in a flowing N2 (60 ml min−1) atmosphere with a heating rate of 10 °C min−1 up to 600 °C using a Mettler Toledo TGA/SDTA851e instrument. The specific surface area was calculated by using the Brunauer–Emmett–Teller (BET) gas adsorption method with an ASAP 2020 Plus Automatic Micropore Physisorption Analyzer.2.4 Adsorptive desulfurization
Model oil was prepared by dissolving dibenzothiophene (DBT) in n-octane. All of the adsorption experiments were conducted in a ten millilitre of glass bottle at room temperature (25 °C) and atmospheric pressure under magnetic stirring. Prior to adsorption experiments, each MOF was degassed under vacuum at 150 °C for 2 hours to remove water and other contaminants. The model oil (5 ml) was mixed with the adsorbent (0.035 g) in the glass reactor under stirring for 1 hour. The concentration of sulfur in the oil was analyzed periodically by GC HP6890 equipped with HP-5 capillary column (φ 0.32 mm × 30 m) and a FID detector. The adsorption capacity was calculated by the formula:where Qi is the adsorption capacity of sulfur adsorbed on the adsorbent (mg S g−1 MOF), W is the mass of model oil (g), M is the mass of MOF used (g), C0 and Ci are the initial and final S-concentrations in the model oil (mg g−1), respectively.
3. Results and discussion
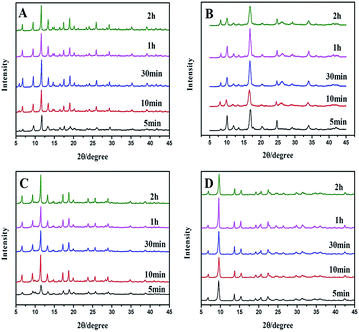
Powder X-ray diffraction (PXRD) patterns (Fig. 2A) clearly demonstrate that pure Cu–BTC phase is formed from the newly prepared copper hydroxide. Impurities such as Cu2O are not observed as there is no reflection at 36.4° ascribed to Cu2O. The longer the reaction time is, the stronger the PXRD peaks are, indicating that better Cu–BTC crystals are formed with increasing reaction time. After 30 minutes, the intensities of the peaks no longer increase, which means that all of the copper hydroxides convert into Cu–BTC. The PXRD patterns of Cu–BDC and Zn–BTC (Fig. 2B and C) are the same with the literature previously reported.24,25 The main peaks of the Zn–BDC (Zn![[thin space (1/6-em)]](https://www.rsc.org/images/entities/char_2009.gif) :
:![[thin space (1/6-em)]](https://www.rsc.org/images/entities/char_2009.gif) BDC = 2
BDC = 2![[thin space (1/6-em)]](https://www.rsc.org/images/entities/char_2009.gif) :
:![[thin space (1/6-em)]](https://www.rsc.org/images/entities/char_2009.gif) 1, denoted as Zn–BDC_1, Fig. 2D) match well with the published XRD patterns for MOF-5.26 However, a striking difference between the original MOF-5 and Zn–BDC_1 in the PXRD patterns is the relative intensity of low-angle reflections. The intensity ratio of the peak at 6.8° to that at 9.7° is quite low, which is opposite to the original MOF-5, implying low porosity according to the conclusion drawn by Hafizovic et al.27
1, denoted as Zn–BDC_1, Fig. 2D) match well with the published XRD patterns for MOF-5.26 However, a striking difference between the original MOF-5 and Zn–BDC_1 in the PXRD patterns is the relative intensity of low-angle reflections. The intensity ratio of the peak at 6.8° to that at 9.7° is quite low, which is opposite to the original MOF-5, implying low porosity according to the conclusion drawn by Hafizovic et al.27
 | ||
| Fig. 2 PXRD of (A) Cu–BTC (B) Cu–BDC (C) Zn–BTC and (D) Zn–BDC (M/L = 2) synthesized under ultrasonic at room temperature from 5 minutes to 2 hours. | ||
Moreover, the crystalline structures and phases of Zn–BDC are affected by the proportion and concentration of reactants (Table 1 and Fig. 3). As shown in the Fig. 3A, mixed crystalline products (later denoted as Zn–BDC_2) of MOF-5 and Zn3(BDC)3(H2O)2·4DMF28 are synthesized for different time, while reactant metal/ligand (M/L) ratio is 1.33. Fig. 3B shows the effect of M/L in the range from 0.5 to 3. MOF-5 can be obtained with M/L ≥2 on comparable timescales. For M/L <1.33, the final product is an unknown phase29 rather than MOF-5. Reducing the M/L ratio to less than 2 causes terephthalic acid to be excess, which prevents the formation of MOF-5 phase. The concentration of reactants is also adjusted by adding different amounts of DMF (Fig. 3C). Interestingly, MOF-5 is produced at lower concentration, though the M/L ratio is 1.33. This could be due to that lower concentration leads to a relative high pH, which is favourable for the synthesis of MOF-5.30
![[thin space (1/6-em)]](https://www.rsc.org/images/entities/char_2009.gif) :
:![[thin space (1/6-em)]](https://www.rsc.org/images/entities/char_2009.gif) BDC
BDC![[thin space (1/6-em)]](https://www.rsc.org/images/entities/char_2009.gif) :
:![[thin space (1/6-em)]](https://www.rsc.org/images/entities/char_2009.gif) DMF
DMF
| Sample ID | Zn![[thin space (1/6-em)]](https://www.rsc.org/images/entities/char_2009.gif) : :![[thin space (1/6-em)]](https://www.rsc.org/images/entities/char_2009.gif) BDC BDC![[thin space (1/6-em)]](https://www.rsc.org/images/entities/char_2009.gif) : :![[thin space (1/6-em)]](https://www.rsc.org/images/entities/char_2009.gif) DMF (molar ratio) DMF (molar ratio) |
Observed crystalline phases |
|---|---|---|
| Zn–BDC_1 | 2![[thin space (1/6-em)]](https://www.rsc.org/images/entities/char_2009.gif) : :![[thin space (1/6-em)]](https://www.rsc.org/images/entities/char_2009.gif) 1 1![[thin space (1/6-em)]](https://www.rsc.org/images/entities/char_2009.gif) : :![[thin space (1/6-em)]](https://www.rsc.org/images/entities/char_2009.gif) 230 230 |
MOF-5 |
| Zn–BDC_2 | 1.33![[thin space (1/6-em)]](https://www.rsc.org/images/entities/char_2009.gif) : :![[thin space (1/6-em)]](https://www.rsc.org/images/entities/char_2009.gif) 1 1![[thin space (1/6-em)]](https://www.rsc.org/images/entities/char_2009.gif) : :![[thin space (1/6-em)]](https://www.rsc.org/images/entities/char_2009.gif) 230 230 |
MOF-5, Zn3(BDC)3(H2O)2·4DMF |
| Zn–BDC_3 | 3![[thin space (1/6-em)]](https://www.rsc.org/images/entities/char_2009.gif) : :![[thin space (1/6-em)]](https://www.rsc.org/images/entities/char_2009.gif) 1 1![[thin space (1/6-em)]](https://www.rsc.org/images/entities/char_2009.gif) : :![[thin space (1/6-em)]](https://www.rsc.org/images/entities/char_2009.gif) 230 230 |
MOF-5 |
| Zn–BDC_4 | 1![[thin space (1/6-em)]](https://www.rsc.org/images/entities/char_2009.gif) : :![[thin space (1/6-em)]](https://www.rsc.org/images/entities/char_2009.gif) 1 1![[thin space (1/6-em)]](https://www.rsc.org/images/entities/char_2009.gif) : :![[thin space (1/6-em)]](https://www.rsc.org/images/entities/char_2009.gif) 230 230 |
Unknown phase |
| Zn–BDC_5 | 0.5![[thin space (1/6-em)]](https://www.rsc.org/images/entities/char_2009.gif) : :![[thin space (1/6-em)]](https://www.rsc.org/images/entities/char_2009.gif) 1 1![[thin space (1/6-em)]](https://www.rsc.org/images/entities/char_2009.gif) : :![[thin space (1/6-em)]](https://www.rsc.org/images/entities/char_2009.gif) 230 230 |
Unknown phase |
| Zn–BDC_6 | 2![[thin space (1/6-em)]](https://www.rsc.org/images/entities/char_2009.gif) : :![[thin space (1/6-em)]](https://www.rsc.org/images/entities/char_2009.gif) 1 1![[thin space (1/6-em)]](https://www.rsc.org/images/entities/char_2009.gif) : :![[thin space (1/6-em)]](https://www.rsc.org/images/entities/char_2009.gif) 345 345 |
MOF-5 |
| Zn–BDC_7 | 1.33![[thin space (1/6-em)]](https://www.rsc.org/images/entities/char_2009.gif) : :![[thin space (1/6-em)]](https://www.rsc.org/images/entities/char_2009.gif) 1 1![[thin space (1/6-em)]](https://www.rsc.org/images/entities/char_2009.gif) : :![[thin space (1/6-em)]](https://www.rsc.org/images/entities/char_2009.gif) 345 345 |
MOF-5 |
| Zn–BDC_8 | 2![[thin space (1/6-em)]](https://www.rsc.org/images/entities/char_2009.gif) : :![[thin space (1/6-em)]](https://www.rsc.org/images/entities/char_2009.gif) 1 1![[thin space (1/6-em)]](https://www.rsc.org/images/entities/char_2009.gif) : :![[thin space (1/6-em)]](https://www.rsc.org/images/entities/char_2009.gif) 460 460 |
MOF-5 |
| Zn–BDC_9 | 1.33![[thin space (1/6-em)]](https://www.rsc.org/images/entities/char_2009.gif) : :![[thin space (1/6-em)]](https://www.rsc.org/images/entities/char_2009.gif) 1 1![[thin space (1/6-em)]](https://www.rsc.org/images/entities/char_2009.gif) : :![[thin space (1/6-em)]](https://www.rsc.org/images/entities/char_2009.gif) 460 460 |
MOF-5 |
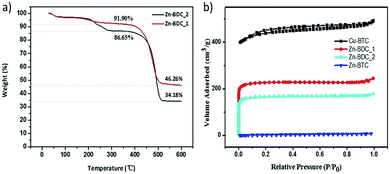
Thermal gravimetric (TG) analyses of Zn–BDC_1 and Zn–BDC_2 were carried out in a flowing N2 atmosphere and the results were shown in Fig. 4a. Both of them show a 3% weight loss in the temperature range 30–100 °C, which is assigned to the H2O desorption. Another weight loss of 4% and 9.9% appears in the range 150 °C to 300 °C for samples Zn–BDC_1 and Zn–BDC_2 respectively. This part of loss is assigned to DMF desorption and it reveals that Zn–BDC_2 contains more solvent molecules than Zn–BDC_1. The calculated theoretical weight loss for the desolvated, original MOF-5 upon decomposition to ZnO is 57.7%, whereas the observed weight losses for samples Zn–BDC_1 and Zn–BDC_2 are 49.7% and 60.6%, respectively. The less weight loss in Zn–BDC_1 can be assigned to ZnO impurities in this sample and the larger weight loss in Zn–BDC_2 is due to some coexisting Zn3(BDC)3(H2O)2·4DMF phase.
 | ||
| Fig. 4 (a) TGA curves of Zn–BDC_1 and Zn–BDC_2. (b) N2 adsorption–desorption isotherms of Cu–BTC, Zn–BDC_1, Zn–BDC_2 and Zn–BTC. | ||
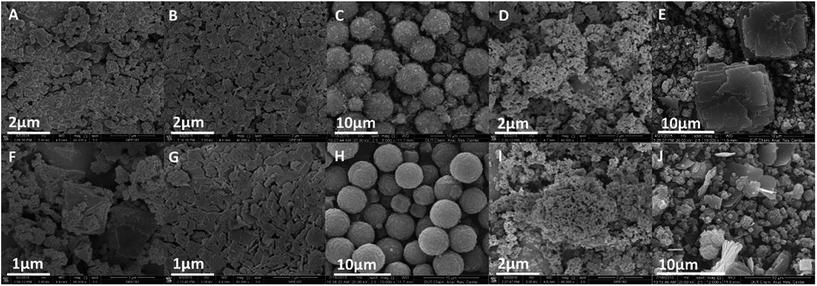
The morphologies of different MOFs were investigated using scanning electron microscopy (SEM). As seen in Fig. 5A, less defined Cu–BTC crystals with size less than 1 μm form at 5 minutes and no crystals with larger dimensions are identified. Then, the classical octahedral HKUST-1 is observed after 1 hour (Fig. 5F). The SEM image (Fig. 5B) reveals that Cu–BDC exhibits lamellar morphology with inconsistent size. Moreover, crystals become more compact (Fig. 5G) when prolonging the reaction time to 1 hour. Spherical Zn–BTC with 4–6 μm diameter is produced after 1 hour ultrasonic process and it seems smoother compared with that obtained after only 5 minutes, as visualized by SEM (Fig. 5C and H). The Zn–BTC in this paper exhibited different crystal-profile from the colourless, transparent cubic Zn–BTC ever reported.25 From the SEM images (Fig. 5D and I), uniform 150–250 nm Zn–BDC_1 nanocrystal was synthesized with this direct mixing approach. When changing the M/L ratio from 2 to 1.33, there were some square particles in Zn–BDC_2 produced at 5 minutes, while they became broken as the reaction continued for 1 hour (Fig. 5E and J). These results suggested that controlling the M/L ratio and concentration of the reactants is critical in the synthesis of Zn–BDC_1.
The N2 adsorption–desorption isotherms of the MOFs are shown in Fig. 4b. The curve of Cu–BTC shows type IV behavior that is attributed to microporosity and mesoporosity and the BET surface area is 1721 m2 g−1. The BET results also exhibit that Zn–BDC_1 has the higher specific surface area (687 m2 g−1) than Zn–BDC_2 (504 m2 g−1). Both of them show low numerical values of BET surface area compared with the original MOF-5. This could be attributed to the partial blocking in internal space of crystals. Zn–BTC shows the lowest BET surface area (<10 m2 g−1) for its densified surface upon drying.25
After activation under vacuum at 150 °C for 2 hours to remove water and other contaminants, the MOFs were used as the adsorbents to remove sulfur compounds from model liquid fuel. The results show that the adsorbing capacity of Cu–BTC for DBT at room temperature is 8 mg S g−1 MOF. However, the adsorbing capacity of Cu–BDC, Zn–BTC and Zn–BDC are 0.32, 0.14 and 0.33 mg S g−1 MOF, respectively, much lower than that of Cu–BTC. Among the MOFs in this paper, Cu–BTC owns the largest BET surface areas, implying more binding sites for the sulfides. As to Cu–BDC, its lamellar geometry forms two-dimensional tunnels24,31 making it disadvantageous to three dimensions structure. For Zn–BTC, although the framework retains its crystallinity, it exhibits the lowest BET surface area and its densified surface upon drying effectively prevents the entry of guest molecular species. On the other hand, in accordance with Pearson's hard-soft acid–base principle,32 the S-compounds tend to be soft base, and prefer to interact with soft Lewis acid sites, such as Ag+, Au+, Cu2+ and Zn2+, while show comparatively weak interaction with hard Lewis acid sites such as Al3+, Cr3+, Co3+ and Fe3+. Zn–BDC_1, MOF with Zn2+ as metal centre, however, shows low adsorption efficiency for DBT, possibly because its main crystallized phase—MOF-5 has no accessible exposed metal sites.33 In summary, the sulfur adsorption capacity of the MOFs in this work is comparable to those reported,34–37 but herein MOFs are much easier and more economical to be prepared. To our knowledge, it is the first time for the MOFs prepared via this method to use for sulfur removal.
4. Conclusions
In conclusion, we have demonstrated the successful synthesis of four kinds of MOFs via directly adding organic ligands into the newly synthetic metal hydroxide under ultrasonic at room temperature. MOFs synthesized via this facile method have been used as the adsorbents to remove sulfur compounds from liquid fuel. This reliable synthetic method does shed light on the possibilities for production of many other MOFs in only 1 hour. In addition, the examples that we gave for adsorption of sulfur already indicates their promising application in future.Acknowledgements
The authors are grateful for the financial support from program for New Century Excellent Talents in University (NCET-04-0270). Thanks also to Dr Xiaopeng Li at CAS Key Laboratory of Low-Carbon Conversion Science and Engineering, Shanghai Advance Research Institute (SARI) for N2 adsorption–desorption.Notes and references
- N. Stock and S. Biswas, Chem. Rev., 2012, 112, 933–969 CrossRef CAS PubMed.
- J. R. Long and O. M. Yaghi, Chem. Soc. Rev., 2009, 38, 1213–1214 RSC.
- J. Kim, H. Y. Cho and W. S. Ahn, Catal. Surv. Asia, 2012, 16, 106–119 CrossRef CAS.
- N. Campagnol, T. V. Assche, T. Boudewijns, J. Denayer, K. Binnemans, D. V. De and J. Fransaer, J. Mater. Chem. A, 2013, 1, 5827–5830 CAS.
- M. Schlesinger, S. Schulze, M. Hietschold and M. Mehring, Microporous Mesoporous Mater., 2010, 132, 121–127 CrossRef CAS.
- N. A. Khan and S. H. Jhung, Bull. Korean Chem. Soc., 2009, 30, 2921–2925 CrossRef CAS.
- Z. Li, L. Qiu, W. Wang, T. Xu, Y. Wu and X. Jiang, Inorg. Chem. Commun., 2008, 11, 1375–1377 CrossRef CAS.
- M. Y. Masoomi, A. Morsali and P. C. Junk, RSC Adv., 2014, 4, 47894–47898 RSC.
- S. Khoshhal, A. A. Ghoreyshi, M. Jahanshahi and M. Mohammadi, RSC Adv., 2015, 5, 24758–24768 RSC.
- J. S. Choi, W. J. Son, J. Kim and W. S. Ahn, Microporous Mesoporous Mater., 2008, 116, 727–731 CrossRef CAS.
- Y. K. Seo, G. Hundal, I. T. Jang, Y. K. Hwangm, C. H. Jun and J. S. Chang, Microporous Mesoporous Mater., 2009, 119, 331–337 CrossRef CAS.
- X. Wu, Z. Bao, B. Yuan, J. Wang, Y. Sun, H. Luo and S. Deng, Microporous Mesoporous Mater., 2013, 180, 114–122 CrossRef CAS.
- W. Liang and D. M. D'Alessandro, Chem. Commun., 2013, 49, 3706–3708 RSC.
- C. P. Cabello, C. O. Arean, J. B. Parra, C. O. Ania, P. Rumori and G. T. Palomino, Dalton Trans., 2015, 44, 9955–9963 RSC.
- W. Yuan, A. L. Garay, A. Pichon, R. Clowes, C. D. Wood, A. I. Cooper and D. L. James, CrystEngComm, 2010, 12, 4063–4065 RSC.
- H. Yang, S. Orefuwa and A. Goudy, Microporous Mesoporous Mater., 2011, 143, 37–45 CrossRef CAS.
- M. Klimakow, P. Klobes, K. Rademann and F. Emmerling, Microporous Mesoporous Mater., 2012, 154, 113–118 CrossRef CAS.
- Y. Jia, C. Sun, Y. Peng, W. Fang, X. Yan, D. Yang, J. Zou, S. S. Mao and X. Yao, J. Mater. Chem. A, 2015, 3, 8294–8299 CAS.
- J. K. Kim, Y. J. Li, P. B. Kreider, C. H. Chang, N. Wannenmacher, P. K. Thallapally and H. G. Ahn, Chem. Commun., 2013, 49, 11518–11520 RSC.
- L. Na, L. Zhang, W. Zhang and R. Hua, Synth. React. Inorg., Met.-Org., Nano-Met. Chem., 2015, 45, 1463–1466 CrossRef CAS.
- G. Majano and J. Perez-Ramirez, Adv. Mater., 2013, 25, 1052–1057 CrossRef CAS PubMed.
- M. Seredych, J. Rawlins and T. J. Bandosz, Ind. Eng. Chem. Res., 2011, 50, 14097–14104 CrossRef CAS.
- X. Tang and L. Shi, Langmuir, 2011, 27, 11999–12007 CrossRef CAS PubMed.
- Z. Xin, J. Bai, Y. Shen and Y. Pan, Cryst. Growth Des., 2010, 10, 2451–2454 CAS.
- J. I. Feldblyum, M. Liu, D. W. Gidley and A. J. Matzger, J. Am. Chem. Soc., 2011, 133, 18257–18263 CrossRef CAS PubMed.
- H. Li, M. Eddaoudi, M. O'Keeffe and O. M. Yaghi, Nature, 1999, 402, 276–279 CrossRef CAS.
- J. Hafizovic, M. Bjørgen, U. Olsbye, P. D. Dietzel, S. Bordiga, C. Prestipino, C. Lamberti and K. P. Lillerud, J. Am. Chem. Soc., 2007, 129, 3612–3620 CrossRef CAS PubMed.
- M. Li and M. Dinca, Chem. Mater., 2015, 27, 3203–3206 CrossRef CAS.
- B. Chen, X. Wang, X. Xi, J. Cai, H. Qi, S. Shi, J. Wang, D. Yuan and M. Fang, J. Med. Chem., 2010, 20, 3758–3767 CAS.
- H. Kim, S. Das, M. G. Kim, D. N. Dybtsev, Y. Kim and K. Kim, Inorg. Chem., 2011, 50, 3691–3696 CrossRef CAS PubMed.
- C. G. Carson, K. Hardcastle, J. Schwartz, X. Liu, C. Hoffmann, R. A. Gerhardt and R. Tannenbaum, Eur. J. Inorg. Chem., 2009, 2338–2343 CrossRef CAS.
- R. E. Pearson and J. C. Martin, J. Am. Chem. Soc., 1963, 85, 354–355 CrossRef CAS.
- J. G. Vitillo, L. Regli, S. Chavan, G. Ricchiardi, G. Spoto, P. D. C. Dietzel, S. Bordiga and A. Zecchina, J. Am. Chem. Soc., 2008, 130, 8386–8396 CrossRef CAS PubMed.
- K. A. Cychosz, A. G. Wong-Foy and A. J. Matzger, J. Am. Chem. Soc., 2008, 130, 6938–6939 CrossRef CAS PubMed.
- H. Zhang, H. Huang, C. Li, H. Meng, Y. Lu, C. Zhong, D. Liu and Q. Yang, Ind. Eng. Chem. Res., 2012, 51, 12449–12455 CAS.
- W. Dai, J. Hu, L. Zhou, S. Li, X. Hu and H. Huang, Energy Fuels, 2013, 27, 816–821 CrossRef CAS.
- L. Wu, J. Xiao, Y. Wu, S. Xian, G. Miao, H. Wang and Z. Li, Langmuir, 2014, 30, 1080–1088 CrossRef CAS PubMed.
| This journal is © The Royal Society of Chemistry 2016 |


