DOI:
10.1039/C6RA04915J
(Paper)
RSC Adv., 2016,
6, 74039-74045
New sensitizers containing amide moieties as electron-accepting and anchoring groups for dye-sensitized solar cells†
Received
24th February 2016
, Accepted 4th July 2016
First published on 19th July 2016
Abstract
In this study, we report three new dyes adopting an amide group as the electron-accepting and anchoring unit. Blue-black dye INPBA and INPDT consisting of indole donor, thiophene bridge and thioxo-pyrimidine-dione/pyrimidine-trione acceptors, exhibited maximum absorption wavelength (λmax) at 615 nm and 585 nm, respectively, and extended the cut-off wavelength in near-infrared zone. INPOD exhibited significantly inferior spectral response (λmax = 461 nm) because of the weak electron-withdrawing ability of aminothiazolone acceptor. Theoretical analysis indicated that the shrink of S![[double bond, length as m-dash]](https://www.rsc.org/images/entities/char_e001.gif) C bond contributes to 30 nm red-shift of absorption when replacing the O atom with S in the INPDT. The efficiencies for device based on dye of INPDT, INPOD and INPBA are 3.9%, 3.2%, and 1.5%, respectively, which is partially evidenced by the variation trend of calculated binding energy (0.47 eV for INPDT, 0.38 eV for INPOD, 0.32 or 0.27 eV for INPBA).
C bond contributes to 30 nm red-shift of absorption when replacing the O atom with S in the INPDT. The efficiencies for device based on dye of INPDT, INPOD and INPBA are 3.9%, 3.2%, and 1.5%, respectively, which is partially evidenced by the variation trend of calculated binding energy (0.47 eV for INPDT, 0.38 eV for INPOD, 0.32 or 0.27 eV for INPBA).
Introduction
In the past two decades, increasing demand on energy has stimulated the development of solar cells. Earlier developed ruthenium (Ru) complexes still have been counted as efficient and stable sensitizers, although these dyes suffer from some defects such as the high cost, usage of noble metal and difficulties in purification, which limits their wide application.1 Photo-sensitizers show an important influence in the application of DSSCs, and organic sensitizers exhibit some unique advantages over the classical Ru dyes and silicon-based solar cell such as good photoelectrical properties and facile synthesis and versatile structure modification. Lately, the highest efficiency of the DSSCs has reached 13% using a porphyrin-based D–A sensitizer reported by Michael Grätzel.2 In addition to those dyes, various dyes have been reported in recent years, including those based on indoline,3 coumarin,4 and triarylamine.5 The organic sensitizers show molecular tuning flexibility stemming from the various π-conjugated bridge components and the D–π–A configuration, which simultaneously ensures sufficient light absorption and effective photo-induced intramolecular charge transfer features. Replacement of the widely used triarylamine donor with indoline significantly broadens the spectral response, which is ascribed to the less delocalization of the lone-pair electron of the nitrogen atom to the adjacent aromatic ring, inducing high Jsc as well as conversion efficiency. In addition to the modification on the donor unit, tremendous efforts had been made in exploring new anchor group. Most of the D–π–A organic molecules utilize cyanoacrylic acid as the anchoring moiety because of the electron-withdrawing cyano group near the anchoring carboxylic acid unit that enhances the spectral response and electron injection efficiency.6 Recently, pyridine,7 phosphinic acid,8 2-quinolinone derivative,9 pyridine N-oxide,10 cyano-benzoic acid,11 catechol,12 2-cyanopyridine,13 dipicolinic acid,14 benzoic acid,15 benzoic acid derivative,16 silyl-anchor,17 and 2-(1,1-dicyano-methylene)rhodanine (DCRD)18 were successfully applied as electron-accepting and anchoring groups. However, the efficiencies of DSSCs based on these acceptors cannot surpass the traditional cyanoacrylic acid counterparts, which may be ascribed to the low electron injection efficiency or the limited light absorption response (except the DCRD). Recently, we reported a new dye utilizing pyrimidine-2-carboxylic acid as an electron-accepting and anchoring group applied in dye-sensitized solar cells.19 However, the efficiency is still relatively low due to the limited spectral response. Thus, we aimed at developing a new anchor with strong electron-withdrawing ability, which was expected to broaden the spectral response. In this study, we have reported three new dyes (Scheme 1) containing anchors with different amide electron-withdrawing ability and investigated their photophysical properties, electrochemical properties and corresponding performance of DSSCs.
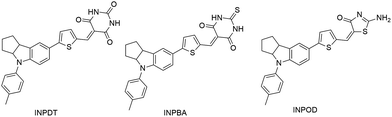 |
| | Scheme 1 Structures of series of dyes. | |
Results and discussion
Optical properties
The three new dyes were synthesized according to the routes shown in Scheme S1† and could be obtained by a simple synthetic procedure with high yield. All the new compounds were carefully characterized by 1H NMR, 13C NMR and mass spectroscopies (see the ESI†). In general, the realization of a broad spectral response that positively correlates with the achieved short current (Jsc) is vital to cell's performance. Inspired by the fact that strong donor and acceptor can red-shift the absorption band, we adopt the amide moiety as the electron accepting and anchoring group for dye sensitized solar cells. All the UV-vis data of three dyes are listed in Table 1. Both INPBA and INPDT exhibit superior spectral absorption, particularly for the dye INPBA whose maximum absorption band (λmax) is located at 615 nm in conjunction with high molar extinction coefficient (ε) of 6 × 10⁴ M−1 cm−1 (Fig. 1). The solid state of INPBA is blue-black and its diluted solution is deep blue, indicating the great light-harvesting ability. It is amazing that nearly red-shift of 30 nm was observed upon the replacement of the O atom with S atom in INPDT. The origin of the abovementioned phenomenon would be discussed in the theoretical section. INPDT also displayed good photophysical response with λmax at 585 nm and ε of 5 × 10⁴ M−1 cm−1. INPOD exhibited significantly inferior spectral response due to the weak electron-withdrawing ability of aminothiazolone (POD) acceptor.
Table 1 The data of optical and electrochemical properties
| Dye |
λmaxa (nm) |
ε (105 × M−1 cm−1) |
EHOMOb/V (vs. NHE) |
Ebandgapc (eV) |
ELUMOd/V (vs. NHE) |
| Absorption maximum in CH2Cl2 solution (1 × 10⁻⁵ M). The ground-state oxidation potential of dyes were measured in dichloromethane with 0.1 M tetra-n-butylammonium hexafluorophosphate (TBAPF6) as the electrolyte (glassy carbon working electrode, SCE reference electrode calibrated with ferrocene/ferrocenium (Fc/Fc+) as an external reference, Pt counter-electrode). Band gap derived from the wavelength at 10% maximum absorption intensity for the dye in CH2Cl2. ELUMO was calculated as EHOMO − Ebandgap. |
| INPOD |
461 |
0.14 |
0.85 |
2.25 |
−1.40 |
| INPDT |
588 |
0.50 |
0.61 |
1.86 |
−1.25 |
| INPBA |
615 |
0.61 |
0.57 |
1.77 |
−1.20 |
 |
| | Fig. 1 UV-vis absorption spectra of series of dyes in CH2Cl2 solution. | |
The absorption of the dyes on the film is shown in Fig. S1.† Compared with the absorption in a solution, INPOD showed no change in absorption position, whereas the other two dyes displayed obvious blue shift 70 nm for INPDT and 30 nm for INPBA, which may be ascribed to the formation of H aggregation or the loss of the active hydrogen in the acceptor unit. This reduced the light harvesting capacity and hampered Jsc because the dye was adsorbed on the film in the work condition. We further evaluated the light harvesting efficiency (LHE) of dye according to the formula (λ) = 1–10−Abs(λ). The LHE of three dyes were 62% for INPBA, 93% for INPDT and 97% for INPOD. The low LHE of INPBA indicated that Jsc may be relatively low.
To evaluate the energy level of the three dyes, we conducted cyclic voltammetry. As shown in Table 1 and Fig. S2,† the HOMO of three dyes were 0.57 eV for INPBA, 0.61 eV for INPDT and 0.85 eV for INPOD. The HOMO of three dyes are more positive than I−/I3−, ensuring the adequate driving force for regenerating the oxidized dye by the electron mediator. The E0–0 of the three dyes was estimated from wavelengths at 10% maximum absorption intensity in CH2Cl2, with the value of 1.77 eV, 1.86 eV and 2.25 eV. The decrease of bandgap in the order of INPBA < INPDT < INPOD is in accordance with the increase of electron-withdrawing ability and red-shift of absorption spectra. The LUMO was estimated to be −1.20 eV, −1.25 eV and −1.40 eV, indicating the sufficient driving force for the electron injection from oxidized dye into the conduction band of TiO2.
The photocurrent density–voltage curves of the cells are measured under an irradiance of 100 mW cm−2 and simulated AM 1.5 sunlight. As shown in Fig. 2 and Table 2, the device based on dye INPOD displays a short-circuit photocurrent (Jsc) of 8.62 mA cm−2, an open-circuit voltage (Voc) of 0.61 V and a fill factor (FF) of 60%, leading to a power conversion efficiency (η) of 3.2%. After replacing the POD with a PDT unit, a slight increase of Jsc is achieved. INPDT-based cell showed a Jsc of 9.26 mA cm−2, a Voc of 0.63 V and a FF of 66%, giving η of 3.9%. However, this increase is not proportionate to the huge improvement of the optical properties for INPDT compared with the INPOD. We speculate this discrepancy may origin from the weak interaction between the anchor and TiO2. This speculation is partially evidenced by the fact that the colour of TiO2 film is white after the film is immersed into solution containing dye and CDCA for 12 h. The adsorption mode of dye on TiO2 film plays a vital role in the solar cell performance.20 The plausible adsorption mode and corresponding adsorption energy are discussed in the following theoretical section. Substitution of PDT with PBA adversely impacts the performance, yielding a Jsc of 4.33 mA cm−2, a Voc of 0.56 V and a FF of 66% and η of 1.5%. To determine the origin of the huge discrepancy between the prominent photo-physical behaviour and achieved Jsc, we conducted the IPCE test. INPBA and INPDT showed low IPCE of 29% and 51% in the main absorption field, whereas INPOD exhibited IPCE of 48% (Fig. 3).
 |
| | Fig. 2 I–V curves of devices based on dyes. | |
Table 2 The performance of DSSCs based on series of dyes
| Dye |
Jsc/mA cm−2 |
Voc/V |
FF (%) |
η (%) |
| INPOD |
8.62 |
0.61 |
60 |
3.2 |
| INPDT |
9.26 |
0.63 |
66 |
3.9 |
| INPBA |
4.33 |
0.56 |
66 |
1.5 |
 |
| | Fig. 3 IPCE curves of device based on three dyes. | |
Good LHE of dye guarantees to use a relatively thin TiO2 film to ensure enough light harvesting. To harvest sufficient light, INPBA dye must utilize a thick film to increase the amount of the dye. A thick film requires long electron transportation length, thus may induce stronger recombination (discussed later), finally triggering reduced IPCE.
To explain the low Jsc of INPBA, we measure the amount of dyes adsorbed on the TiO2 film, and the absorption spectra of the dye in the desorption solution are shown in Fig S3.† The calculated amount of dye adsorbed in the film is 0.78 × 10⁻⁸ mol cm−2 for INPBA, 1.12 × 10⁻⁸ mol cm−2 for INPDT and 1.71 × 10⁻⁸ mol cm−2 for INPOD. The least amount of INPBA dye adsorbed on the film contributed to the smallest Jsc. Compared with INPBA, most amount of INPOD dye contributed to the relative large Jsc.
Electrochemical impedance spectroscopy analysis
We also conducted electrochemical impedance spectroscopy to investigate the interfacial charge–charge transfer process.21 Rct represents the recombination resistance between the electron in the conduction band of TiO2 and the redox mediator, which could be reflected by the Nyquist plot shown in Fig. 4. The radius of the large semicircle decreases in the order of INPBA < INPOD < INPDT, indicating that the electron recombination resistance increases in the order of INPDT > INPOD > INPBA, which is consistent with the variation of Voc. In the Bode phase plot, the peak of the low frequency correlates with electron lifetime. The low frequency corresponding to long electron lifetime reflects the slow recombination. The lifetime increases in the order of INPDT > INPOD > INPBA. This result is also consistent with the variation trend of Jsc and Voc. Because the stacking of the dye serving as the electron trap significantly impairs the electron transfer, we calculate the vertical distance of adjacent dye layers of the dimers. The vertical distances H between two layers of INP-dimers are 4.00 Å for INPBA, 3.99 Å for INPDT, and 3.97 Å for INPOD. The little differences in the distance indicate that the dimer has little impact on the discrepancy of efficiency. Because the amide derivative trends to form the dimers, we also calculate the binding energy for INP-dimer (Fig. S3†) with values of 0.75 eV for INPBA, 0.77 eV for INPDT, and 0.84 eV for INPOD.
 |
| | Fig. 4 Nyquist phase plots of impedance spectra. | |
Intensity-modulated photovoltage spectroscopy (IMVS) can evaluate the electron lifetime reflecting the electron recombination according to the formula τn = (1/2)πfIMVS, where fIMVS is the frequency of the minimum IMVS imaginary component. To further obtain insight into the variation of Voc, we conducted IMVS measurements (Fig. 5). It was found that the lifetime increased in the order of INPBA < INPOD < INPDT, which was in well agreement with Voc.
 |
| | Fig. 5 IMVS spectra of devices based on three dyes. | |
Computational section
We calculated the photo-absorption properties of INPBA, INPDT, and INPOD dyes using TDDFT with B3LYP functional and 6-31G(d) basis sets. The polarizable continuum model (PCM)22 was used to account for the solvation effect in CH2Cl2 for INP-dyes. Calculated spectra for INP-dyes are shown in Fig. 6. The bands at 406 nm (dye INPBA), 386 nm (dye INPDT), and 376 nm (dye INPOD) correspond to the π–π* transition of HOMO−1 → LUMO and HOMO → LUMO+1 of the conjugated system, respectively. The longest absorption peaks are correlated with the HOMO–LUMO transition corresponding to electron transfer from donor to terminal acceptor, but with the electron–hole interactions and the screening effects included. Our simulation results of absorption maximum, 602 nm for INPBA, 565 nm for INPDT, and 513 nm for INPOD, agree well with the experimental values (588 nm for INPDT, 615 nm for INPBA, and 461 nm for INPOD). In addition, the calculated molar extinction coefficients are also consistent with the experimental values. The substitution of S for O results in a significantly red-shifted absorption maximum and a great enhancement in absorption intensity, indicating a larger sunlight harvesting efficiency for dye INPBA.
 |
| | Fig. 6 Simulated absorption spectra of three dyes. | |
To penetrate into the origin of why this slight change in the conformation of sensitizer results in such a significant variation in the photo-absorption properties, we further calculated the wave function of frontier orbitals of dyes INPBA and INPDT (Fig. 7). The HOMO orbitals of both dyes are mainly located at the indoline donor part and the neighboring thiophene π-bridge, whereas the electron density of the LUMO is primarily localized at the acceptor units and to a small extent at the thiophene π-bridge. The HOMO and LUMO orbitals of both dyes are sufficiently overlapped between the donor and the acceptor groups to ensure a fast charge transfer transition. We noted that the LUMO orbital of dye INPBA is slightly more delocalized between the π-conjugation and the anchor moiety compared with that of dye INPDT (Fig. 8). This mainly resulted from the weaker electronegativity of S in contrast to O, leading to a longer bond length of CS bond (1.65 Å compared with 1.228 Å of CO bond in INPDT). Therefore, this more delocalized LUMO orbital of dye INPBA contributes to a lower energy of LUMO orbital (for INPDT), whereas the HOMO orbitals of both dyes are similar (for INPDT), thus resulting in a red-shifted absorption maximum (Table 3).
 |
| | Fig. 7 Wave functions of HOMO and LUMO frontier orbitals of dyes INPBA and INPDT. | |
 |
| | Fig. 8 Tautomerism of three dyes. | |
Table 3 Calculated maximum absorption wavelength (λmax), oscillator strengths (f), the corresponding electronic transitions, binding energies (Eb) of dimer and vertical distance (H) between two layers of dimers for INP-dyes
| Dye |
λmax (nm) |
f |
Assignmenta |
Eb (eV) |
H (Å) |
| H = HOMO, L = LUMO, L+1 = LUMO+1, etc. |
| INPBA |
602 |
1.1602 |
H → L (100%) |
0.75 |
4.00 |
| 406 |
0.4593 |
H−1 → L (84%) |
| H → L+1 (16%) |
| INPDT |
565 |
1.1408 |
H → L (100%) |
0.77 |
3.99 |
| 386 |
0.3730 |
H−1 → L (84%) |
| H → L+1 (16%) |
| INPOD |
513 |
1.0930 |
H → L (100%) |
0.84 |
3.97 |
| 376 |
0.2715 |
H−1 → L (82%) |
| H → L+1 (18%) |
To elucidate the adsorption mode of these new anchors, we performed the baseline-fitted FT-IR transmittance spectra analysis. However, we encountered the problem of a low ratio of signal to noise. Thus, we resorted to theoretical computation to analyze the absorption mode. Binding energies of chromophores on TiO2 (101) surface from all possible adsorption structures were calculated. Two initial adsorption configurations were considered for dye INPBA: configuration I is the bidentate bridging adsorption mode with an interface Ti–O bond, and chelating adsorption mode with S, N binding with the same Ti atom. Model configuration II is the bidentate adsorption mode with an interface Ti–S bond, and chelating adsorption mode with O, N binding on the same Ti atom. The adsorption energy (Eads) for configurations I and II is 0.32 eV and 0.27 eV, respectively. The energy difference is within the accuracy of DFT simulations, particularly considering that the abovementioned energies do not take into account the solution environment such as pH values. From the calculated adsorption energy, both adsorption structures of I and II mode can exist. We only considered one adsorption configuration for dye INPDT: the bidentate adsorption mode with an interface O–Ti bond and chelating adsorption mode with O, N binding on the same Ti atom. The adsorption energy is 0.47 eV. For dye INPOD, two binding configurations are considered: configuration I is two hydrogen bonds with adsorption energy of 0.38 eV; configuration II is the bidentate bridging mode with two interface Ti–N bond and Ti–S bond. However, the binding energy for configuration II is very small (0.05 eV), which might result from the dissociation of N–H bond. The binding energy increased in the order of INPDT > INPOD > INPBA, which was in accordance with the variation trend of efficiency (Fig. 9).
 |
| | Fig. 9 Adsorption structures of INP-dyes on TiO2 anatase (101) surface. | |
Conclusions
In summary, three new dyes adopting the amide groups as acceptors with different electron-withdrawing ability are synthesized and applied in the DSSCs. The cut-off wavelength of the blue-black INPBA dye extends to the infrared zone. Although both the INPBA and INPDT display good photo-physical performance, the weak interaction between anchoring unit and TiO2 leads to a relatively low efficiency. The low LHE and amount of dye adsorbed on film resulted in the poor efficiency of INPBA. Theoretical analysis indicates that the shrinking of SC bond contributes to 30 nm red-shift of absorption when replacing the O atom with S in the INPDT. The efficiencies for device based on the dye of INPDT, INPOD and INPBA are 3.9%, 3.2%, and 1.5% respectively, which is consistent with the variation trend of the calculated binding energy (0.47 eV for INPDT, 0.38 eV for INPOD, 0.32 or 0.27 eV for INPBA). Our calculation also suggests that the two adsorption modes may exist in the INPBA system. Configuration I is the bidentate bridging adsorption mode with an interface Ti–O bond, and chelating adsorption mode with S, N binding with the same Ti atom. Configuration II is the bidentate adsorption mode with an interface Ti–S bonds, and chelating adsorption mode with O, N binding on the same Ti atom. INPDT may adopt the bidentate adsorption mode with an interface O–Ti bonds, and chelating adsorption mode with O, N binding on the same Ti atom. The favoured absorption mode for the INPOD employs two hydrogen bonds with TiO2. Further exploration aimed at simultaneously improving the interaction of the anchor with TiO2 and broadening the spectral response is undertaken.
Experimental section
Measurement and characterization
The 1H and 13C NMR spectra were obtained on a Brucker AM 400 spectrometer and mass spectra were obtained on a Waters LCT Premier XE spectrometer. The UV-vis absorption spectra of the dyes in a solution and on dye-soaked films were acquired with a Varian Cary 500 spectrophotometer. The cyclic voltammograms of dyes were obtained from a Versastat II electrochemical workstation (Princeton applied research) with the conventional three electrode configuration with a Pt working electrode, a Pt wire counter electrode, and a regular calomel reference electrode in a saturated KCl solution. The supporting electrolyte was 0.1 M TBAPF6 in CH2Cl2. The scan rate was 100 mV s−1. The potential of the reference electrode was calibrated by ferrocene and all the potential data in this paper were relative to normal hydrogen electrode (NHE). The electrochemical impedance spectroscopy (EIS) was measured with the DSSCs being under dark using a Zahner IM6e Impedance Analyzer (ZAHNER-Elektrik GmbH & CoKG, Kronach, Germany). The spectra were scanned in a frequency range of 0.1 to 105 Hz with applied potential set at open circuit of the corresponding DSSCs and the alternate current amplitude was set at 10 mV. The current–density voltage (J–V) characteristics of the DSSCs were measured by recording J–V curves using a Keithley 2400 source meter under the illumination of AM 1.5 G simulated solar light (Newport-91160 equipped with a 300 W Xe lamp and an AM 1.5 G filter). The incident light intensity was calibrated to 100 mW cm−2 with a standard silicon solar cell (Newport 91150V). Action spectra of the incident monochromatic photon-to-electron conversion efficiency (IPCE) for the solar cells were obtained with a Newport-74125 system (Newport Instruments). The intensity of monochromatic light was measured using a Si detector (Newport-71640).
Materials
All reagents that were used in the process were obtained from J&K Chemical Co. and Aladdin Chemical Co., which were used without further purification. Tetrahydrofuran (THF) and toluene were disposed by primary procedures. The FTO conducting glass (F-doped SnO, transmission > 90% in the visible, sheet resistance 15 Ω per square, Geao Science and Educational Co. Ltd. of China) was handled with detergent, redistilled water, ethanol, chloroform and acetone successively under an ultrasound cleaner for 30 min 5-(4-(p-tolyl)-1,2,3,3a,4,8b-hexahydrocyclopenta[b]indol-7-yl)thiophene-2-carbaldehyde was prepared according to the literature procedure.23
Fabrication of DSSCs
The thin TiO2 films (12 μm) consisting of a transparent layer (Ti-Nanoxide T/SP) and a 4 μm scattering layer (Ti-Nanoxide 300) were coated on a well-cleaned FTO conducting glass using a screen printing technique, followed by calcinating at 500 °C under an air flow in a muffle for 30 min. While cooling to room temperature, the obtained films were immersed in 0.05 M aqueous TiCl4 solution for 30 min at 75 °C, followed by washing with redistilled water and anhydrous ethanol and annealing at 450 °C for 30 min. After the obtained films were cooled and immersed into the dye solution (0.1 M in the required solvents) for 12 h, the dyes were loaded on the film. Then, the working electrodes were rinsed with chloroform and anhydrous ethanol. A thick Pt layer (∼100 nm) was deposited on the conductive surface of the Pt-counter electrodes and two holes (0.8 mm diameter) were drilled into the Pt-counter electrodes. A sandwich type solar cell was assembled with the working and Pt-counter electrodes and sealed with a hot-melt gasket of 25 μm thickness. The electrolyte was injected into the cell from the holes and the fabrication of the solar cells was finally completed by sealing the holes using a UV-melt gum. The composition of the electrolytes was 0.1 M lithium iodide, 0.6 M 1,2-dimethyl-3-propylimidazolium iodide (DMPII), 0.05 M I2, and 0.5 M 4-tertbutylpyridine (4-TBP) in acetonitrile as a liquid electrolyte.
Synthesis
5-((5-(4-(p-Tolyl)-1,2,3,3a,4,8b-hexahydrocyclopenta[b]indol-7-yl)thiophen-2-yl)methylene)pyrimidine-2,4,6(1H,3H,5H)-trione (INPDT). Equimolar quantities of compound 5-(4-(p-tolyl)-1,2,3,3a,4,8b-hexahydrocyclopenta[b]indol-7-yl)thiophene-2-carbaldehyde (359 mg, 1 mmol) and pyrimidine-2,4,6(1H,3H,5H)-trione (128 mg, 1 mmol) in EtOH (20 mL) was stirred under basic conditions (5 drops, triethylamine solution) and refluxed overnight. After the reaction completed, the solvent was removed and the mixture was purified by chromatography to afford the desired product as a blue violet powder. Mp 285.1–285.9 °C. 1H NMR (400 MHz, DMSO-d6, ppm), 11.19 (d, J = 8.7 Hz, 2H), 8.44 (d, J = 2.7 Hz, 1H), 8.13 (d, J = 4.3 Hz, 1H), 7.64 (d, J = 3.8 Hz, 2H), 7.55 (td, J = 8.5, 1.9 Hz, 1H), 7.28–7.19 (m, 4H), 6.84 (d, J = 8.5 Hz, 1H), 4.97 (d, J = 6.8 Hz, 1H), 3.88 (d, J = 8.6 Hz, 1H), 2.30 (s, 3H), 2.01 (m, 1H), 1.83 (m, 3H), 1.65 (m, 1H), 1.52 (m, 1H). 13C NMR (100 MHz, DMSO-d6), δ: 178.29, 162.92, 162.50, 161.49, 150.34, 149.66, 146.68, 138.92, 136.60, 134.16, 132.71, 130.41, 129.73, 127.94, 124.03, 123.44, 122.95, 121.33, 108.60, 107.24, 69.20, 44.67, 35.36, 33.23, 24.36, 20.95. HRMS (m/z): [M]+ calculated for C27H24N3O3S, 470.1538; found, 470.1540.
(E)-2-Amino-5-((5-(4-(p-tolyl)-1,2,3,3a,4,8b-hexahydrocyclo-penta[b]indol-7-yl)thiophen-2-yl)methylene)thiazol-4(5H)-one (INPOD). The synthetic method resembles that of INPDT. Mp 241.8–242.2 °C. 1H NMR (400 MHz, DMSO-d6, ppm), 7.77 (s, 1H), 7.51 (d, J = 4.2 Hz, 1H), 7.48 (s, 1H), 7.46 (d, J = 3.9 Hz, 1H), 7.39–7.33 (m, 1H), 7.25–7.17 (m, 4H), 4.94–4.85 (m, 1H), 3.86 (t, J = 8.6 Hz, 1H), 2.29 (s, 3H), 2.01 (m, 1H), 1.83 (m, 3H), 1.65 (m, 1H), 1.52 (m, 1H). 13C NMR (100 MHz, DMSO-d6), δ: 146.86, 144.35, 144.23, 143.10, 132.71, 131.66, 130.44, 130.26, 129.40, 129.25, 127.53, 125.80, 124.70, 123.88, 120.44, 114.98, 77.95, 45.09, 31.57, 30.53, 25.76, 22.66, 14.09, 11.11. [M]+ calculated for C26H23N3OS2, 457.1283; found, 458.1363.
2-Thioxo-5-((5-(4-(p-tolyl)-1,2,3,3a,4,8b-hexahydrocyclop-enta-[b]indol-7-yl)thiophen-2-yl)methylene)dihydropyri-midine-4,6-(1H,5H)-dione (INPBA). The synthetic method resembles that of INPDT. Mp 277.9–279.3 °C. 1H NMR (400 MHz, DMSO-d6, ppm) 12.30 (d, J = 5.5 Hz, 2H), 8.44 (s, 1H), 8.17 (d, J = 4.4 Hz, 1H), 7.70–7.62 (m, 2H), 7.58 (dd, J = 8.4, 1.8 Hz, 1H), 7.27–7.18 (m, 4H), 6.81 (d, J = 8.5 Hz, 1H), 4.96 (d, J = 6.8 Hz, 1H), 3.86 (d, J = 8.6 Hz, 1H), 2.30 (s, 3H), 2.10–2.02 (m, 2H), 1.83–1.71 (m, 3H), 1.66–1.57 (m, 1H). 13C NMR (100 MHz, DMSO-d6), δ: 178.22, 162.12, 162.70, 161.21, 150.11, 149.66, 145.68, 138.92, 136.33, 134.03, 132.71, 130.41, 129.73, 127.94, 124.13, 123.44, 122.95, 121.33, 108.60, 107.24, 69.20, 44.67, 35.36, 33.23, 24.36, 20.95. [M]+ calculated for C27H24N3O2S2, 486.1310; found, 486.1308.
Acknowledgements
For financial support of this research, we thank the Science Fund for Creative Research Groups (21421004) and NSFC/China (21172073, 21372082, 21572062, 91233207 and 21406137).
Notes and references
- Q. Yu, Y. Wang, Z. Yi, N. Zu, J. Zhang, M. Zhang and P. Wang, ACS Nano, 2010, 4, 6032–6038 CrossRef CAS PubMed.
- S. Mathew, A. Yella, P. Gao, R. Humphry-Baker, B. F. E. Curchod, N. Ashari-Astani, I. Tavernelli, U. Rothlisberger, M. K. Nazeeruddin and M. Grätzel, Nat. Chem., 2014, 6, 242–247 CrossRef CAS PubMed.
-
(a) Z. Wu, X. Li, J. Li, J. Hua, H. Ågren and H. Tian, Chem.–Asian J., 2014, 9, 3549–3557 CrossRef CAS PubMed;
(b) J. Yang, P. Ganesan, J. Teuscher, T. Moehl, Y. J. Kim, C. Yi, P. Comte, K. Pei, T. W. Holcombe, M. K. Nazeeruddin, J. Hua, S. M. Zakeeruddin, H. Tian and M. Grätzel, J. Am. Chem. Soc., 2014, 136, 5722–5730 CrossRef CAS PubMed.
-
(a) N. G. Naumov, D. V. Soldatov, J. A. Ripmeester, S. B. Artemkina and V. E. Fedorov, Chem. Commun., 2001, 571–572 RSC;
(b) B. Liu, R. Wang, W. Mi, X. Li and H. Yu, J. Mater. Chem., 2012, 22, 15379–15387 RSC;
(c) K. Hara, T. Sato, R. Katoh, A. Furube, Y. Ohga, A. Shinpo, S. Suga, K. Sayama, H. Sugihara and H. Arakawa, J. Phys. Chem. B, 2002, 107, 597–606 CrossRef.
-
(a) Z. Yao, M. Zhang, H. Wu, L. Yang, R. Li and P. Wang, J. Am. Chem. Soc., 2015, 137, 3799–3802 CrossRef CAS PubMed;
(b) M. Zhang, Y. L. Wang, M. F. Xu, W. T. Ma, R. Z. Li and P. Wang, Energy Environ. Sci., 2013, 6, 2944–2949 RSCT. Yasuda, Y. Shinohara, T. Matsuda, L. Han and T. Ishi-i, J. Mater. Chem., 2012, 22, 2539–2544 RSC;
(c) C. Qin, A. Islam and L. Han, J. Mater. Chem., 2012, 22, 19236–19243 RSC;
(d) A. Hagfeldt, G. Boschloo, L. Sun, L. Kloo and H. Pettersson, Chem. Rev., 2010, 110, 6595–6663 CrossRef CAS PubMed;
(e) J. Lu, X. Xu, K. Cao, J. Cui, Y. Zhang, Y. Shen, X. Shi, L. Liao, Y. Cheng and M. Wang, J. Mater. Chem. A, 2013, 1, 10008–10015 RSC;
(f) J. Lu, B. Zhang, H. Yuan, X. Xu, K. Cao, J. Cui, S. Liu, Y. Shen, Y. Cheng, J. Xu and M. Wang, J. Phys. Chem. C, 2014, 118, 14739–14748 CrossRef CAS;
(g) J. Y. Liu, J. Zhang, M. F. Xu, D. F. Zhou, X. Y. Jing and P. Wang, Energy Environ. Sci., 2011, 4, 3021–3029 RSC;
(h) D. Sahu, H. Padhy, D. Patra, J.-F. Yin, Y.-C. Hsu, J.-T. S. Lin, K.-L. Lu, K.-H. Wei and H.-C. Lin, Tetrahedron, 2011, 67, 303–311 CrossRef CAS;
(i) D. Kekuda, J.-S. Huang, M. Velusamy, J. T. Lin and C.-W. Chu, Sol. Energy Mater. Sol. Cells, 2010, 94, 1767–1771 CrossRef CAS;
(j) A. Yella, C. L. Mai, S. M. Zakeeruddin, S. N. Chang, C. H. Hsieh, C. Y. Yeh and M. Grätzel, Angew. Chem., Int. Ed., 2014, 53, 2973–2977 CrossRef CAS PubMed;
(k) Z. Wu, X. Li, J. Li, H. Agren, J. Hua and H. Tian, J. Mater. Chem. A, 2015, 3, 14325–14333 RSC;
(l) J. Liu, X. Yang, A. Islam, Y. Numata, S. Zhang, N. T. Salim, H. Chen and L. Han, J. Mater. Chem. A, 2013, 1, 10889–10897 RSC.
- J. Wiberg, T. Marinado, D. P. Hagberg, L. Sun, A. Hagfeldt and B. Albinsson, J. Phys. Chem. C, 2009, 113, 3881–3886 CAS.
- Y. Ooyama, S. Inoue, T. Nagano, K. Kushimoto, J. Ohshita, I. Imae, K. Komaguchi and Y. Harima, Angew. Chem., Int. Ed., 2011, 50, 7429–7433 CrossRef CAS PubMed.
- I. Lopez-Duarte, M. K. Wang, R. Humphry-Baker, M. Ince, M. V. Martinez-Diaz, M. K. Nazeeruddin, T. Torres and M. Grätzel, Angew. Chem., Int. Ed., 2012, 51, 1895–1898 CrossRef CAS PubMed.
- P. Ganesan, A. Chandiran, P. Gao, R. Rajalingam, M. Grätzel and M. K. Nazeeruddin, J. Phys. Chem. C, 2014, 118, 16896–16903 CAS.
- L. Wang, X. Yang, J. Zhao, F. Zhang, X. Wang and L. Sun, ChemSusChem, 2014, 7, 2640–2646 CrossRef CAS PubMed.
- M. Katono, T. Bessho, S. Meng, R. Humphry-Baker, G. Rothenberger, S. M. Zakeeruddin, E. Kaxiras and M. Grätzel, Langmuir, 2011, 27, 14248–14252 CrossRef CAS PubMed.
- Y. Ooyama, T. Yamada, T. Fujita, Y. Harima and J. Ohshita, J. Mater. Chem. A, 2014, 2, 8500–8511 CAS.
- J. Mao, D. Wang, S.-H. Liu, Y. Hang, Y. Xu, Q. Zhang, W. Wu, P.-T. Chou and J. Hua, Asian J. Org. Chem., 2014, 3, 153–160 CrossRef CAS.
- E. Gabrielsson, H. Tian, S. K. Eriksson, J. Gao, H. Chen, F. Li, J. Oscarsson, J. Sun, H. Rensmo, L. Kloo, A. Hagfeldt and L. Sun, Chem. Commun., 2015, 51, 3858–3861 RSC.
- Z. Yao, M. Zhang, H. Wu, L. Yang, R. Li and P. Wang, J. Am. Chem. Soc., 2015, 137, 3799–3802 CrossRef CAS PubMed.
- K. Kakiage, Y. Aoyama, T. Yano, T. Otsuka, T. Kyomen, M. Unno and M. Hanaya, Chem. Commun., 2014, 50, 6379–6381 RSC.
- K. Kakiage, Y. Aoyama, T. Yano, K. Oya, T. Kyomen and M. Hanaya, Chem. Commun., 2015, 51, 6315–6317 RSC.
- J. Y. Mao, N. N. He, Z. J. Ning, Q. Zhang, F. L. Guo, L. Chen, W. J. Wu, J. L. Hua and H. Tian, Angew. Chem., Int. Ed., 2012, 51, 9873–9876 CrossRef CAS PubMed.
- Z. Wu, X. Li, H. Ågren, J. Hua and H. Tian, ACS Appl. Mater. Interfaces, 2015, 7, 26355–26359 CAS.
- J. M. Rehm, G. L. McLendon, Y. Nagasawa, K. Yoshihara, J. Moser and M. Grätzel, J. Phys. Chem., 1996, 100, 9577–9578 CrossRef.
- A. Fillinger and B. A. Parkinson, J. Electrochem. Soc., 1999, 146, 4559–4564 CrossRef CAS.
- M. Cossi, N. Rega, G. Scalmani and V. Barone, J. Comput. Chem., 2003, 24, 669–681 CrossRef CAS PubMed.
- W. Li, Y. Wu, Q. Zhang, H. Tian and W. Zhu, ACS Appl. Mater. Interfaces, 2012, 4, 1822–1830 CAS.
Footnotes |
| † Electronic supplementary information (ESI) available: (1) Computational section; (2) cyclic voltammetry of three dyes. See DOI: 10.1039/c6ra04915j |
| ‡ These authors contributed equally to this work. |
|
| This journal is © The Royal Society of Chemistry 2016 |
Click here to see how this site uses Cookies. View our privacy policy here. 


